
R&D Efficiency Backtest (US): 4.09% CAGR, Two Regimes, One Regime Shift
From 2000 to 2012, buying stocks with the highest gross profit per R&D dollar beat the S&P 500 consistently. Then mega-cap tech took over, and the strategy spent the next twelve years giving money back. 4.09% CAGR against 7.85% for SPY. 25-year backtest, full data, SQL included.

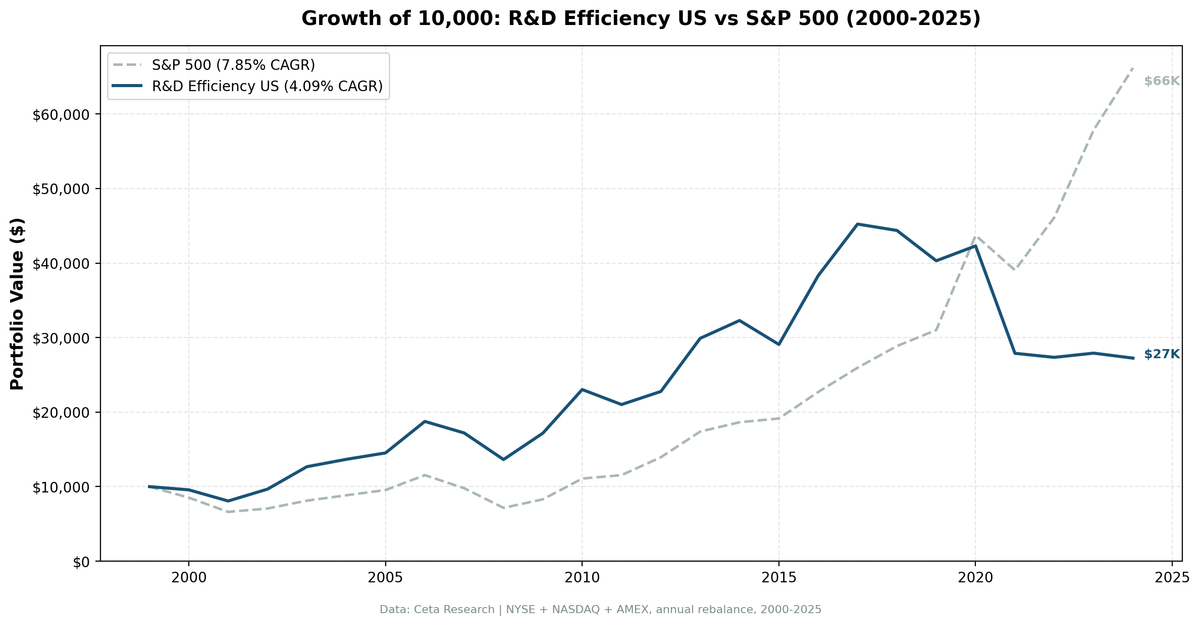
From 2000 to 2012, buying stocks with the highest gross profit per R&D dollar beat the S&P 500 consistently. Dot-com crash: the strategy held. GFC: it held again. Then the market structure changed, mega-cap tech took over, and five years wiped out two decades of accumulated lead.
Contents
- Method
- What We Found
- Two regimes, one backtest
- The regime shift
- Why mega-cap tech kills this screen
- Overall performance metrics
- The Screen
- Annual Performance
- Limitations
- Takeaway
This is the story of a signal that has a real economic rationale, works in the right market environment, and fails in a specific way that's entirely explainable. The 25-year CAGR is 4.09% vs 7.85% for SPY. But that headline buries the more interesting finding: $10,000 in this strategy was ahead of the same money in SPY in every single year from 2000 to 2019. Then 2020 through 2024 erased the whole gap and more.
Data: FMP financial data warehouse, 2000–2025. Updated August 2026.
Method
Data source: Ceta Research (FMP financial data warehouse) Universe: NYSE, NASDAQ, AMEX, market cap above $1B USD Period: 2000–2024 (25 annual rebalance periods) Execution: Next-day close (MOC, signal from prior close, entry at following close) Rebalancing: Annual (July), equal weight top 30 by R&D efficiency Benchmark: S&P 500 Total Return (SPY) Cash rule: Hold cash if fewer than 10 stocks qualify
Filters:
| Criterion | Threshold | Rationale |
|---|---|---|
| R&D / Revenue | 2–30% | Real R&D investment, not negligible or excessive |
| Gross Margin | > 40% | Excludes hardware, manufacturing, commodity companies |
| ROE | > 10% | Quality floor |
| Ranking signal | Gross Profit / R&D Expenses | Higher = more output per R&D dollar |
Transaction costs: size-tiered (0.1% for market cap > $10B, 0.3% for $2–10B, 0.5% below $2B), one-way. Historical data with 45-day point-in-time lag to prevent look-ahead bias.
Data quality guards: price rows where adjusted close spikes and then reverts within a day or two are removed before any price lookup, since those are phantom holiday rows and broken split adjustments in the vendor feed rather than real moves. Individual positions are dropped if the entry price is below $1 or the single-period return exceeds 200%. Both guards are new to this run and are the main reason the numbers here differ slightly from the version published in March 2026; the rest of the difference is the vendor restating historical fundamentals over the intervening five months.
Full methodology: backtests/METHODOLOGY.md
What We Found
Two regimes, one backtest
The 25-year chart shows a strategy that tracked with SPY through 2012, then diverged sharply downward. That split point is not arbitrary. 2013 is when FAANG companies began dominating S&P 500 returns in a way they hadn't before. Facebook, now Meta, went public in 2012. Amazon's market cap crossed $100B. Google's revenue growth reaccelerated. The composition of what drove SPY returns changed permanently.
Here's what that looked like in the first regime (2000–2012):
| Year | Portfolio | S&P 500 | Excess |
|---|---|---|---|
| 2000 | -4.30% | -14.78% | +10.48% |
| 2001 | -15.65% | -22.45% | +6.80% |
| 2002 | +19.68% | +6.86% | +12.82% |
| 2003 | +31.16% | +14.93% | +16.23% |
| 2004 | +7.82% | +8.87% | -1.05% |
| 2005 | +6.27% | +7.99% | -1.72% |
| 2006 | +29.14% | +20.95% | +8.19% |
| 2007 | -8.27% | -15.20% | +6.93% |
| 2008 | -20.71% | -26.90% | +6.19% |
| 2009 | +25.93% | +15.98% | +9.95% |
| 2010 | +34.09% | +33.55% | +0.54% |
| 2011 | -8.74% | +4.19% | -12.93% |
| 2012 | +8.36% | +20.74% | -12.38% |
From 2000 to 2010, the strategy beat SPY in nine out of eleven years. The two losses (2004, 2005) were small, under 2 points each. The wins in 2002 (+19.68% vs +6.86%), 2003 (+31.16% vs +14.93%), and 2009 (+25.93% vs +15.98%) were large.
The economic logic held: companies that extract maximum gross profit per R&D dollar tend to be in pharmaceuticals, software, and specialty chemicals, businesses where R&D translates directly to product pricing power. In the 2000s, that cohort competed against each other. The winners were genuinely better businesses.
The regime shift
Post-2012 returns tell a different story:
| Year | Portfolio | S&P 500 | Excess |
|---|---|---|---|
| 2013 | +31.32% | +24.74% | +6.58% |
| 2014 | +7.98% | +7.18% | +0.81% |
| 2015 | -9.95% | +2.71% | -12.66% |
| 2016 | +31.77% | +18.58% | +13.18% |
| 2017 | +18.04% | +14.34% | +3.70% |
| 2018 | -1.89% | +11.20% | -13.08% |
| 2019 | -9.17% | +7.43% | -16.60% |
| 2020 | +4.95% | +40.98% | -36.03% |
| 2021 | -34.07% | -10.68% | -23.38% |
| 2022 | -1.94% | +18.08% | -20.02% |
| 2023 | +2.06% | +25.44% | -23.38% |
| 2024 | -2.39% | +14.42% | -16.81% |
The pattern flips. 2013 through 2017 still looked healthy, with wins in four of five years. Then 2018 through 2024 breaks it: seven consecutive years trailing SPY, every one of them by double digits. The worst is 2020, where the portfolio returned +4.95% and SPY returned +40.98%, a gap of 36 points. Note that these are July-to-July windows, so the 2020 row covers July 2020 to July 2021, the post-COVID recovery that ran almost entirely through mega-cap tech.
Why mega-cap tech kills this screen
The R&D efficiency filter has a structural blind spot for the companies that dominated market returns from 2013 onward.
Google (Alphabet) spends roughly 15% of revenue on R&D, within the 2–30% filter range, but its gross margin has historically been 55-60%, which passes the 40% threshold. However, its R&D spending as a percentage of gross profit is high, meaning it doesn't rank at the top of the efficiency screen. Amazon's AWS segment would pass the gross margin filter, but Amazon's consolidated gross margin fluctuates, retail pulls it down.
Meta and Apple are in and out of the filter depending on the year. When they're in, they often rank mid-tier on gross profit per R&D dollar because their absolute R&D spending is enormous.
The real issue: the 30% R&D cap excludes companies during their highest-growth phases. Biotechs and early-stage platforms that spend 40-60% of revenue on R&D, the companies generating the biggest returns, never enter the screen. The filter is designed to find companies with established R&D productivity, not companies building future productivity. That distinction costs alpha in a market where growth at scale commanded ever-higher valuations.
Overall performance metrics
| Metric | Portfolio | S&P 500 |
|---|---|---|
| CAGR (2000–2024) | 4.09% | 7.85% |
| Excess CAGR | -3.76% | n/a |
| Total return | 172.5% | 561.7% |
| Max drawdown | -39.75% | -38.01% |
| Annualized volatility | 18.27% | 16.63% |
| Sharpe ratio | 0.114 | 0.352 |
| Avg stocks held | 25.0 | n/a |
| Cash periods | 0% | n/a |
$10,000 invested in 2000 grew to $27,246 in the portfolio vs $66,167 in SPY.
The max drawdown of -39.75% is worse than SPY's -38.01%. The quality filters did not buy crash protection in the US, they cost about two points of it. The risk-adjusted returns (Sharpe 0.114 against SPY's 0.352) are poor because the CAGR doesn't compensate for the extra volatility.
The Screen
Run this screen on the current universe to see today's top R&D efficiency stocks on US exchanges:
WITH inc AS (
    SELECT symbol, revenue, grossProfit, researchAndDevelopmentExpenses,
           ROW_NUMBER() OVER (PARTITION BY symbol ORDER BY dateEpoch DESC) AS rn
    FROM income_statement
    WHERE period = 'FY'
      AND revenue > 0
      AND grossProfit > 0
      AND researchAndDevelopmentExpenses > 0
)
SELECT
    inc.symbol,
    p.companyName,
    p.exchange,
    p.sector,
    ROUND(inc.researchAndDevelopmentExpenses / inc.revenue * 100, 1) AS rd_ratio_pct,
    ROUND(inc.grossProfit / inc.revenue * 100, 1) AS gross_margin_pct,
    ROUND(inc.grossProfit / inc.researchAndDevelopmentExpenses, 2) AS rd_efficiency,
    ROUND(k.returnOnEquityTTM * 100, 1) AS roe_pct,
    ROUND(p.marketCap / 1e9, 2) AS mktcap_b
FROM inc
JOIN profile p ON inc.symbol = p.symbol
JOIN key_metrics_ttm k ON inc.symbol = k.symbol
WHERE inc.rn = 1
  AND inc.researchAndDevelopmentExpenses / inc.revenue > 0.02
  AND inc.researchAndDevelopmentExpenses / inc.revenue < 0.30
  AND inc.grossProfit / inc.revenue > 0.40
  AND k.returnOnEquityTTM > 0.10
  AND p.marketCap > 1000000000
  AND p.exchange IN ('NYSE', 'NASDAQ', 'AMEX')
  AND p.isFund = false
  AND p.isEtf = false
  AND p.isActivelyTrading = true
  -- Exclude non-operating lines: warrants, rights, units and preferred shares.
  -- isFund is false for a closed-end fund's preferred line, so GAM-PB (which reports
  -- investment income as revenue at a 100% gross margin) otherwise ranks 3rd here.
  AND p.symbol NOT LIKE '%-WT'
  AND p.symbol NOT LIKE '%-RT'
  AND p.symbol NOT LIKE '%-U'
  AND p.symbol NOT LIKE '%-UN'
  AND p.symbol NOT LIKE '%-P_'
QUALIFY ROW_NUMBER() OVER (PARTITION BY p.companyName
                           ORDER BY p.averageVolume DESC) = 1
ORDER BY rd_efficiency DESC
LIMIT 30
Run this query on Ceta Research
Annual Performance
Full 25-year annual returns are in the tables above. The summary pattern: the strategy beat SPY in 13 out of 25 years, a 52% win rate. It won the early period decisively and lost the post-2013 period almost as decisively. Beta was 0.745 and Jensen's alpha -2.27%, so this wasn't a low-beta portfolio quietly earning its keep. Up capture was 70.3% against down capture of 92.2%: the screen kept only 70% of the market's gains while taking most of its losses.
The 2021 window (-34.07%) is the single worst year in absolute terms. That was a reversal inside the portfolio's own picks rather than a broad market decline, since SPY over the same July 2021 to July 2022 window fell only 10.68%.
Limitations
The regime issue is real. Post-2013 US market returns concentrated in mega-cap tech. Any factor strategy that doesn't own that cohort will underperform SPY. This isn't unique to R&D efficiency, value, momentum, and most quality screens have had the same problem in the US since roughly 2016.
The 30% R&D cap is a deliberate constraint. It filters out companies in high R&D intensity phases (biotech, growth-stage software). Those exclusions hurt US performance because many of the best-returning US stocks in the past decade were high-R&D-intensity names.
Look-ahead bias is mitigated but not eliminated. The 45-day point-in-time lag prevents use of financial data before it was publicly reported. But the survivorship bias from sector classification in the current profile table is partially present.
Annual rebalancing is coarse. R&D efficiency is a slow-moving signal. Companies don't typically change their R&D ratios quarter to quarter. Annual rebalancing is appropriate for this signal, but it misses intra-year deterioration.
Cash rule is conservative. If fewer than 10 stocks qualify, the strategy holds cash. For the US, this never triggered (0% cash periods). The universe is large enough.
Takeaway
R&D efficiency worked in the US before mega-cap tech dominated the market. The economic logic is sound: companies extracting maximum gross profit from their R&D spending have genuine competitive advantages. The problem is structural, not fundamental. The US market from 2013 onward rewarded a different kind of company than the one this screen finds.
Two questions worth discussing: Would adding a market-cap ceiling (to exclude mega-caps from SPY but not from the portfolio) change the result? And does R&D efficiency work better in markets where tech isn't also the dominant sector weight?
The UK result says yes to the second question. On the LSE the same screen returned 7.34% against the FTSE 100's 1.23%, winning in 20 of 25 years. India says no: on the NSE the screen returned 6.50% against a Sensex that compounded at 12.06%, so beating the local market is a much harder test there than beating a flat one. The cross-market comparison is linked below.
Full backtest code: github.com/ceta-research/backtests
Data: Ceta Research (FMP financial data warehouse). Returns are in USD. Past performance does not guarantee future results.
Past performance does not guarantee future results. This is educational content, not investment advice.

