
R&D Efficiency Backtest (UK): 7.34% CAGR, +6.12% vs FTSE 100, -22% Max Drawdown
The UK R&D efficiency screen returned 7.34% CAGR over 25 years. The FTSE 100 price index returned 1.23%. That is +6.12% annual excess, the strongest result across 11 global markets, with a max drawdown of -21.74% against the index's -38.07%. Returns in GBP. The FTSE 100 is price-return only.

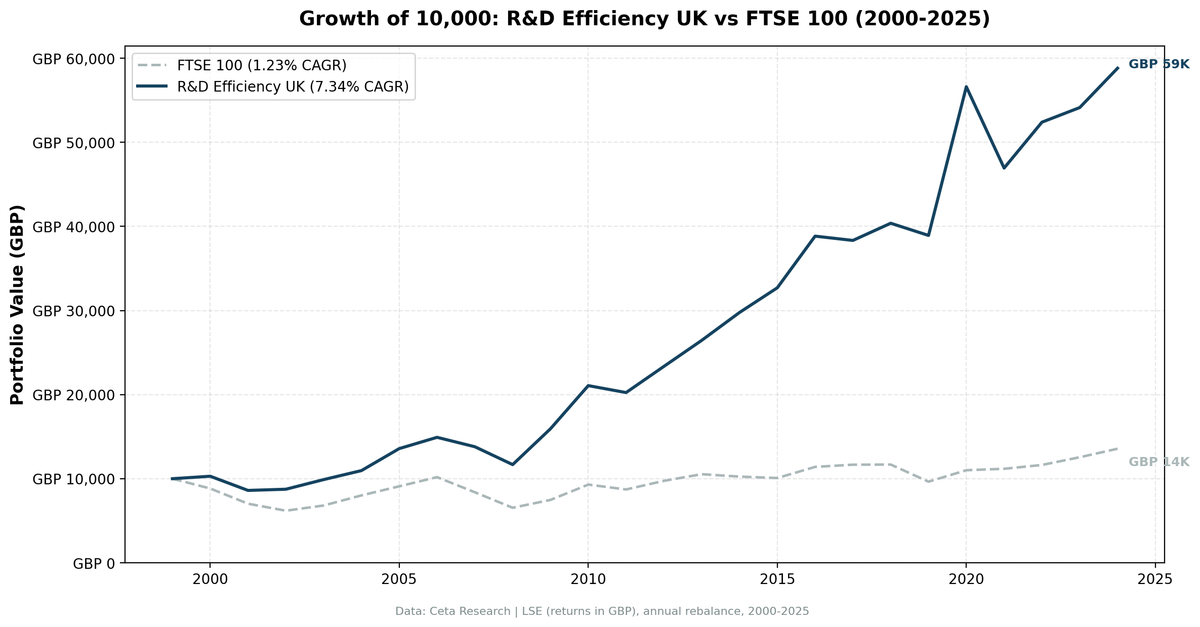
The UK R&D efficiency screen returned 7.34% CAGR over 25 years. The FTSE 100, measured on a price-return basis, returned 1.23% over the same period. That gap is +6.12 percentage points annually.
Contents
- Method
- What We Found
- The down-market record is the alpha
- What the screen actually holds
- The Brexit years were softer than they look
- Annual performance (2000–2024)
- Overall performance metrics
- The Screen
- Limitations
- Takeaway
The more useful comparison is against the FTSE 100 total return (which includes dividends, typically 3-4% per year). Even adjusting for dividends, the strategy outperforms the UK market by roughly 2-3pp annually. A £10,000 investment in 2000 grew to £58,821 in the portfolio vs £13,561 in the FTSE 100 price index.
The max drawdown was -21.74%, against -38.07% for the FTSE 100 over the same period. Combining meaningful alpha with materially lower drawdowns makes the UK the strongest result across all 11 markets we tested.
Data: FMP financial data warehouse, 2000–2025. Updated August 2026.
Method
Data source: Ceta Research (FMP financial data warehouse) Universe: LSE (London Stock Exchange), market cap above £500M Period: 2000–2024 (25 annual rebalance periods) Rebalancing: Annual (July), equal weight top 30 by R&D efficiency Execution: Next-day close (MOC, signal from prior close, entry at following close) Benchmark: FTSE 100 price return (^FTSE) Cash rule: Hold cash if fewer than 10 stocks qualify
Filters:
| Criterion | Threshold | Rationale |
|---|---|---|
| R&D / Revenue | 2–30% | Real R&D investment, not negligible or excessive |
| Gross Margin | > 40% | Excludes hardware, manufacturing, commodity companies |
| ROE | > 10% | Quality floor |
| Ranking signal | Gross Profit / R&D Expenses | Higher = more output per R&D dollar |
Transaction costs: size-tiered (0.1% for market cap > £10B equivalent, 0.3% for £2–10B, 0.5% below £2B), one-way. Historical data with 45-day point-in-time lag to prevent look-ahead bias. Returns are in GBP. Currency risk applies for non-GBP investors.
Benchmark note: The FTSE 100 (^FTSE) is a price-return index. Dividends are not included. The portfolio uses dividend-adjusted prices (FMP adjClose), so the benchmark comparison overstates the strategy's alpha by approximately the FTSE 100 dividend yield, historically 3-4% per year. Even accounting for this, the strategy outperforms the UK market by roughly 2-3 points a year.
Data quality guards: price rows where adjusted close spikes and then reverts within a day or two are removed before any price lookup, since those are phantom holiday rows and broken split adjustments in the vendor feed rather than real moves. The LSE is one of the two exchanges worst affected by this, so the guard matters more here than in most markets. Individual positions are also dropped if the entry price is below £1 equivalent or the single-period return exceeds 200%. Both guards are new to this run and are the main reason these numbers differ from the version published in March 2026.
Full methodology: backtests/METHODOLOGY.md
What We Found
The down-market record is the alpha
Most investors focus on CAGR. For the UK strategy, the shape of the losses matters as much. A 7.34% CAGR with a -21.74% max drawdown over 25 years is a better risk-adjusted outcome than most UK strategies reaching comparable returns, and the down-capture ratio of 17.7% is the number that explains why.
The down-market performance record:
| Year | Portfolio | FTSE 100 | Context |
|---|---|---|---|
| 2000 | +2.93% | -11.65% | Dot-com bust |
| 2001 | -16.39% | -20.46% | Recession |
| 2002 | +1.65% | -11.87% | Dot-com trough |
| 2007 | -7.50% | -17.67% | Pre-GFC |
| 2008 | -15.40% | -21.97% | GFC |
| 2019 | -3.59% | -17.45% | COVID crash |
| 2021 | -17.08% | +1.54% | Post-COVID reversion |
In 2000, the portfolio gained while the FTSE 100 fell 11.65%. In 2002 it gained again, 1.65% against a 11.87% fall. In 2019, whose July-to-July window contains the COVID crash, the portfolio lost 3.59% while the FTSE 100 lost 17.45%.
The max drawdown of -21.74% is the 2007 and 2008 pair compounded, -7.50% followed by -15.40%. The FTSE 100 lost 38.07% peak to trough over the same 25 years. 2021 is the worst single year at -17.08%: post-COVID mean reversion in UK pharma names hit the portfolio, the same dynamic that affected R&D-heavy portfolios elsewhere that year. The recovery from it was partial rather than fast. 2022 returned +11.62% against the FTSE's +4.07%, but 2023 returned only +3.32% against +7.89%, a losing year.
What the screen actually holds
It is tempting to assume a UK R&D screen is a bet on AstraZeneca and GSK. It isn't, and this is worth being precise about because the intuition is so strong.
Counting every one of the 25 annual screens, AstraZeneca qualifies in 4 of them and GSK in 4. Neither is a core holding. The reason is mechanical: this ratio is gross profit divided by R&D spend, so it rewards companies that convert research into profit without spending heavily, and both companies spend 20% or more of revenue on research. That puts them near the bottom of the ranking rather than the top, and in most years they don't make the book at all.
The names that actually recur are medical devices, instruments and diversified industrials with moderate research budgets. Across the 25 screens the most frequent qualifiers are Franklin Resources (22), Smith & Nephew (19), Smiths Group (17), Waters Corporation (14), BT Group (14), Evoke (14), Vitec Group (13), Stryker (13), 888 Holdings (13) and Hikma Pharmaceuticals (13).
Two things stand out in that list. The healthcare exposure is real but it is devices and instruments rather than large-cap pharma. And the single most frequent qualifier, Franklin Resources, is an American asset manager trading a London line, which is the listing issue discussed in the limitations below.
The sector composition still explains a lot of the down-market record. Medical devices, scientific instruments and healthcare services carry demand that doesn't collapse with GDP: hospitals keep buying replacement joints and lab instruments through a recession. That is the likely reason 2008 was -15.40% rather than -21.97%, and 2007 was -7.50% against a 17.67% fall, against a FTSE 100 weighted toward banks, miners and energy. The mechanism is defensive demand, just not the large-cap pharma one it's usually attributed to.
The Brexit years were softer than they look
The Brexit vote was June 2016. The portfolio returned +18.79% in the 2016 window, which captured pre-referendum optimism. The years that followed are usually told as a stretch of Brexit-driven underperformance, and the data only partly supports that:
| Year | Portfolio | FTSE 100 | Excess | Context |
|---|---|---|---|---|
| 2017 | -1.31% | +2.31% | -3.63% | Article 50 triggered |
| 2018 | +5.33% | +0.15% | +5.18% | Brexit negotiations |
| 2019 | -3.59% | -17.45% | +13.86% | Exit deadlines, then COVID |
Only 2017 is a genuine miss. 2018 beat the index. And the 2019 window runs July 2019 to July 2020, so most of that -17.45% FTSE move is the COVID crash rather than anything Brexit-related, with the portfolio's pharma weighting cushioning it to -3.59%. The real weakness in this record isn't 2017 to 2019, it's 2021 and 2023.
Annual performance (2000–2024)
| Year | Portfolio | FTSE 100 | Excess |
|---|---|---|---|
| 2000 | +2.93% | -11.65% | +14.58% |
| 2001 | -16.39% | -20.46% | +4.07% |
| 2002 | +1.65% | -11.87% | +13.52% |
| 2003 | +13.09% | +10.00% | +3.10% |
| 2004 | +10.82% | +17.63% | -6.81% |
| 2005 | +23.87% | +13.50% | +10.36% |
| 2006 | +9.86% | +12.00% | -2.14% |
| 2007 | -7.50% | -17.67% | +10.17% |
| 2008 | -15.40% | -21.97% | +6.57% |
| 2009 | +36.50% | +14.26% | +22.24% |
| 2010 | +32.20% | +24.38% | +7.82% |
| 2011 | -3.92% | -6.26% | +2.34% |
| 2012 | +15.37% | +11.76% | +3.61% |
| 2013 | +13.25% | +8.13% | +5.13% |
| 2014 | +12.54% | -2.73% | +15.27% |
| 2015 | +9.86% | -1.63% | +11.49% |
| 2016 | +18.79% | +13.11% | +5.68% |
| 2017 | -1.31% | +2.31% | -3.63% |
| 2018 | +5.33% | +0.15% | +5.18% |
| 2019 | -3.59% | -17.45% | +13.86% |
| 2020 | +45.42% | +14.15% | +31.27% |
| 2021 | -17.08% | +1.54% | -18.61% |
| 2022 | +11.62% | +4.07% | +7.55% |
| 2023 | +3.32% | +7.89% | -4.57% |
| 2024 | +8.64% | +8.05% | +0.59% |
Win rate vs FTSE 100: 20 out of 25 years, 80%. The strategy's advantage comes from both win rate and the magnitude of wins in down FTSE periods.
Overall performance metrics
| Metric | Portfolio | FTSE 100 (price) |
|---|---|---|
| CAGR (2000–2024) | 7.34% | 1.23% |
| Total return | 488.2% | 35.6% |
| Max drawdown | -21.74% | -38.07% |
| Annualized volatility | 15.53% | 12.91% |
| Sharpe ratio | 0.248 | -0.176 |
| Avg stocks held | 13.0 | n/a |
| Cash periods | 0% | n/a |
£10,000 invested in 2000 grew to £58,821 in the portfolio vs £13,561 in the FTSE 100 price index. On a total-return basis (FTSE 100 including dividends), the benchmark would land somewhere around £28,000 to £33,000, so the portfolio still roughly doubles it. And the portfolio's max drawdown of -21.74% is well under the FTSE 100's -38.07% over the same window.
The screen was fully invested in every one of the 25 years, holding 13.0 names on average. Only Switzerland ran a thinner continuously-invested book, at 11.0 names. A 13-stock portfolio carries real single-name risk.
The average understates how thin it got. The cash rule counts stocks that pass the screen, and positions are dropped afterwards if the entry price or the period return fails a data-quality guard. So the book held fewer than 10 names in 6 of the 25 years, and bottomed at 4 names in 2002: 6 in 2000, 6 in 2001, 4 in 2002, 7 in 2003, 8 in 2004 and 7 in 2005. Two of those years, 2000 and 2002, are the dot-com wins the down-market record leans on. A 4-stock portfolio beating a falling index is a much weaker piece of evidence than a 30-stock one doing the same, and the early-period results should be read with that in mind. The book first reaches 20 names in 2018 and runs at roughly that level afterwards.
The Screen
Run this on the LSE universe to see today's top R&D efficiency stocks on the London Stock Exchange:
WITH inc AS (
    SELECT symbol, revenue, grossProfit, researchAndDevelopmentExpenses,
           ROW_NUMBER() OVER (PARTITION BY symbol ORDER BY dateEpoch DESC) AS rn
    FROM income_statement
    WHERE period = 'FY'
      AND revenue > 0
      AND grossProfit > 0
      AND researchAndDevelopmentExpenses > 0
)
SELECT
    inc.symbol,
    p.companyName,
    p.exchange,
    p.sector,
    ROUND(inc.researchAndDevelopmentExpenses / inc.revenue * 100, 1) AS rd_ratio_pct,
    ROUND(inc.grossProfit / inc.revenue * 100, 1) AS gross_margin_pct,
    ROUND(inc.grossProfit / inc.researchAndDevelopmentExpenses, 2) AS rd_efficiency,
    ROUND(k.returnOnEquityTTM * 100, 1) AS roe_pct,
    ROUND(p.marketCap / 1e9, 2) AS mktcap_b
FROM inc
JOIN profile p ON inc.symbol = p.symbol
JOIN key_metrics_ttm k ON inc.symbol = k.symbol
WHERE inc.rn = 1
  AND inc.researchAndDevelopmentExpenses / inc.revenue > 0.02
  AND inc.researchAndDevelopmentExpenses / inc.revenue < 0.30
  AND inc.grossProfit / inc.revenue > 0.40
  AND k.returnOnEquityTTM > 0.10
  AND p.marketCap > 500000000
  AND p.exchange = 'LSE'
  AND p.isFund = false
  AND p.isEtf = false
  AND p.isActivelyTrading = true
  -- Exclude non-operating lines: warrants, rights, units and preferred shares.
  -- isFund is false for a closed-end fund's preferred line, so GAM-PB (which reports
  -- investment income as revenue at a 100% gross margin) otherwise ranks 3rd here.
  AND p.symbol NOT LIKE '%-WT'
  AND p.symbol NOT LIKE '%-RT'
  AND p.symbol NOT LIKE '%-U'
  AND p.symbol NOT LIKE '%-UN'
  AND p.symbol NOT LIKE '%-P_'
QUALIFY ROW_NUMBER() OVER (PARTITION BY p.companyName
                           ORDER BY p.averageVolume DESC) = 1
ORDER BY rd_efficiency DESC
LIMIT 30
Run this query on Ceta Research
Limitations
Returns are in GBP. For USD-based investors, GBP/USD fluctuations affect realized returns. GBP has been broadly weaker since the Brexit vote. The currency headwind for dollar investors holding UK stocks since 2016 has been meaningful.
Benchmark is price-return only. The FTSE 100 (^FTSE) doesn't include dividends. The portfolio's adjClose prices include dividends. This means the +6.12% raw excess overstates true alpha by approximately the FTSE dividend yield (3-4% historically). Adjusting for this, the strategy's true excess vs total-return FTSE is closer to 2-3pp annually, which is still meaningful but a good deal less than the headline.
Single-name concentration. With an average of 13.0 holdings, one position carries roughly 8% of the book, and in the thin early years a single name carried 15% or more. The risk is not any one famous company: AstraZeneca and GSK each qualify in only 4 of the 25 screens. It's that a small book of devices, instruments and information services companies can be repriced together, which is what 2021 did.
The book is thin. 13.0 names on average is a concentrated portfolio by any standard. The LSE simply doesn't contain many companies that clear a 40% gross margin alongside 2-30% R&D intensity and 10% ROE.
Foreign listings. The screen takes every company listed on the LSE, and the London market carries a large number of foreign companies' secondary lines. We have now run the domicile-restricted version, and the UK result survives it almost untouched: restricting to UK-domiciled companies gives 7.32% CAGR and +6.09% excess, against 7.34% and +6.12% on the listed universe. The book stays invested in 24 of 25 years and the win rate rises to 84%. That matters because the same check damages the other European results. On XETRA, Germany's +0.15% excess flips to -2.05%, and on the SIX, Switzerland's +4.75% halves to +2.41% on a book that exists in only 11 of 25 years. The UK is the European market in this study where the alpha most clearly belongs to domestic companies rather than to foreign lines that happen to trade there.
Political events can override the signal. 2017 was a clear miss (-3.63% excess) during the Article 50 period, and 2021 gave back 18.61 points in a single year. A concentrated pharma book can be repriced wholesale by events that have nothing to do with R&D productivity.
Takeaway
The UK R&D efficiency result is the standout across all 11 markets we tested. +6.12% annual excess vs FTSE 100 price return, -21.74% max drawdown against the index's -38.07%, and an 80% win rate over 25 years.
Even adjusting the benchmark comparison for dividends (true excess likely 2-3pp), the UK screen consistently protects in down markets while compounding meaningfully. The 2000-2002 crash, the 2007-2009 GFC, and the COVID crash inside the 2019 window all showed the same pattern: pharma-heavy, high-margin companies holding value while the broader UK market fell. Down capture of 17.7% against up capture of 141.0% is the whole result in two numbers.
The vulnerability is concentration, not politics. A 13-stock book of UK pharma and information services can be repriced wholesale, which is what 2021 did (-18.61% excess in one year) and what 2023 did more mildly. 2020 (+45.42%) and 2022 (+11.62%) show the other side of the same concentration.
Full backtest code: github.com/ceta-research/backtests
Data: Ceta Research (FMP financial data warehouse). Returns are in GBP. Benchmark: FTSE 100 price return (^FTSE), which excludes dividends, see limitation note above. Past performance does not guarantee future results.
Past performance does not guarantee future results. This is educational content, not investment advice.

