
Quality Momentum on US Stocks: 25 Years of Data
We combined quality filters (ROE>15%, low debt, positive cash flow) with 12-month price momentum to screen US stocks from 2000 to 2025. The strategy returned 8.27% annually vs 7.75% for the S&P 500 — with 0% cash periods but 106.7% down capture.

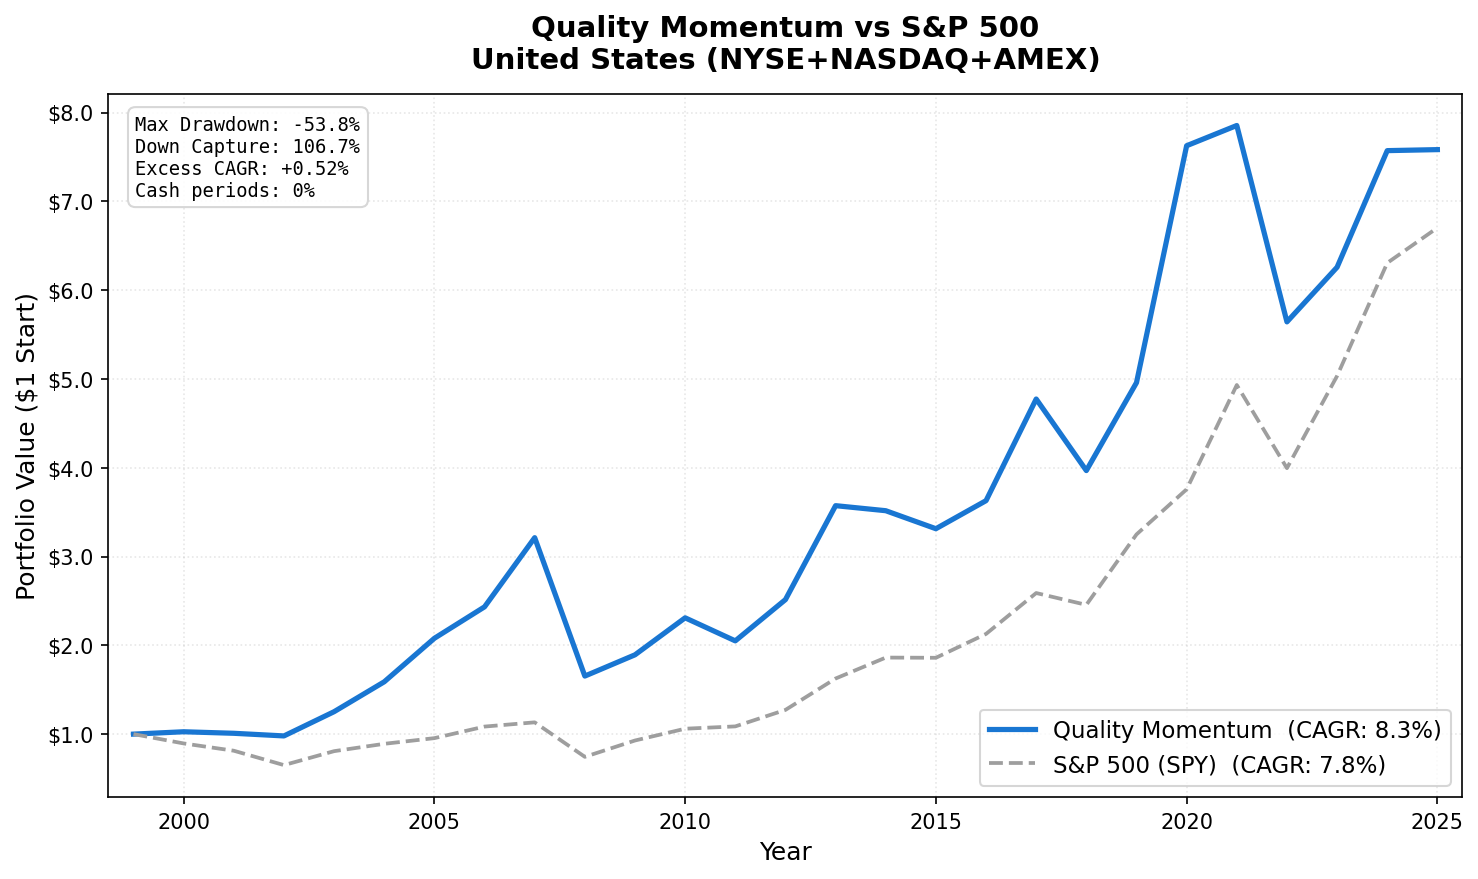
Quality + momentum is one of the most studied factor combinations in academic finance. Screen for financially sound companies, then rank by which ones are already trending upward. In theory, quality reduces your drawdown risk; momentum captures stocks that are already working. In practice on US equities, the combination delivered 8.27% annually from 2000 to 2025. That's modest alpha over the 7.75% S&P 500 benchmark, with real problems hidden in the aggregate number.
Contents
- Method
- What is Quality Momentum?
- The Screens
- What We Found
- Backtest Methodology
- Limitations
- Takeaway
- Part of a Series
- References
- Run This Screen Yourself
Data: FMP financial data warehouse, 2000–2025. Updated March 2026.
Method
| Parameter | Value |
|---|---|
| Universe | NYSE, NASDAQ, AMEX (full exchange) |
| Rebalancing | Semi-annual (January, July) |
| Holding period | 6 months |
| Max positions | 30 stocks, equal weight |
| Cash rule | Fewer than 10 qualifying stocks |
| Data source | FMP via Ceta Research warehouse |
| Benchmark | S&P 500 (SPY) |
| Period | 2000-2025 |
| Filing lag | 45 days (point-in-time) |
What is Quality Momentum?
Two separate factor streams, combined into one screen.
Quality investing traces back to Piotroski (2000) and Graham's original emphasis on financial health before valuation. The modern framing comes from Asness, Frazzini, and Pedersen's 2019 paper "Quality Minus Junk." Companies with high profitability, stable earnings, and conservative balance sheets persistently outperform. The intuition: junk companies carry more bankruptcy risk and earnings volatility than the market prices in; quality companies are systematically underpriced on a risk-adjusted basis.
Momentum has a longer empirical track record. Jegadeesh and Titman (1993) documented that 12-month trailing returns predict 3-6 month forward returns. Stocks that went up tend to keep going up; stocks that went down tend to keep falling. The mechanism is likely behavioral: investors underreact to information initially, then overreact later.
Combining them: quality filters remove fundamentally weak companies that momentum might otherwise pick up. Momentum ranks the survivors by recent price performance to find the ones the market is currently rewarding.
The Screens
-- Run it: https://cetaresearch.com/data-explorer?q=FSRZNSSbo7
-- Quality Momentum US Screen
-- Quality: ROE > 15%, debt/equity < 1.0, positive net income, positive operating
-- cash flow, gross margin > 20%, market cap above the US floor.
-- Momentum: 12-month price return skipping the most recent month (T-12M to T-1M).
WITH quality AS (
    SELECT k.symbol, p.companyName, p.sector, p.exchange,
           k.returnOnEquityTTM   * 100 AS roe_pct,
           f.debtToEquityRatioTTM      AS debt_to_equity,
           f.grossProfitMarginTTM * 100 AS gross_margin_pct,
           k.marketCap / 1e9           AS market_cap_billions,
           ROW_NUMBER() OVER (PARTITION BY COALESCE(p.cik, p.companyName)
                              ORDER BY p.averageVolume DESC) AS listing_rank
    FROM key_metrics_ttm k
    JOIN financial_ratios_ttm f ON k.symbol = f.symbol
    JOIN profile p              ON k.symbol = p.symbol
    WHERE p.exchange IN ('NYSE', 'NASDAQ', 'AMEX')
      AND k.marketCap > 300000000
      AND k.returnOnEquityTTM > 0.15
      AND f.debtToEquityRatioTTM >= 0
      AND f.debtToEquityRatioTTM < 1.0
      AND f.grossProfitMarginTTM > 0.20
      AND f.netIncomePerShareTTM > 0          -- positive net income
      AND f.operatingCashFlowPerShareTTM > 0  -- positive operating cash flow
      AND NOT p.isFund AND NOT p.isEtf
      AND p.isActivelyTrading = true
),
price_1m AS (
    SELECT symbol, adjClose AS price_1m,
           ROW_NUMBER() OVER (PARTITION BY symbol
               ORDER BY ABS(CAST(dateEpoch AS BIGINT) -
                   CAST(EXTRACT(EPOCH FROM (CURRENT_DATE - INTERVAL '30' DAY)) AS BIGINT))) AS rn
    FROM stock_eod
    WHERE CAST(date AS DATE) BETWEEN CURRENT_DATE - INTERVAL '45' DAY
                                 AND CURRENT_DATE - INTERVAL '18' DAY
      AND adjClose >= 1.0
),
price_12m AS (
    SELECT symbol, adjClose AS price_12m,
           ROW_NUMBER() OVER (PARTITION BY symbol
               ORDER BY ABS(CAST(dateEpoch AS BIGINT) -
                   CAST(EXTRACT(EPOCH FROM (CURRENT_DATE - INTERVAL '365' DAY)) AS BIGINT))) AS rn
    FROM stock_eod
    WHERE CAST(date AS DATE) BETWEEN CURRENT_DATE - INTERVAL '395' DAY
                                 AND CURRENT_DATE - INTERVAL '335' DAY
      AND adjClose >= 1.0
),
momentum AS (
    SELECT a.symbol,
           ROUND((a.price_1m - b.price_12m) / b.price_12m * 100, 1) AS momentum_12m_pct
    FROM price_1m a
    JOIN price_12m b ON a.symbol = b.symbol
    WHERE a.rn = 1 AND b.rn = 1 AND b.price_12m > 0
)
SELECT q.symbol, q.companyName, q.sector,
       ROUND(q.market_cap_billions, 2) AS market_cap_billions,
       ROUND(q.roe_pct, 1)             AS roe_pct,
       ROUND(q.debt_to_equity, 2)      AS debt_to_equity,
       ROUND(q.gross_margin_pct, 1)    AS gross_margin_pct,
       m.momentum_12m_pct
FROM quality q
JOIN momentum m ON q.symbol = m.symbol
WHERE q.listing_rank = 1
  AND m.momentum_12m_pct > 0
  AND m.momentum_12m_pct <= 200
ORDER BY m.momentum_12m_pct DESC
LIMIT 30
What We Found
25-year summary (2000-2025):
| Metric | Quality Momentum | S&P 500 (SPY) |
|---|---|---|
| CAGR | 8.27% | 7.75% |
| Total Return | 658.3% | 570.3% |
| Sharpe Ratio | 0.277 | 0.382 |
| Max Drawdown | -53.8% | -55.0% |
| Down Capture | 106.7% | 100% |
| Up Capture | 118.5% | 100% |
| Cash Periods | 0 of 51 (0%) | |
| Avg Stocks | 29.5 |
The 0.52% annual alpha is real but modest. The strategy never ran out of qualifying stocks. The US quality universe is deep enough to always find 30 names.
The Sharpe tells a different story than the CAGR. SPY's Sharpe (0.382) beats Quality Momentum (0.277). The strategy captures more upside (118.5% up capture) but also amplifies downside (106.7% down capture). You're taking on more volatility and more crash risk for less than a percentage point of extra return per year.
Year-by-year standouts:
| Year | Quality Momentum | SPY | Notes |
|---|---|---|---|
| 2008 | -48.5% | -34.3% | Momentum crash — worst year |
| 2007 | +32.0% | +5.5% | Pre-crisis momentum surge |
| 2009 | +24.2% | +26.4% | Recovery lagged market |
| 2013 | +42.1% | +32.4% | Strong outperformance |
| 2017 | +31.5% | +21.8% | Quality tech surge |
| 2018 | -16.9% | -4.4% | Momentum reversal |
| 2020 | +53.8% | +15.6% | Best year — pandemic winners |
| 2022 | -28.2% | -18.2% | Rate shock hurt momentum |
The 2008 problem. Quality Momentum lost -48.5% against SPY's -34.3%. This is the momentum crash phenomenon documented by Daniel and Moskowitz (2016). When markets fall fast, the highest-momentum stocks tend to be those held by leveraged investors, who are forced to sell first. Quality screens don't protect against this. The companies that pass ROE>15% and D/E<1.0 are financially healthy. But if their stocks had the most momentum going in, they fall the hardest when deleveraging hits.
The 2020 standout. The strategy returned +53.8% vs SPY's +15.6% in 2020. Quality tech companies with strong margins and clean balance sheets (Microsoft, Apple, Salesforce, and similar names) entered 2020 with strong 12-month momentum. COVID accelerated their business models. The quality + momentum combination landed exactly on the right companies at the right time.
The 2022 problem. Rising rates hurt high-multiple quality names. -28.2% vs -18.2% for SPY. When rate expectations shift abruptly, long-duration growth stocks (often the highest-momentum quality names) reprice sharply downward.
Win rate: The strategy beat SPY in 27 of 51 six-month periods (52.9%). Barely better than a coin flip.
The academic tension. Asness, Frazzini, and Pedersen argued that quality companies have lower earnings risk and should trade at higher multiples, but markets systematically underprice this. Jegadeesh and Titman showed momentum persists for 3-12 months. Together, they should compound. Daniel and Moskowitz (2016) showed the flaw: when these factors are combined and the market turns sharply, the crash can exceed what either factor alone would produce. The US data is consistent with this warning.
Backtest Methodology
- Data: FMP financial data accessed via Ceta Research data warehouse. Price data from
stock_eod(adjusted closes). - Point-in-time: 45-day filing lag applied to all fundamental data. July rebalances use prior fiscal year financials. January rebalances use the most recent annual filing.
- Momentum: 12-month trailing price return, measured from 12 months ago to 1 month ago (skipping the most recent month to avoid short-term reversal noise).
- Market cap threshold: $300M USD minimum for US exchanges.
- Transaction costs: Not modeled. Semi-annual turnover is moderate, roughly 40-60% of positions change each period.
- Equal weight: 30 positions, 3.33% each. No rebalancing within a period.
- Benchmark: SPY ETF total return.
Limitations
Momentum crash risk is real. The 106.7% down capture is the core problem. In bad markets, this strategy can hurt you more than just holding SPY. The 2008 and 2022 results demonstrate this concretely.
52.9% win rate against SPY is marginal. Over 25 years it compounds to meaningful outperformance in absolute terms, but the edge is narrow. A single unlucky period could eliminate the excess return.
No transaction costs. Actual returns will be lower. Semi-annual turnover at 30 positions means roughly 15-20 trades per rebalance. For retail investors, this is manageable. For larger portfolios, market impact matters.
Survivorship bias is partially controlled via point-in-time fundamentals, but FMP's historical coverage of delisted companies may be incomplete for early periods.
The US quality universe is large. Finding 30 names is never a problem, which means this strategy never goes to cash. That's good for deployment but means there's no natural defensive posture built in.
Takeaway
Quality momentum on US stocks delivers real alpha: 8.27% vs 7.75% SPY over 25 years. But the Sharpe ratio is worse than just holding SPY (0.277 vs 0.382), the down capture is above 100%, and the win rate is barely above 50%. The strategy captures bull markets well (118.5% up capture) but amplifies bear markets.
The stronger case for quality momentum is outside the US. India, South Africa, and Sweden all show more attractive risk-adjusted profiles. The US result is positive but not compelling on its own.
Part of a Series
This is part of a multi-exchange quality momentum study:
- Quality Momentum: Global 17-Exchange Comparison — published March 28
- Quality Momentum: India 19% CAGR — published April 3
- Quality Momentum: Sweden 9.76% CAGR — published April 5
- Quality Momentum: South Africa 11.36% CAGR — published April 7
References
- Asness, C., Frazzini, A., & Pedersen, L. (2019). Quality Minus Junk. Review of Accounting Studies.
- Jegadeesh, N., & Titman, S. (1993). Returns to Buying Winners and Selling Losers. Journal of Finance.
- Daniel, K., & Moskowitz, T. (2016). Momentum Crashes. Journal of Financial Economics.
Run This Screen Yourself
The current quality momentum screen for US stocks is live on Ceta Research:
cetaresearch.com/data-explorer?q=FSRZNSSbo7
The screen runs on live FMP data. Results update as new annual filings come in.
Past performance does not guarantee future results. This is educational content, not investment advice.

