
Quality Momentum on South African Stocks: Filtering Out Commodities

South Africa's stock exchange (JNB) is dominated by mining, energy, and commodity companies. Anglo American, BHP, Glencore, Sasol. These are large, liquid companies that define the JSE. They're also structurally leveraged: mining operations require heavy capex, and debt-to-equity ratios above 1.0 are common.
Contents
- Method
- What is Quality Momentum?
- The Screens
- What We Found
- The Structural Story
- Backtest Methodology
- Limitations
- Takeaway
- Part of a Series
- References
- Run This Screen Yourself
The quality filter (D/E < 1.0, GrossMargin > 20%) removes most of them. What remains is a concentrated portfolio of South Africa's consumer brands, financial services companies, healthcare providers, and retailers. These businesses look nothing like the JSE's headline composition. That difference explains the results.
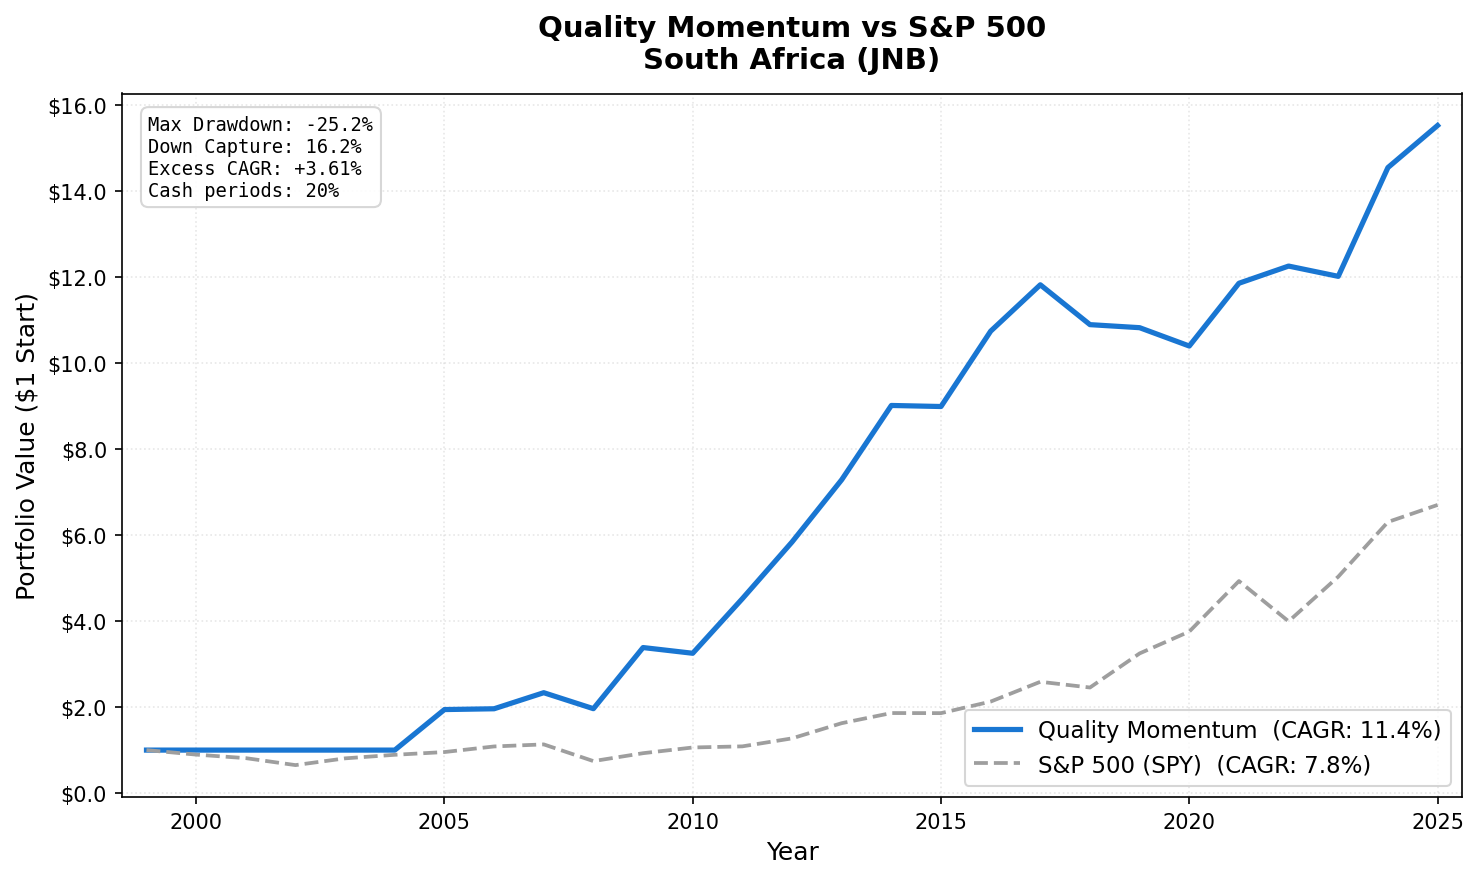
11.36% CAGR from 2005 to 2025. 3.61% annual alpha. 16.2% down capture.
Part of a Series: Global | US | Sweden | India
Method
| Parameter | Value |
|---|---|
| Universe | JSE (Johannesburg Stock Exchange, JNB) |
| Rebalancing | Semi-annual (January, July) |
| Holding period | 6 months |
| Max positions | 30 stocks, equal weight |
| Cash rule | Fewer than 10 qualifying stocks |
| Data source | FMP via Ceta Research warehouse |
| Benchmark | S&P 500 (SPY) |
| Period | 2005-2025 |
| Filing lag | 45 days (point-in-time) |
What is Quality Momentum?
Quality filters screen for: ROE > 15%, D/E < 1.0, positive net income, positive operating cash flow, gross margin > 20%, and a minimum market cap. Companies passing all criteria form the quality universe.
Momentum ranks them by 12-month trailing price return. The top 30 by momentum form the portfolio.
The academic basis: Asness, Frazzini, and Pedersen (2019) showed quality companies are persistently underpriced relative to their risk. Jegadeesh and Titman (1993) showed 12-month momentum predicts forward returns. For South Africa specifically, the quality filter does double duty: it screens for financial health and, as a side effect, screens out the volatile commodity sector.
The Screens
-- Quality Momentum South Africa Screen
-- Run at: cetaresearch.com/data-explorer?q=5KMoaZrDzd

WITH quality_stocks AS (
  SELECT
    p.symbol,
    p.companyName,
    p.sector,
    p.marketCap,
    fr.returnOnEquity,
    fr.debtToEquity,
    ic.netIncome,
    cf.operatingCashFlow,
    fr.grossProfitMargin
  FROM profile p
  JOIN financial_ratios fr ON p.symbol = fr.symbol
    AND fr.fiscalYear = YEAR(CURRENT_DATE) - 1
  JOIN income_statement ic ON p.symbol = ic.symbol
    AND ic.fiscalYear = YEAR(CURRENT_DATE) - 1
  JOIN cash_flow_statement cf ON p.symbol = cf.symbol
    AND cf.fiscalYear = YEAR(CURRENT_DATE) - 1
  WHERE p.exchange = 'JNB'
    AND p.marketCap > 500000000  -- ZAR threshold (~$30M USD)
    AND fr.returnOnEquity > 0.15
    AND fr.debtToEquity < 1.0
    AND ic.netIncome > 0
    AND cf.operatingCashFlow > 0
    AND fr.grossProfitMargin > 0.20
    AND p.isActivelyTrading = true
),
momentum AS (
  SELECT
    q.symbol,
    q.companyName,
    q.sector,
    q.marketCap,
    q.returnOnEquity,
    (e2.adjClose - e1.adjClose) / e1.adjClose AS momentum_12m
  FROM quality_stocks q
  JOIN stock_eod e1 ON q.symbol = e1.symbol
    AND e1.date = (
      SELECT MAX(date) FROM stock_eod
      WHERE symbol = q.symbol
        AND date <= CURRENT_DATE - INTERVAL '365 days'
    )
  JOIN stock_eod e2 ON q.symbol = e2.symbol
    AND e2.date = (
      SELECT MAX(date) FROM stock_eod
      WHERE symbol = q.symbol
        AND date <= CURRENT_DATE - INTERVAL '30 days'
    )
)
SELECT
  symbol,
  companyName,
  sector,
  ROUND(marketCap / 1e9, 2) AS marketCap_B,
  ROUND(returnOnEquity * 100, 1) AS roe_pct,
  ROUND(momentum_12m * 100, 1) AS momentum_12m_pct
FROM momentum
ORDER BY momentum_12m DESC
LIMIT 30;
What We Found
Full period summary (2005-2025):
| Metric | Quality Momentum | S&P 500 (SPY) |
|---|---|---|
| CAGR | 11.36% | 7.75% |
| Sharpe Ratio | 0.088 | 0.382 |
| Max Drawdown | -25.2% | -55.0% |
| Down Capture | 16.2% | 100% |
| Up Capture | 108.4% | 100% |
| Cash Periods | 10 of 51 (19%) | |
| Avg Stocks | 21.3 |
On the Sharpe ratio: 0.088 looks terrible compared to SPY's 0.382. It's misleading. South Africa's local risk-free rate ran around 9% through most of this period. Sharpe is calculated against that 9% baseline. The excess CAGR of 3.61% above SPY is the correct metric here. On a risk-adjusted basis relative to local rates, the strategy is competitive.
The 16.2% down capture is the headline number. When global markets fall, this portfolio falls about one-sixth as much. MaxDD of -25.2% vs -53.8% for the US quality momentum portfolio. The quality filter, by removing commodity companies, created a portfolio of businesses with more stable earnings that don't track global risk-off events as closely.
Year-by-year results:
| Year | Quality Momentum | SPY | Notes |
|---|---|---|---|
| 2005 | +94.3% | +4.9% | Thin universe (~5 stocks), statistical noise |
| 2008 | -15.9% | -34.3% | Down capture advantage exactly when it counted |
| 2009 | +72.4% | +26.4% | Strong recovery |
| 2011 | +39.1% | +2.1% | SA consumer and financials outperform |
| 2012 | +29.1% | +16.0% | Continued domestic strength |
| 2019 | -0.7% | +31.5% | Rand weakness, SA macro headwinds |
| 2020 | -3.9% | +15.6% | COVID, SA lockdowns hit domestic spending |
| 2023 | -1.9% | +26.3% | SA macro challenges continued |
The 2005 anomaly. +94.3% in 2005 looks like a data error. It's not, but it's also not meaningful signal. In early years, the quality filter left only 5-6 South African stocks qualifying. With that few names, a concentrated portfolio can swing wildly based on a handful of outcomes. As the universe expanded, results stabilized. The 2005 number should be treated as a thin-universe artifact.
The 2008 result. -15.9% vs SPY -34.3%. This is the down capture working as designed. Global financial crisis hammered commodity and mining stocks, but those were already excluded. SA consumer businesses, grocery retailers, and banks with conservative loan books held up far better than the headline JSE.
Recent softening (2019-2023). The strategy has been near-flat or negative in recent years. Several factors: Rand depreciation reduced returns relative to a USD benchmark; SA has faced persistent loadshedding (power grid failures) constraining consumer spending; political and governance uncertainty weighed on domestic-focused companies. The quality filter can't protect against macro headwinds of that magnitude.
The Structural Story
South Africa's economy has two distinct layers. The first layer: mining and resources (iron ore, platinum, gold, coal, diamonds), major energy companies (Sasol), and mining-linked financial infrastructure. These companies carry high leverage, volatile margins, and strong correlation with global commodity cycles.
The second layer: domestic consumer franchises (Woolworths, Pick n Pay, Shoprite), private banking (FirstRand, Capitec, Standard Bank subsidiaries), healthcare groups, and retailers. These companies have consistent margins, lower leverage, and revenue driven by SA domestic consumption.
The quality filter selects almost entirely from the second layer. The result is a portfolio that looks nothing like the JSE index but performs far better on a risk-adjusted basis, especially in global downturns.
Backtest Methodology
- Data: FMP financial data via Ceta Research warehouse. Price data from
stock_eod(ZAR-denominated, adjusted closes). - Point-in-time: 45-day filing lag applied to all fundamental data.
- Momentum: 12-month trailing price return, measured from 12 months ago to 1 month ago.
- Market cap threshold: ZAR 500M minimum (~$30M USD equivalent).
- Risk-free rate: 9% local South African rate for Sharpe calculation.
- Transaction costs: Not modeled.
- Equal weight: 30 positions target, 19% cash periods when fewer than 10 qualify.
- Benchmark: SPY ETF total return (USD-denominated comparison).
Limitations
Thin universe. Average of 21.3 stocks per period (vs 30 target). 19% cash periods. The quality universe on JNB is smaller than on US or Indian exchanges. Statistical confidence is lower, especially in early periods.
Rand exposure. International investors take currency risk. ZAR has depreciated substantially against USD over the backtest period. These figures compare local-currency returns to a USD-denominated SPY. They show the strategy's return in the local market, not what a USD investor would have received.
SA macro concentration. The quality filter creates a portfolio concentrated in SA domestic consumer and financial names. If SA macro deteriorates (loadshedding, political risk, currency weakness), there's no diversification within the portfolio. The 2019-2023 period shows what that looks like.
2005 early-period artifact. The +94.3% result in 2005 was a 5-stock portfolio. It's statistically meaningless and inflates the long-run CAGR.
Takeaway
South Africa's quality momentum result is compelling for one specific reason: 16.2% down capture with positive long-run alpha. If you're building a global multi-exchange portfolio and want a position that holds value in global downturns, JNB quality momentum has a structural argument. Not because of macro South Africa, but because the quality filter eliminates the exchange's volatile core.
The thin universe and recent macro challenges are real concerns. This is a comparison-only result for most global investors, not a standalone allocation.
Part of a Series
- Quality Momentum: Global 17-Exchange Comparison, published March 28
- Quality Momentum: US Stocks, published April 1
- Quality Momentum: India 19% CAGR, published April 3
- Quality Momentum: Sweden, published April 5
References
- Asness, C., Frazzini, A., & Pedersen, L. (2019). Quality Minus Junk. Review of Accounting Studies.
- Jegadeesh, N., & Titman, S. (1993). Returns to Buying Winners and Selling Losers. Journal of Finance.
Run This Screen Yourself
The current quality momentum screen for South African stocks is live on Ceta Research:


