
Quality Momentum Tested on 17 Global Exchanges: India Dominates

We ran the same quality momentum strategy across 17 global exchanges over 25 years. Same rules everywhere: ROE > 15%, D/E < 1.0, positive net income, positive operating cash flow, gross margin > 20%, then rank by 12-month price momentum. Top 30 stocks, equal weight, semi-annual rebalancing.
Contents
- Full Results: All 17 Exchanges
- The Outperformers: Four Markets That Worked
- The Momentum Crash Pattern
- Markets With High Cash Periods: Comparison Only
- The Geography Pattern
- The China Anomaly
- The Shareable Screen
- Backtest Methodology
- Limitations
- Dedicated Blogs in This Series
- References
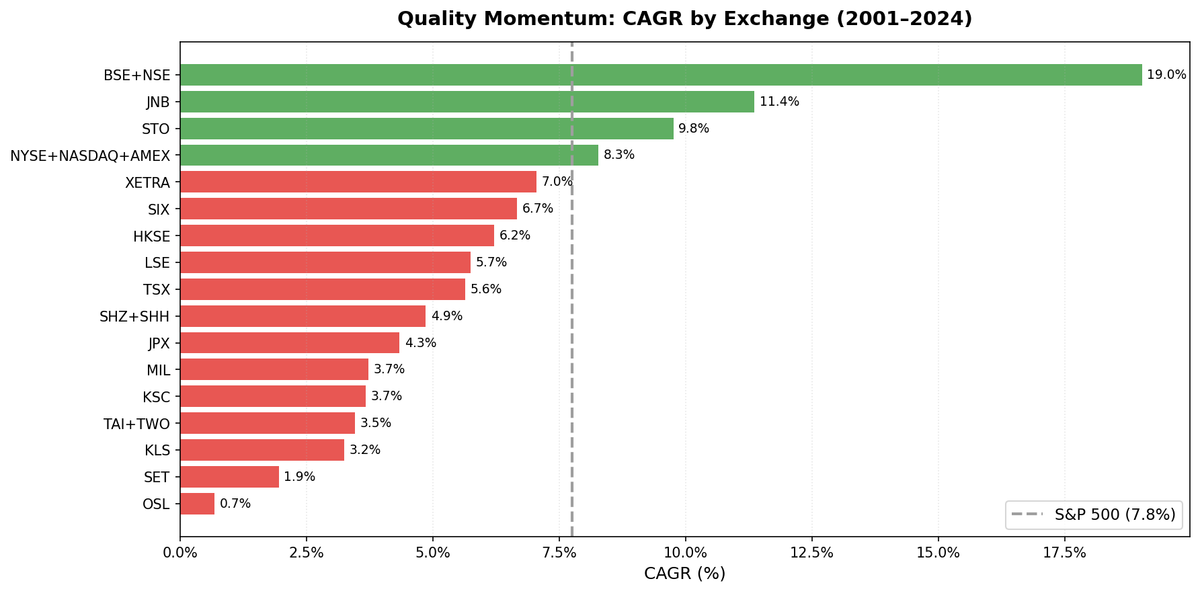
The results split along a clear geographic line. Only 4 of the 17 exchanges beat the S&P 500 benchmark. India leads at 19% CAGR. South Africa produces the best downside protection with 16.2% down capture. Most developed markets underperform.
Full Results: All 17 Exchanges
| Exchange | CAGR | Excess vs SPY | Sharpe | Max DD | Down Capture | Cash% |
|---|---|---|---|---|---|---|
| BSE+NSE (India) | 19.03% | +11.29% | 0.443 | -63.6% | 64.4% | 18% |
| JNB (South Africa) | 11.36% | +3.61% | 0.088* | -25.2% | 16.2% | 20% |
| STO (Sweden) | 9.76% | +2.01% | 0.373 | -50.0% | 101.8% | 18% |
| NYSE+NASDAQ+AMEX (US) | 8.27% | +0.52% | 0.277 | -53.8% | 106.7% | 0% |
| XETRA (Germany) | 7.05% | -0.69% | 0.315 | -42.4% | 100.9% | 4% |
| SIX (Switzerland) | 6.72% | -1.03% | 0.369 | -45.5% | 101.0% | 2% |
| HKSE (Hong Kong) | 6.21% | -1.54% | 0.123 | -58.9% | 106.8% | 6% |
| LSE (UK) | 5.74% | -2.01% | 0.098 | -44.3% | 102.8% | 0% |
| TSX (Canada) | 5.64% | -2.11% | 0.176 | -49.4% | 77.3% | 10% |
| SHZ+SHH (China) | 4.86% | -2.89% | 0.072 | -64.1% | 110.3% | 0% |
| JPX (Japan) | 4.34% | -3.41% | 0.221 | -55.8% | 95.8% | 22% |
| MIL (Italy) | 3.72% | -4.03% | 0.044 | -50.3% | 88.1% | 43% |
| KSC (Korea) | 3.67% | -4.08% | 0.047 | -35.0% | 35.9% | 33% |
| TAI+TWO (Taiwan) | 3.46% | -4.29% | 0.131 | -47.2% | 110.2% | 29% |
| KLS (Malaysia) | 3.24% | -4.50% | 0.098 | -40.1% | 43.8% | 29% |
| SET (Thailand) | 1.95% | -5.80% | -0.032 | -49.0% | 32.3% | 20% |
| OSL (Norway) | 0.68% | -7.06% | -0.186 | -49.3% | 55.6% | 69% |
*JNB Sharpe calculated against 9% local risk-free rate. All others use ~2% USD rate.
S&P 500 (SPY) benchmark: 7.75% CAGR, 0.382 Sharpe, -55.0% MaxDD over the same period.
The Outperformers: Four Markets That Worked
India (BSE_NSE): +11.29% annual alpha. The standout result by a significant margin. 19.03% CAGR over 21 effective years (data sparse before 2004). Three factors drove it: a large and deep quality universe (thousands of listed companies, always enough to fill 30 positions), India's economic growth cycle concentrating momentum in the right sectors, and lower institutional leverage reducing momentum crash risk. Full analysis: Quality Momentum India.
South Africa (JNB): +3.61% alpha, 16.2% down capture. The counter-intuitive result. SA's JSE is dominated by mining and commodity companies, exactly the sectors that fail the D/E and gross margin filters. What remains is a portfolio of consumer franchises, private banks, and healthcare companies that don't track global risk-off events. The result: 11.36% CAGR with the best downside protection of any exchange tested (excepting Norway, which has 69% cash and no statistical meaning). Full analysis: Quality Momentum South Africa.
Sweden (STO): +2.01% alpha. Sweden's cluster of high-quality industrials and technology companies passes quality screens easily. The strategy delivered 9.76% CAGR with strong bull market capture (122.1% up). The limitation: 101.8% down capture means no defensive benefit. Alpha comes entirely from the up side. Full analysis: Quality Momentum Sweden.
US (NYSE_NASDAQ_AMEX): +0.52% alpha. Eight months of 25 years of outperformance producing 0.52% annual alpha. The strategy works, barely. The Sharpe is worse than SPY (0.277 vs 0.382) and the down capture is 106.7% (worse than the market in downturns). Full analysis: Quality Momentum US.
The Momentum Crash Pattern
Daniel and Moskowitz (2016) documented that momentum strategies crash harder than the market during sharp reversals. The mechanism: high-momentum stocks are often held by leveraged systematic funds; when markets fall, forced deleveraging hits these stocks first, amplifying the decline.
The data confirms this pattern clearly:
| Exchange | Down Capture | Pattern |
|---|---|---|
| China (SHZ+SHH) | 110.3% | Crashes harder than market |
| Taiwan (TAI+TWO) | 110.2% | Crashes harder than market |
| Hong Kong (HKSE) | 106.8% | Crashes harder than market |
| US (NYSE+NASDAQ+AMEX) | 106.7% | Crashes harder than market |
| UK (LSE) | 102.8% | Crashes harder than market |
| Sweden (STO) | 101.8% | Near-neutral |
| Switzerland (SIX) | 101.0% | Near-neutral |
| Germany (XETRA) | 100.9% | Near-neutral |
| Japan (JPX) | 95.8% | Near-neutral |
| Italy (MIL) | 88.1% | Modest cushion |
| Canada (TSX) | 77.3% | Moderate cushion |
| Norway (OSL) | 55.6% | (69% cash, low significance) |
| Malaysia (KLS) | 43.8% | Thin universe effect |
| Korea (KSC) | 35.9% | (33% cash, low significance) |
| Thailand (SET) | 32.3% | Thin universe effect |
| India (BSE+NSE) | 64.4% | Protected |
| South Africa (JNB) | 16.2% | Strongly protected |
The worst momentum crash exposure is actually in China, Taiwan, and Hong Kong, not the developed Western markets. Their institutional momentum structures amplify downturns. India and South Africa are the clear exceptions.
Markets With High Cash Periods: Comparison Only
Three exchanges had cash periods too high to write dedicated blogs:
Norway (OSL): 69% cash. The quality filter eliminates most of Norway's economy. Statoil, Equinor, the shipping companies, the offshore services firms: all highly leveraged. What remains is a tiny universe that frequently falls below 10 qualifying stocks. Only 31% of periods had an invested portfolio. 0.69% CAGR. Statistically meaningless.
Italy (MIL): 43% cash. Italian listed companies skew toward banking (highly leveraged by nature) and industrial conglomerates. The quality filter eliminates most of them. Combined with 112.8% down capture when invested, the result is -4.03% annual alpha. Italy doesn't work for this strategy.
Korea (KSC): 33% cash. Korea's chaebols (Samsung, Hyundai, LG, SK) are structurally leveraged. The D/E < 1.0 filter removes most of the largest companies. The remaining universe is thin (33% cash) and still underperforms at -4.08% alpha.
The Geography Pattern
Quality momentum works where two conditions coexist: a large enough quality universe to maintain 30 positions, and a momentum dynamic not dominated by institutional deleveraging.
Emerging markets with deep quality universes (India) perform best. Large universe + growth-cycle momentum + less institutional leverage = the right environment.
Markets where quality = non-cyclical (South Africa) show the best downside protection. The filter does sector selection by accident.
Developed markets with growth-oriented quality (Sweden, US) get positive but modest alpha. The momentum crash risk limits the downside protection quality was supposed to provide.
Developed markets with thin or leveraged universes (Norway, Italy, Korea) fail. The filter kills too many names, creating cash drag and poor statistical significance.
Asia-Pacific markets (Japan, Taiwan, Thailand, Malaysia) uniformly underperform. These markets have different price formation dynamics. Momentum has historically been less persistent in Asian markets, possibly due to higher retail participation and faster mean reversion.
The China Anomaly
China (SHZ+SHH) returned 4.86% CAGR with -2.89% excess. One year deserves specific mention: 2007 saw the Shanghai Composite gain 130% as A-share speculation peaked. The quality momentum portfolio participated with extreme returns that year. This isn't an artifact. It was a genuine speculative bubble. The long-run -2.89% excess shows the strategy didn't capture it systematically; 2007 was an outlier within an otherwise underperforming market.
China's 110.3% down capture is among the worst of any exchange tested. The retail-dominated market structure and margin-trading dynamics amplify downturns for momentum stocks. The long-run results don't support quality momentum as a viable strategy on Chinese exchanges.
The Shareable Screen
Run the current global quality momentum screen:
cetaresearch.com/data-explorer?q=s0vIMevF9u
Part of a Series: US | Sweden | South Africa | India
Backtest Methodology
- Data: FMP financial data accessed via Ceta Research warehouse. Price data from
stock_eod(adjusted closes). - Point-in-time: 45-day filing lag applied to all fundamental data. Each rebalance uses the most recently available annual filing at that date.
- Quality criteria: ROE > 15%, D/E < 1.0, net income > 0, operating cash flow > 0, gross profit margin > 20%, market cap above exchange-specific threshold.
- Momentum signal: 12-month trailing price return, measured from 12 months ago to 1 month ago.
- Rebalancing: Semi-annual (January, July). Top 30 by momentum, equal weight.
- Cash rule: Fewer than 10 qualifying stocks in any period.
- Transaction costs: Not modeled.
- Benchmark: SPY ETF total return. All comparisons are against this USD-denominated benchmark, regardless of local currency.
Limitations
Survivorship bias. FMP's historical coverage may undercount delisted companies, particularly for exchanges with thinner data pipelines (SET, KLS, early India). This could overstate results for some markets.
Transaction costs. Not modeled. Semi-annual turnover is moderate, but in less liquid markets (JNB, SET), actual costs could materially affect results.
Currency effects. All returns are in local currency compared to a USD benchmark. Rand, SEK, and INR movements affect what international investors actually receive.
Academic literature is primarily US-based. The Asness-Frazzini-Pedersen and Jegadeesh-Titman papers document effects in US data. Whether the same mechanisms operate identically in emerging or smaller markets is an open question.
Dedicated Blogs in This Series
- Quality Momentum: US Stocks (8.27% CAGR). April 1
- Quality Momentum: India (19.03% CAGR). April 3
- Quality Momentum: Sweden (9.76% CAGR). April 5
- Quality Momentum: South Africa (11.36% CAGR). April 7
References
- Asness, C., Frazzini, A., & Pedersen, L. (2019). Quality Minus Junk. Review of Accounting Studies.
- Jegadeesh, N., & Titman, S. (1993). Returns to Buying Winners and Selling Losers. Journal of Finance.
- Daniel, K., & Moskowitz, T. (2016). Momentum Crashes. Journal of Financial Economics.


