
P/S Below 1 on 13 Global Exchanges: 6 Beat SPY, 7 Don't — Here's What

We ran the same price-to-sales value screen on 13 exchanges worldwide. Same four filters applied identically to each market: P/S below 1.0, gross margin above 20%, operating margin above 5%, ROE above 10%. Top 30 by lowest P/S, quarterly rebalanced, equal weight. Backtest period 2000-2025. Six markets outperformed the S&P 500. Seven didn't. The gap between winners and losers reveals more about market structure than about the screen itself.
Contents
- Method
- The Screen
- Results
- Full results table
- What Separates the Winners
- The outperformers: why they work
- What the winners share
- What Drives the Underperformers
- The losers: why they don't work
- The Quality Filters: What They Actually Do
- The Cash Period Question
- Excluded Exchanges
- Practical Implications
- Part of a Series
- References
- Run This Screen Yourself
Method
- Data source: Ceta Research (FMP financial data warehouse)
- Universe: 13 exchanges (see table below)
- Period: 2000-2025 (25 years, 100 quarterly periods)
- Rebalancing: Quarterly (January, April, July, October), equal weight, top 30 by lowest P/S
- Benchmark: S&P 500 Total Return (SPY)
- Cash rule: Hold cash if fewer than 10 stocks qualify
Financial data sourced from FY financial statements with a 45-day lag to prevent look-ahead bias. Local currency returns throughout. SPY used as a common benchmark (USD) to measure excess return.
The Screen
The same screen applied to every market:
| Criterion | Metric | Threshold |
|---|---|---|
| Cheap relative to revenue | Price-to-Sales | < 1.0 |
| Business quality | Gross Margin | > 20% |
| Operational efficiency | Operating Margin | > 5% |
| Capital returns | ROE | > 10% |
Size threshold varies by market (e.g., $1B USD for US, JPY 10B for Japan, EUR 300M for Germany) to maintain a consistent institutional-grade universe.
Results

Full results table
| Exchange | CAGR | Excess vs SPY | Sharpe | MaxDD | Cash Periods | Avg Stocks |
|---|---|---|---|---|---|---|
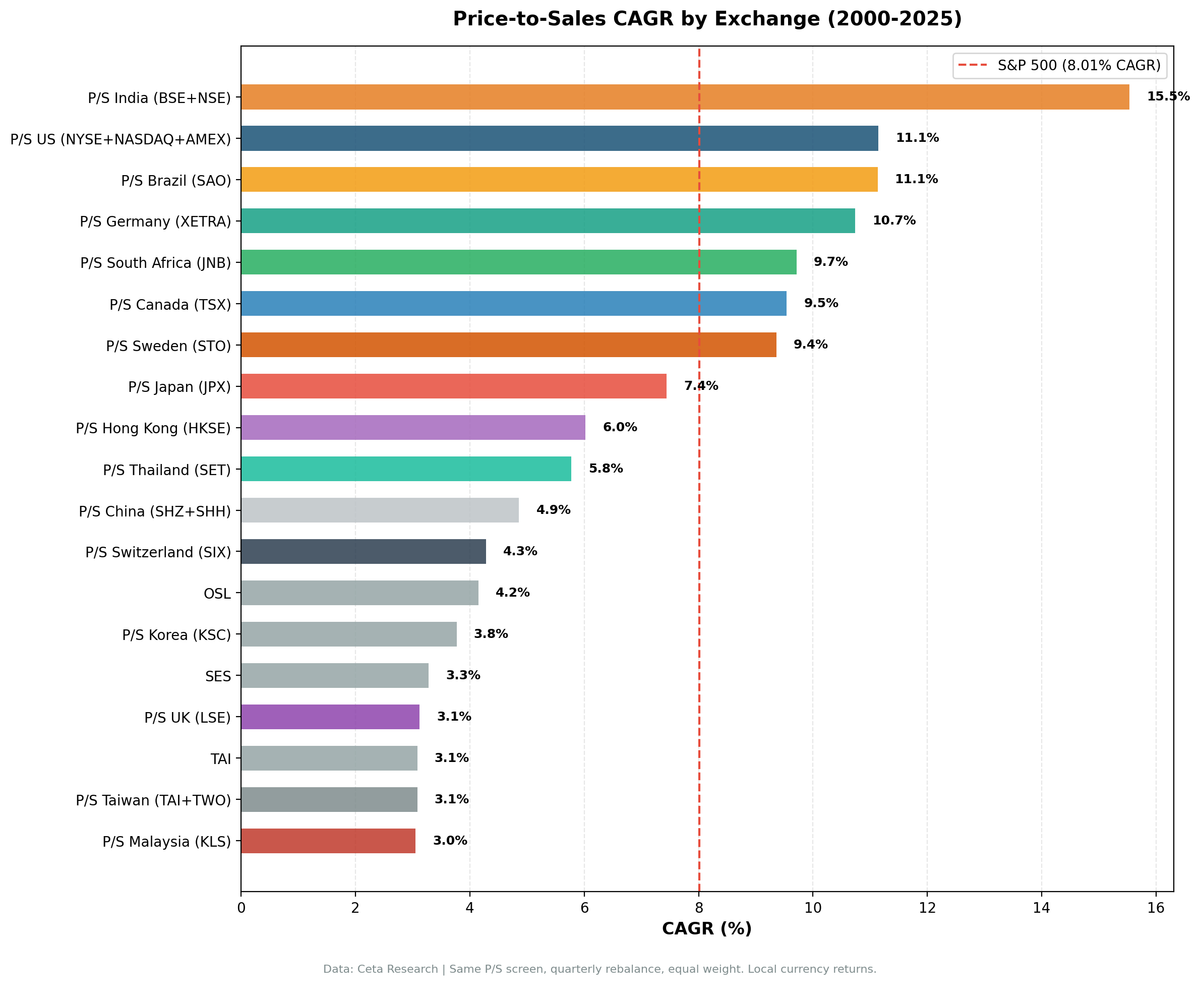
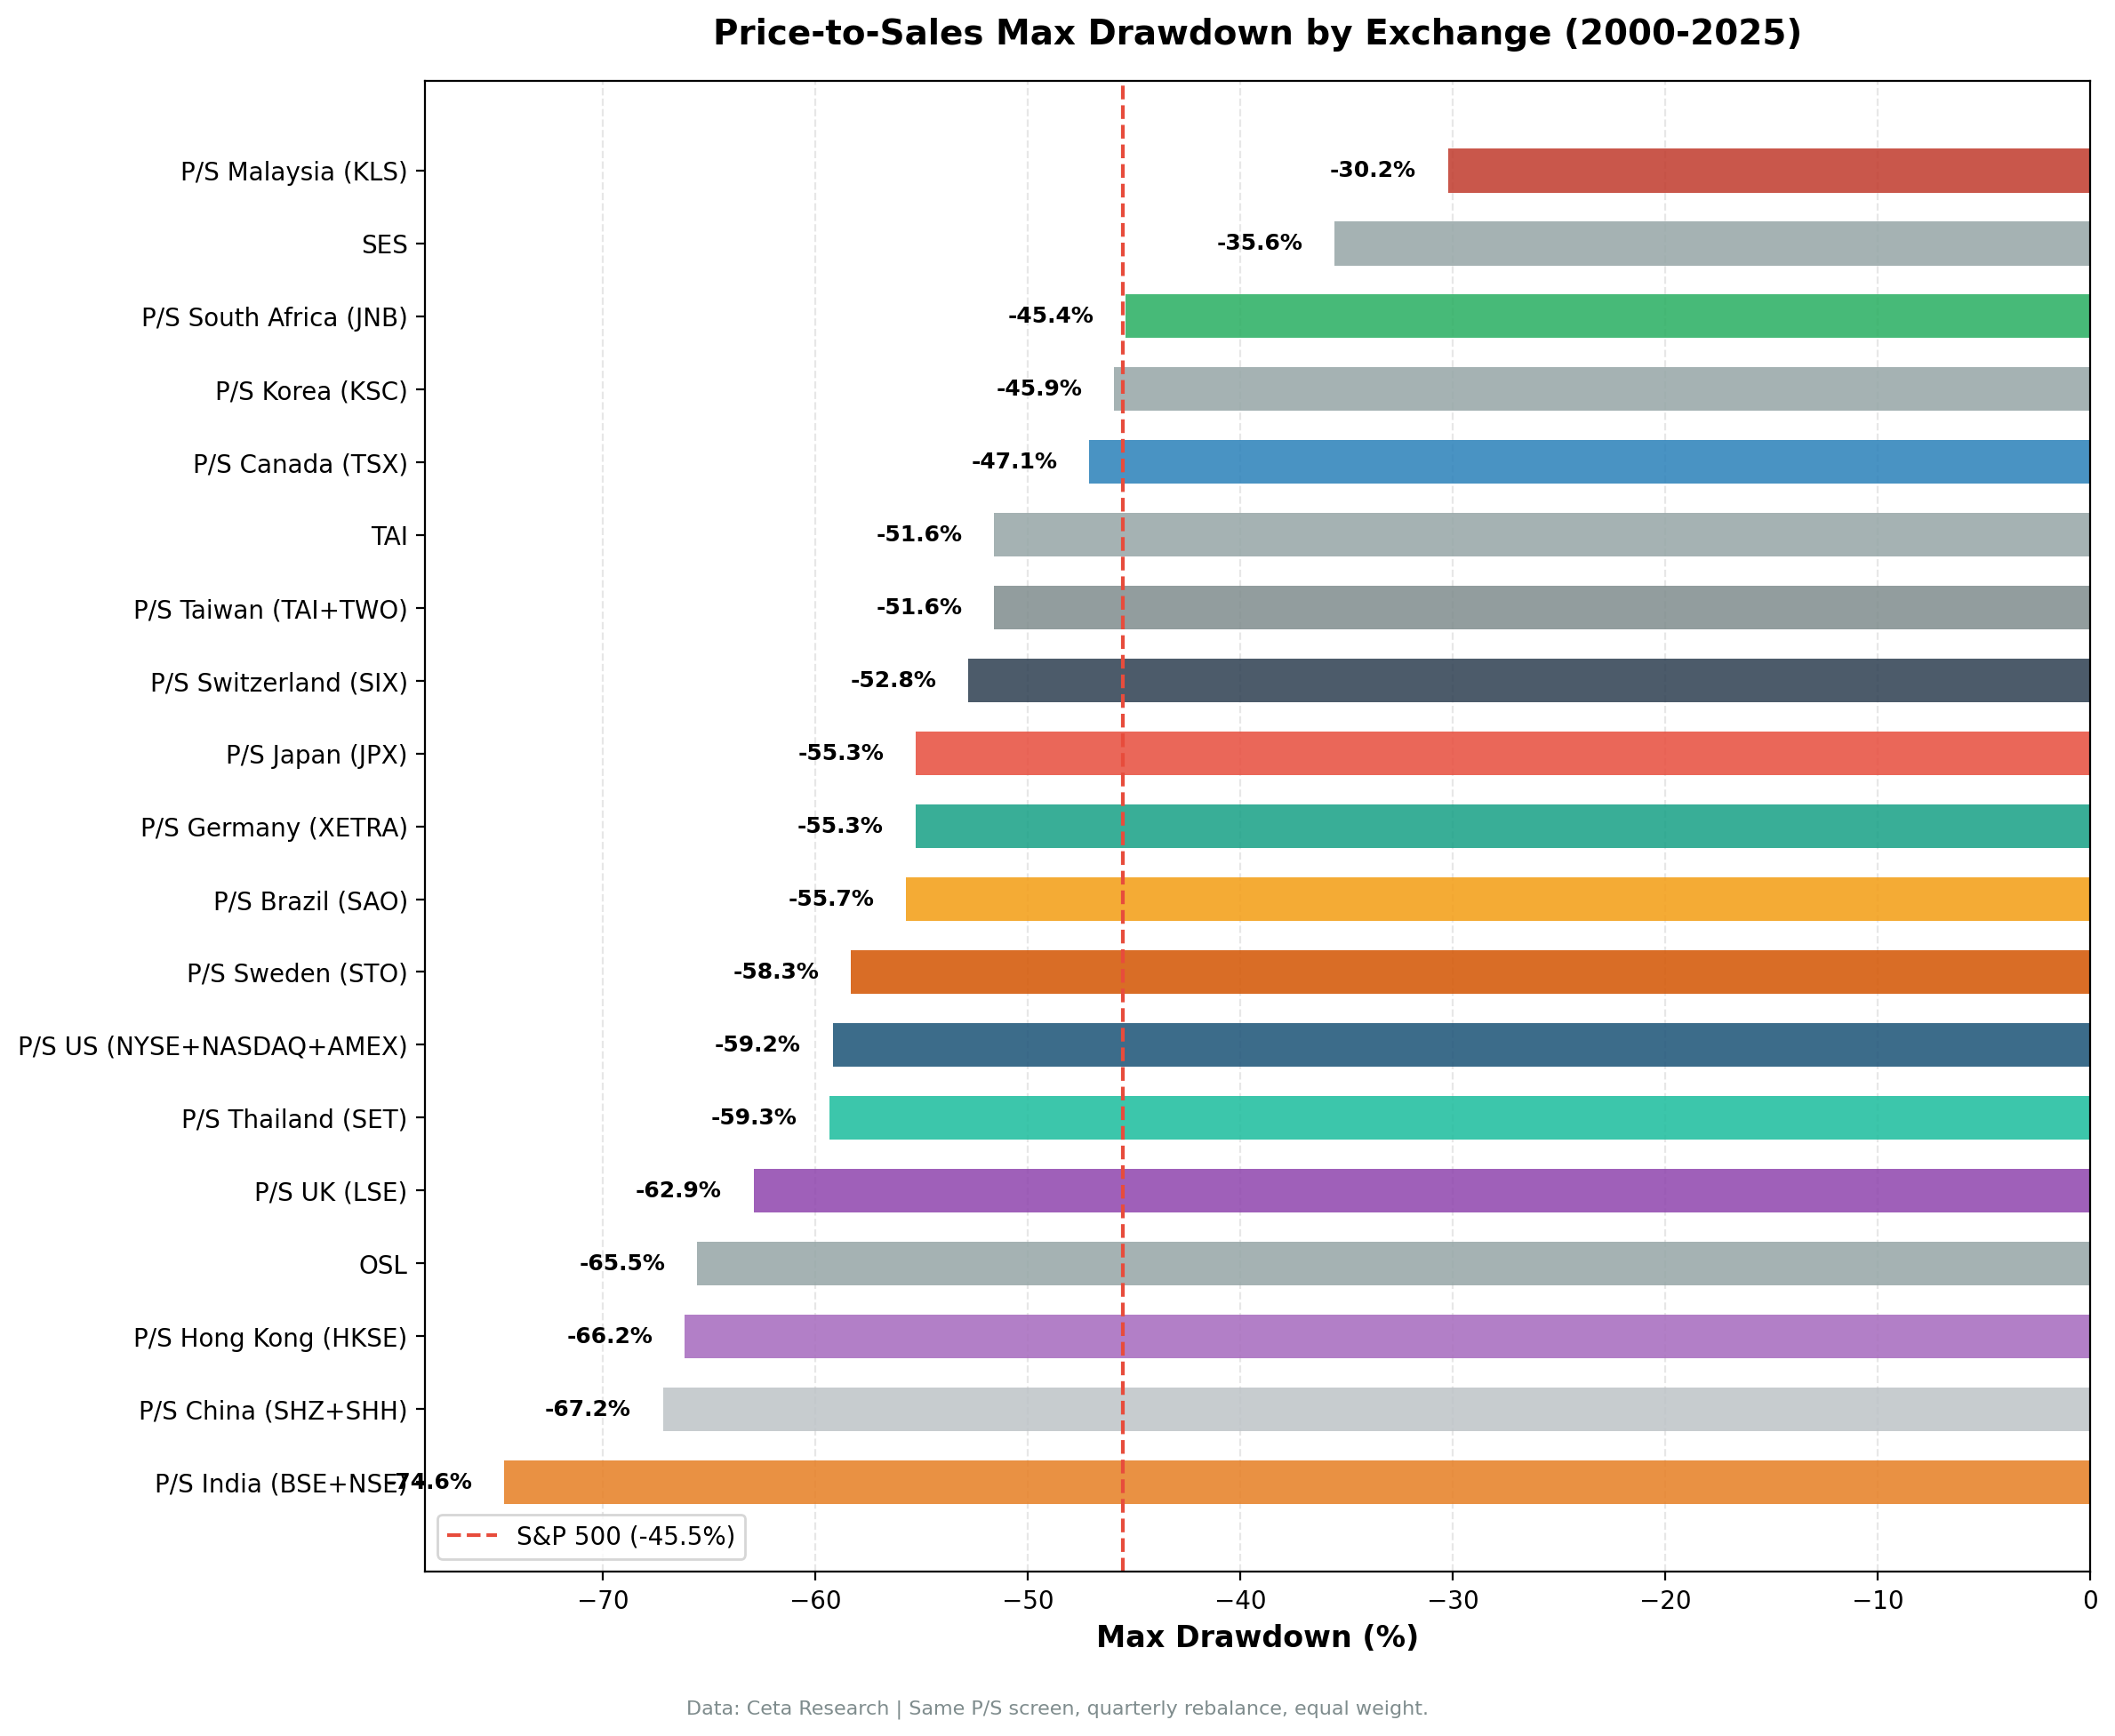
| India (BSE+NSE) | 15.53% | +7.52% | 0.226 | -74.63% | 16 of 100 | 27.5 |
| US (NYSE+NASDAQ+AMEX) | 11.14% | +3.13% | 0.357 | -59.18% | 0 of 100 | 23.8 |
| Germany (XETRA) | 10.74% | +2.73% | 0.408 | -55.29% | 0 of 100 | 20.9 |
| South Africa (JNB) | 9.71% | +1.70% | 0.031* | -45.39% | 24 of 100 | 23.6 |
| Canada (TSX) | 9.54% | +1.53% | 0.351 | -47.11% | 0 of 100 | 26.2 |
| Sweden (STO) | 9.36% | +1.35% | 0.365 | -58.31% | 13 of 100 | 26.0 |
| SPY | 8.01% | — | 0.354 | -45.53% | — | — |
| Japan (JPX) | 7.44% | -0.57% | 0.369 | -55.27% | 14 of 100 | 28.9 |
| Hong Kong (HKSE) | 6.02% | -1.99% | 0.111 | -66.15% | 8 of 100 | 19.7 |
| Thailand (SET) | 5.77% | -2.24% | 0.132 | -59.34% | 20 of 100 | 25.5 |
| China (SHZ+SHH) | 4.86% | -3.15% | 0.066 | -67.17% | 0 of 100 | 24.0 |
| Switzerland (SIX) | 4.28% | -3.73% | 0.201 | -52.80% | 0 of 100 | 16.3 |
| Korea (KSC) | 3.77% | -4.24% | 0.047 | -45.93% | 28 of 100 | 27.8 |
| UK (LSE) | 3.12% | -4.89% | -0.013 | -62.90% | 0 of 100 | 14.4 |
*South Africa's Sharpe is depressed by a local risk-free rate of approximately 9%. The 9.71% CAGR and +1.70% excess return represent genuine outperformance.
What Separates the Winners
The outperformers: why they work
Six markets beat SPY. They don't share a single regional profile, but they share a structural one.
India (15.53% CAGR, +7.52%) is the standout performer and it's not close. India's combination of high economic growth, improving corporate governance, and a large base of mid-cap companies trading below book and sales values created near-ideal conditions for a P/S quality screen. The 26% gross margin and 5% operating margin bars cut out the pure commodity and distribution businesses. What remains are Indian industrials, consumer companies, and financial services firms that grew faster than the screen expected. The drawdown is brutal at -74.63%, but the alpha is consistent enough across the period that it survives.
US (11.14%, +3.13%) works for the obvious reason: the market is deep enough to always find qualifying names (zero cash periods) and the quality filters select profitable industrials, healthcare, and consumer staples names that the P/S screen systematically underweights in favor of during growth cycles. The 2022-2024 value comeback drove exceptional returns in the final three years of the period.
Germany (10.74%, +2.73%) has the best Sharpe ratio of any exchange at 0.408, and it's a function of market structure. Germany's Mittelstand, mid-cap family-controlled industrial and manufacturing companies, aren't growth stories. They're durable, consistently profitable businesses that rarely trade at premium revenue multiples. The P/S screen finds them efficiently. Zero cash periods across 25 years confirm that qualifying names are always available.
Canada (9.54%, +1.53%) and Sweden (9.36%, +1.35%) share similar profiles with Germany. Both have deep mid-cap industrial and energy bases with consistent margins. Both had zero and 13 cash periods respectively, meaning the screen consistently finds qualifying stocks.
South Africa (9.71%, +1.70%) is the anomaly. The Sharpe of 0.031 looks terrible, but that's an artifact of a 9% local risk-free rate depressing the ratio mechanically. The raw CAGR of 9.71% against SPY's 8.01% is genuine outperformance. South Africa's market has a core of well-run industrial and financial companies trading at low sales multiples, and the quality filters work there. The high cash rate (24 of 100 quarters) reflects periods where qualifying stocks dropped below 10.
What the winners share
The common thread across outperformers is that the P/S filter finds stocks that are structurally undervalued on revenue, not just cyclically depressed. In markets with a strong industrial or consumer mid-cap base, revenue multiples compress because those companies are valued on earnings or dividends rather than growth expectations. The margin and ROE filters confirm that the revenue is actually profitable. That combination, cheap on revenue, quality margins, positive returns on equity, is a signal that works when the market eventually recognizes the mispricing.
What Drives the Underperformers
The losers: why they don't work
Seven markets underperformed SPY by amounts ranging from -0.57% (Japan) to -4.89% (UK).
UK (3.12%, -4.89%) is the worst performer and the result is genuinely surprising given the UK's developed financial markets and disclosure standards. The explanation comes from the sector composition of stocks that pass the screen. The UK's low P/S names cluster in commodities, basic materials, and traditional retail, industries that have faced structural headwinds throughout this period. The average of only 14.4 stocks per period is the lowest of any exchange, which points to a fundamental problem: the quality filters leave very few names when applied to the UK mid-cap universe. Thin diversification combined with structurally challenged sectors produced the only negative Sharpe ratio in the sample.
China (4.86%, -3.15%) illustrates what happens when a market has no shortage of cheap-on-sales stocks but the quality filters catch very different companies than in other markets. China's accounting standards, state-owned enterprise dynamics, and sector composition create a pool of qualifying names that looked statistically similar to the screen but behaved differently. Volatility was high and the strategy never fully recovered from the 2007-2008 peak-to-trough cycle. The Sharpe of 0.066 across 25 years and zero cash periods tells you the screen ran but never built a durable edge.
Korea (3.77%, -4.24%) is similar to China in structure but has an additional issue: the chaebol conglomerate structure means many companies that would otherwise qualify on P/S and margins are subsidiaries of larger groups, with cross-holdings and related-party transactions that distort the financial ratios. The 28 cash periods out of 100 indicate the screen struggled to find consistent qualifying names in Korea's listed universe.
Switzerland (4.28%, -3.73%) has a small problem and a valuation problem. The universe is thin (16.3 avg stocks), and Swiss companies are often priced by global institutional investors who value the stability premium, meaning many names that might otherwise trade at low P/S ratios don't. The quality filters don't help much here because the companies that pass them are precisely the ones that global investors have already bid up.
Hong Kong (6.02%, -1.99%) and Thailand (5.77%, -2.24%) fall in the middle. Both have emerging market characteristics with some developed market stability. Neither produced consistent alpha because the qualifying stock pool is relatively small and correlated with Chinese growth cycles.
Japan (7.44%, -0.57%) is the closest to the benchmark and the most nuanced result. Japan's unique market structure, near-zero rates and the "Japan discount" from conservative capital allocation, creates conditions where the P/S screen finds genuinely undervalued companies, but the macro environment has suppressed returns relative to the US. The Sharpe of 0.369 is above SPY's 0.354, which means Japan's underperformance is entirely explained by return rather than by poor risk management.
The Quality Filters: What They Actually Do
A raw P/S screen without margin and ROE requirements would look very different. Grocery chains, fuel distributors, commodity traders, and capital-intensive businesses with high revenue but thin margins all qualify on P/S alone. Those businesses are often cheap on sales for a structural reason: the revenue doesn't translate into meaningful returns.
The gross margin above 20% filter removes the thin-margin distributors and commodity businesses. The operating margin above 5% confirms that the gross margin isn't being consumed by operating costs. The ROE above 10% ensures the company is actually generating returns on its equity base, not just running at a loss or holding cash unprofitably.
Together, the three quality filters change the character of what qualifies. In Japan, they remove the zombie companies and cash hoarders. In Germany, they confirm the Mittelstand industrial quality. In the UK, they narrow the qualifying pool so aggressively that the resulting portfolio lacks diversification. The filters are doing real work in every market, but they interact differently with each market's structural characteristics.
The Cash Period Question
Markets with frequent cash periods are signaling something. When the screen can't find 10 qualifying stocks, it's because either the market's P/S ratios are elevated (overvalued market), the quality filters are too restrictive for that universe, or there's a data availability issue.
Korea's 28 cash periods and South Africa's 24 suggest the quality filters are aggressive relative to the available universe in those markets. Norway, Malaysia, and Taiwan were excluded from the study entirely because cash periods exceeded 36-40%, making any performance comparison unreliable.
Markets with zero cash periods (US, Germany, Canada, China, Switzerland, UK) have deep enough universes that the screen always finds qualifying names. That depth is itself an indicator of market maturity and breadth.
Excluded Exchanges
Five exchanges were excluded from the results due to data or coverage issues:
| Exchange | Reason |
|---|---|
| Brazil (SAO) | Adjusted close split artifact in underlying data |
| Australia (ASX) | Adjusted close split artifact in underlying data |
| Norway (OSL) | 40% cash periods, insufficient qualifying stocks |
| Taiwan (TAI+TWO) | 36% cash periods, insufficient qualifying stocks |
| Singapore (SES) | Average 7.9 stocks per period, below minimum threshold |
Practical Implications
If you're running a P/S screen globally, these results suggest a few things.
Market structure matters more than geography. The outperformers (US, Germany, Canada, Sweden) aren't in the same region and don't share a currency. What they share is a deep base of industrial and consumer mid-caps with consistent margins that aren't being valued on growth expectations. The screen works where those companies exist.
Quality filters are non-negotiable. The performance gap between a raw P/S screen and a quality-filtered one would likely be larger than what the table shows, because the worst drawdowns tend to come from the thin-margin businesses that the filters exclude.
Drawdown tolerance is the real question. Even the best-performing market (India, +7.52% annual alpha) came with a -74.63% max drawdown. Every market except South Africa and Korea had a worse max drawdown than SPY's -45.53%. Running this screen globally means accepting larger drawdowns in exchange for higher long-run returns. Whether that tradeoff is acceptable depends entirely on investment horizon and tolerance for extended underwater periods.
South Africa's Sharpe needs local interpretation. At 9% local RFR, the Sharpe ratio is mechanically suppressed. Don't use it to compare South Africa against the other markets directly. The CAGR and excess return are the more honest measures there.
Part of a Series
This global comparison covers results from all 13 exchanges: - P/S Value Screen on US Stocks - 11.14% CAGR, +3.13% excess - P/S Value Screen on Indian Stocks - 15.53% CAGR, best raw return - P/S Value Screen on German Stocks - 10.74% CAGR, best Sharpe (0.408) - P/S Value Screen on Canadian Stocks - 9.54% CAGR - P/S Value Screen on Swedish Stocks - 9.36% CAGR - P/S Value Screen on South African Stocks - 9.71% CAGR - P/S Value Screen on Japanese Stocks - 7.44% CAGR, near-miss with strong Sharpe
References
- Fisher, K. (1984). Super Stocks. Dow Jones-Irwin.
- Barbee, W., Mukherji, S. & Raines, G. (1996). "Do Sales-Price and Debt-Equity Explain Stock Returns Better than Book-Market and Firm Size?" Financial Analysts Journal, 52(2), 56-60.
- Gray, W. & Vogel, J. (2012). "Analyzing Valuation Measures: A Performance Horse Race over the Past 40 Years." Journal of Portfolio Management, 39(1), 112-121.
- Novy-Marx, R. (2013). "The Other Side of Value: The Gross Profitability Premium." Journal of Financial Economics, 108(1), 1-28.
Run This Screen Yourself
Via web UI: Run the P/S screen on Ceta Research. Switch the exchange filter to any market in the table.
Via Python:
import requests, time

API_KEY = "your_api_key"  # get one at cetaresearch.com
BASE = "https://tradingstudio.finance/api/v1"

# Change exchange to any market: 'JPX', 'XETRA', 'TSX', 'STO', etc.
EXCHANGE = "JPX"

resp = requests.post(f"{BASE}/data-explorer/execute", headers={
    "X-API-Key": API_KEY, "Content-Type": "application/json"
}, json={
    "query": f"""
        SELECT
            f.symbol,
            p.companyName,
            p.sector,
            ROUND(f.priceToSalesRatioTTM, 3) AS ps_ratio,
            ROUND(f.grossProfitMarginTTM * 100, 1) AS gross_margin_pct,
            ROUND(f.operatingProfitMarginTTM * 100, 1) AS op_margin_pct,
            ROUND(k.returnOnEquityTTM * 100, 1) AS roe_pct,
            ROUND(k.marketCap / 1e9, 2) AS mktcap_b
        FROM financial_ratios_ttm f
        JOIN key_metrics_ttm k ON f.symbol = k.symbol
        JOIN profile p ON f.symbol = p.symbol
        WHERE f.priceToSalesRatioTTM > 0
          AND f.priceToSalesRatioTTM < 1
          AND f.grossProfitMarginTTM > 0.20
          AND f.operatingProfitMarginTTM > 0.05
          AND k.returnOnEquityTTM > 0.10
          AND p.exchange IN ('{EXCHANGE}')
        QUALIFY ROW_NUMBER() OVER (
            PARTITION BY f.symbol ORDER BY f.priceToSalesRatioTTM ASC
        ) = 1
        ORDER BY f.priceToSalesRatioTTM ASC
        LIMIT 30
    """,
    "options": {"format": "json", "limit": 30}
})
task_id = resp.json()["taskId"]

while True:
    result = requests.get(f"{BASE}/tasks/data-query/{task_id}",
                          headers={"X-API-Key": API_KEY}).json()
    if result["status"] in ("completed", "failed"):
        break
    time.sleep(2)

for r in result["result"]["rows"]:
    print(f"{r['symbol']:10s} P/S={r['ps_ratio']:.3f}  GM={r['gross_margin_pct']:.1f}%  ROE={r['roe_pct']:.1f}%")
Get your API key at cetaresearch.com. The full backtest code (Python + DuckDB) is on GitHub.
Part of a Series: US | Sweden | Southafrica Stocks | Japan | India | Germany | Canada
Data: Ceta Research, FMP financial data warehouse. Same P/S screen applied to each exchange. Local currency returns. Quarterly rebalance, equal weight, 2000-2025.


