
Pre-Earnings Runup: 13 Markets, Local Benchmarks, Honest Results
Pre-earnings drift across 13 markets with local currency benchmarks. Korea leads at +0.745% vs KOSPI. Japan's effect disappeared vs Nikkei. Taiwan flipped from negative to positive. Corrected August 2026: UK and Germany rows retracted, India withdrawn as untested.

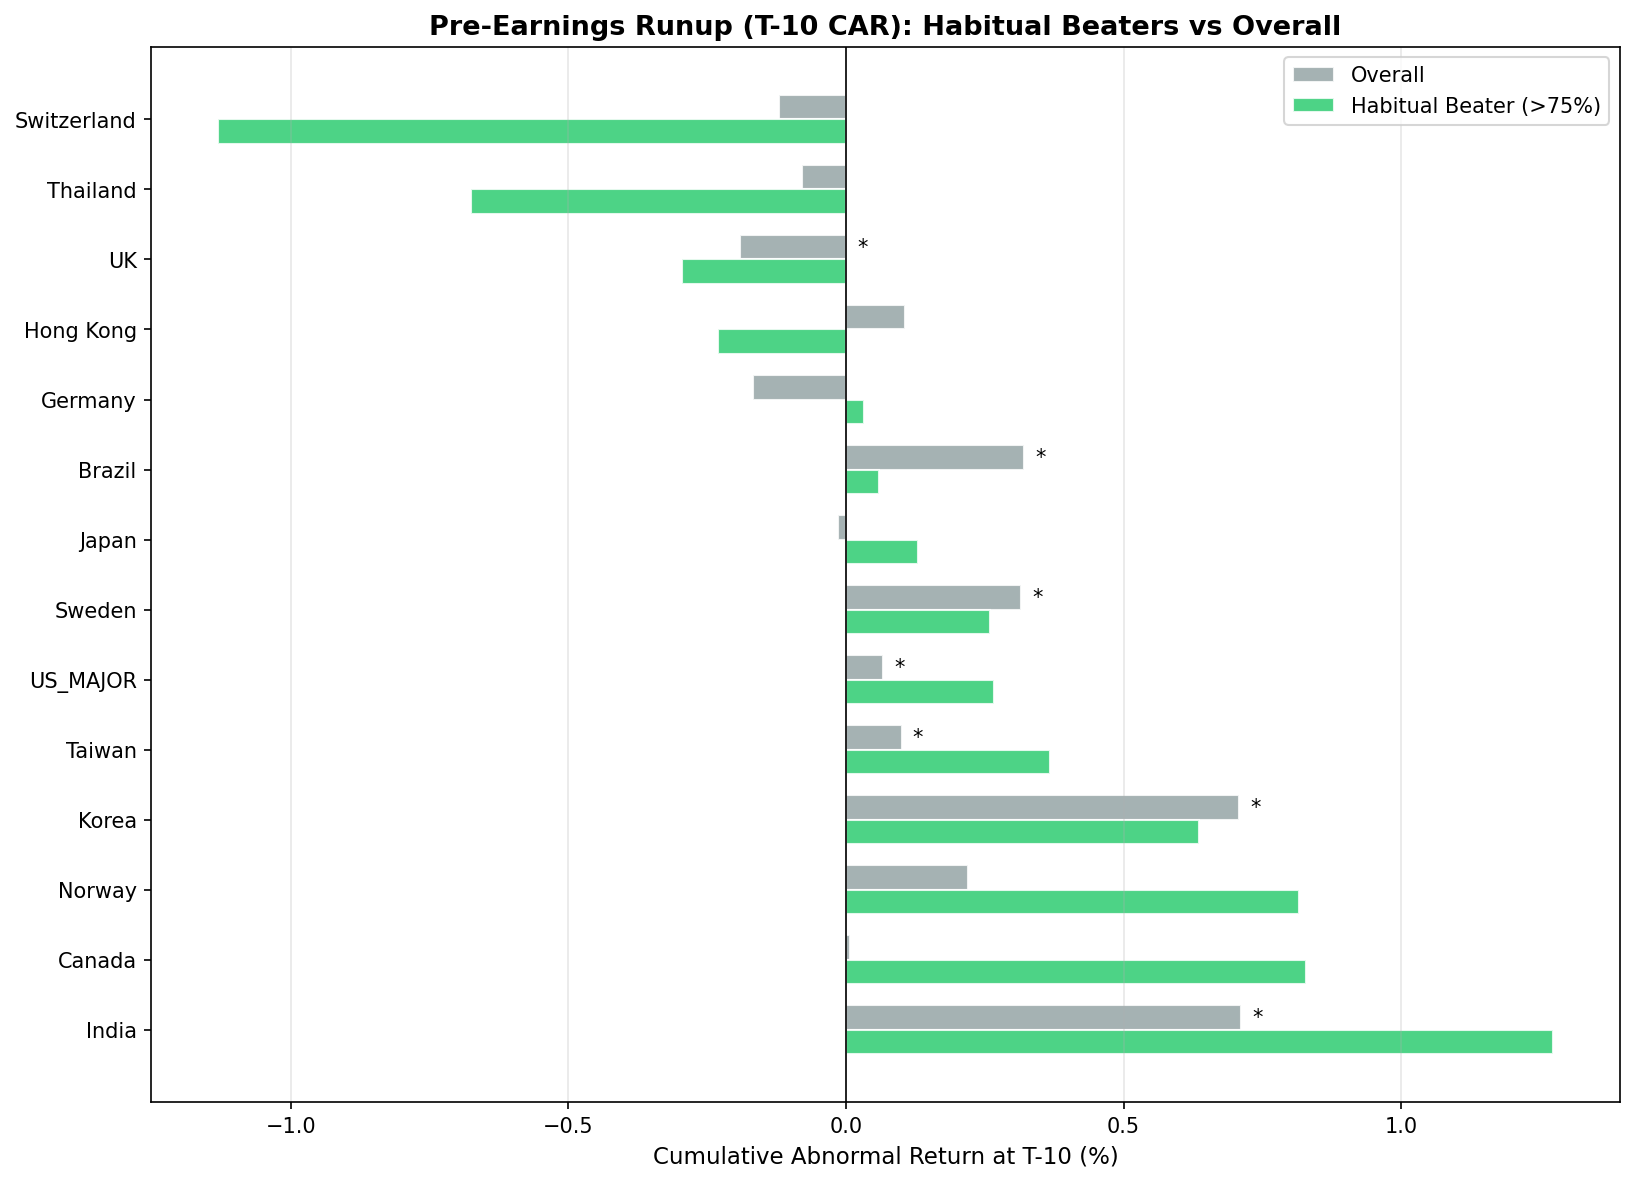
We ran the pre-earnings event study on 13 exchanges using local currency index benchmarks. The results changed significantly from our original analysis, which used US-listed ETFs. Several findings that looked real turned out to be benchmark artifacts.
Contents
- Correction (2026-08-29)
- Method
- Global Results
- What Changed From the Original Analysis
- Where the Effect Is Strongest
- Markets With No Effect
- Markets With Negative Effects
- Data Quality Notes
- What Drives Cross-Country Variation
- Limitations
- Takeaway
- References
Korea leads at +0.745% T-10 CAR. The US shows a modest but robust +0.121%. Japan's effect disappeared entirely. Taiwan flipped from negative to marginally positive. Thailand's extreme negative result compressed to near zero. India prints +0.693%, but a later audit found that number isn't separable from a benchmark mismatch, and the UK and Germany rows are retracted outright.
The lesson: benchmark choice matters more than most event studies acknowledge, and so does checking which companies an exchange filter actually selects.
Data: FMP financial data warehouse, 2000–2025. Updated March 2026. Corrected August 2026, see the correction note below.
Correction (2026-08-29)
An internal audit of this study found a universe defect that invalidates two rows of the table below and pulls the interpretation of a third.
Filtering on an exchange selects listings, not companies. We built each market's universe by filtering on the exchange a stock trades on. That isn't the same as filtering on where the company is. A US company with a London depositary line is a London listing, and it landed in our "UK" universe.
The London Stock Exchange universe is 65.4% US-domiciled at the event level: 6,043 of 9,236 events. Most of those are USD-quoted International Order Book lines, the 0xxx.L symbols, which are foreign companies trading in London and priced in dollars. We benchmarked every one of them against the FTSE 100, a GBP index. Only 14.8% of the LSE events belong to GB-domiciled companies.
Restrict the LSE sample to GB-domiciled companies and recompute on the same event files, and the T-10 CAR is -0.078% with a t-stat of -0.43 across 1,366 events. That's nowhere near significant. The claim that the UK is the only market with significant negative pre-earnings drift is withdrawn. The significance in the published -0.181% was carried by non-UK stocks measured against a UK index.
Germany has the same defect, less severely. The XETRA universe is 45.6% US-domiciled and only 31.9% German, benchmarked against the DAX. German-domiciled events on their own give -0.382%, t=-1.87, n=1,282. The Germany row is withdrawn as a statement about German stocks. It was insignificant before and after, so no conclusion flips, but the row doesn't measure what its label says.
India is untested rather than confirmed. We benchmarked an all-cap NSE universe against the Sensex, which is 30 mega-caps on the other Indian exchange. A size and venue mismatch that large can produce steady positive abnormal return with no earnings content in it at all, and the shape of the Indian drift fits that reading. Per trading day it runs 0.069% across the T-10 window, 0.059% across T-5, and 0.028% on T-1, so it decays into the announcement instead of building, and T-1 isn't significant (t=0.76). Korea does the opposite. 93.7% of the Indian events, 5,288 of 5,641, fall in 2023-2025. The sentence "these are real effects, not benchmark artifacts" was wrong about India, and it's gone.
The retracted rows are marked in the tables below. We haven't re-run the study on domicile-filtered universes, so there's no replacement number for the UK or Germany.
The domicile defect doesn't change any other row's conclusion. Korea, Japan and Thailand are 100% domestic at the event level, India 99.6%, Taiwan 97.4%, Sweden 97.2%, Norway 96.5%, Canada 95.4% and Hong Kong 93.1% (counting China-domiciled H-shares as local, which is the standard convention for that market). The US universe is 79.4% domestic, which is the normal structure of the market that hosts most of the world's primary listings; restricted to US-domiciled companies the US result holds at +0.115%, t=5.90. Switzerland is the only other universe the audit flagged, at 68.3% Swiss-domiciled, and restricting it to Swiss companies leaves the result insignificant either way.
Method
Same event study design applied to each exchange independently:
- Signal: Cumulative abnormal return (CAR) in the 10, 5, and 1 trading days before a scheduled earnings announcement
- Universe: Exchange-specific market cap thresholds (adjusted per market)
- Benchmark: Local currency index per exchange (Nikkei 225 for Japan, KOSPI for Korea, Sensex for India, etc.)
- Abnormal return: Stock return minus local benchmark return over the same window
- Windows: T-10, T-5, T-1 trading days before announcement date
- Winsorization: 1st/99th percentile
- Significance: Two-sided t-test; ** = p<0.01, * = p<0.05
Key change from original analysis: All non-US exchanges now use local currency indices instead of US-listed ETFs. This ensures the trading calendar, currency, and market exposure match the stocks being studied. See the "What Changed" section for details.
Global Results
| Exchange | Benchmark | Events | T-10 CAR | t-stat | Data History |
|---|---|---|---|---|---|
| Korea (KSC) | KOSPI | 6,348 | +0.745% | 9.20** | 2016-2025 |
| India (NSE) ‡ | Sensex | 5,641 | +0.693% | 8.81** | 2023-2025* |
| Sweden (STO) | OMX Stockholm 30 | 4,562 | +0.366% | 3.15** | 2017-2025 |
| Norway (OSL) | Oslo All Share | 1,547 | +0.289% | 1.69 | 2015-2025 |
| Hong Kong (HKSE) | Hang Seng | 3,124 | +0.170% | 1.42 | 2021-2025* |
| US (NYSE/NASDAQ/AMEX) | S&P 500 | 155,684 | +0.121% | 6.85** | 2000-2025 |
| Taiwan (TAI/TWO) | TAIEX | 14,523 | +0.096% | 1.88 | 2015-2025 |
| Canada (TSX) | TSX Composite | 18,694 | +0.079% | 1.63 | 2000-2025 |
| Japan (JPX) | Nikkei 225 | 15,167 | -0.007% | -0.19 | 2017-2025 |
| Thailand (SET) | SET Index | 3,443 | -0.133% | -1.52 | 2015-2025 |
| Germany (XETRA) † | DAX | 4,016 | -0.154% | -1.45 | 2022-2025* |
| UK (LSE) † | FTSE 100 | 9,236 | -0.181% | -2.43* | 2021-2025* |
| Switzerland (SIX) | SMI | 1,186 | -0.245% | -1.40 | 2010-2025 |
*Sparse early data coverage.
† Retracted. These two universes are majority non-domestic (LSE 65.4% US-domiciled, XETRA 45.6%) and were scored against national indices. The numbers are what the run produced. They don't describe UK or German companies. See the correction note above.
‡ Interpretation withdrawn. The India number stands as computed, but an all-cap NSE universe against the 30 mega-cap Sensex can't be read as a pre-earnings effect. See the correction note above.
8 of 13 exchanges show positive T-10 CAR. Four clear p<0.01 as computed: Korea, India, Sweden and the US, with the India figure now flagged as a probable benchmark mismatch. Set the retracted UK row aside and no market in this table shows significant negative drift. On GB-domiciled companies only, the UK figure is -0.078%, t=-0.43.
What Changed From the Original Analysis
The biggest methodological improvement: switching every non-US exchange from US-listed ETFs to local currency index benchmarks.
| Exchange | Old Benchmark | Old T-10 | New Benchmark | New T-10 | Change |
|---|---|---|---|---|---|
| Korea | EWY | +0.844% | KOSPI | +0.745% | -0.10pp |
| India ‡ | INDA | +0.829% | Sensex | +0.693% | -0.14pp |
| Japan | EWJ | +0.114%** | Nikkei 225 | -0.007% | Lost significance |
| Taiwan | SPY | -0.309%** | TAIEX | +0.096% | Sign flipped |
| Thailand | SPY | -0.821%** | SET Index | -0.133% | Lost significance |
| UK † | EWU | -0.149%* | FTSE 100 | -0.181%* | Slightly worse |
† Retracted. Swapping EWU for the FTSE 100 fixed the calendar and currency of the benchmark but not the universe, which is 65.4% US-domiciled. Both columns of this row measure mostly non-UK stocks.
‡ Interpretation withdrawn. The benchmark swap moved India's number, but the Sensex is not a fair comparator for an all-cap NSE universe.
Japan is the most important change. What looked like a modest but real pre-earnings drift (+0.114%, t=2.77) was largely an artifact of benchmarking against EWJ. Against the Nikkei 225, the effect is zero.
Taiwan and Thailand are equally revealing. Both showed strongly negative drift against SPY. Against their local indices, Taiwan is marginally positive and Thailand is near zero. The "negative pre-earnings effect" in these markets was mostly a reflection of their currencies and markets underperforming the US dollar and S&P 500 during the study period.
Where the Effect Is Strongest
Korea (+0.745%, t=9.20) shows large, significant pre-earnings drift against its local benchmark, and it has the shape an event effect should have. The drift per trading day accelerates from 0.075% across the T-10 window to 0.126% across T-5 and 0.270% on T-1, then goes slightly negative at T+1 (-0.059%, not significant). That's return concentrating as the announcement approaches, which is hard to produce with a benchmark mismatch. India (+0.693%, t=8.81) has the same headline size and none of that shape.
Korea's result rests on 6,348 events over 10 years, on a universe that is 100% Korean-domiciled. The effect is structurally different from the US: in Korea, beat rate doesn't predict the drift. Missers, mixed stocks, and beaters all drift by similar amounts. See the Korea analysis for details.
One caveat we can't close from this run: there's no placebo control on non-earnings windows, so part of the Korean level could still be a universe-versus-KOSPI tilt sitting underneath the event effect. The event-time shape survives that objection. The exact size doesn't.
India's number isn't something we can interpret yet. The NSE universe is all-cap and the Sensex is 30 mega-caps on a different Indian exchange, so a size and venue mismatch sits inside every abnormal return we computed. 93.7% of the events, 5,288 of 5,641, land in 2023-2025, a stretch in which Indian small and mid caps ran hard against the Sensex. The per-day drift decays into the announcement rather than building, and T-1 isn't significant (t=0.76). We previously read India's habitual-miss cohort drifting up (+0.451% at T-10, t=1.72) as a structural echo of Korea. A universe-wide tilt showing up in every cohort at once produces the same picture, and we can't tell the two apart from this run. Until India is re-run against a broad Indian benchmark, treat the +0.693% as unexplained rather than as a finding.
Sweden (+0.366%, t=3.15) shows a meaningful, significant effect across ~8 years of dense coverage.
Markets With No Effect
Japan (-0.007%, t=-0.19) shows no pre-earnings drift against its local benchmark. Canada (+0.079%, t=1.63) is similarly weak, just outside conventional significance. These are efficiently priced markets where the pre-earnings premium either doesn't exist or has been arbitraged away.
Japan is notable because the original analysis showed a statistically significant result. The benchmark change exposed this as an artifact. Conservative Japanese guidance culture and cross-shareholding structures may suppress the pre-earnings positioning that drives the effect in other markets.
Markets With Negative Effects
The UK and Germany rows are retracted. Neither universe is mostly domestic, and both were scored against a national index, so neither measures the market its label names. On GB-domiciled companies only, the UK T-10 CAR is -0.078%, t=-0.43. On German-domiciled companies only, XETRA is -0.382%, t=-1.87. Neither is significant.
Switzerland (-0.245%, t=-1.40) and Thailand (-0.133%, t=-1.52) show negative results that don't reach significance. The Swiss universe is 68.3% Swiss-domiciled, closer to a clean read than the UK or German ones, and restricting it to Swiss companies leaves the result insignificant either way.
Thailand went from the most dramatically negative result in our original analysis (-0.821% vs SPY) to near zero against the SET Index. The extreme negative finding was almost entirely a SPY benchmark artifact.
Data Quality Notes
The exchanges fall into three reliability tiers:
Full history (20+ years): US, Canada. These results span multiple full market cycles. Most reliable.
Solid history (8-15 years): Korea, Japan, Norway, Switzerland, Sweden, Taiwan, Thailand. Reasonably reliable.
Sparse early data (3-4 effective years): India (NSE), UK (LSE), Germany (XETRA), Hong Kong (HKSE). Results from these four should be treated as preliminary. The UK and Germany rows carry a second and larger problem than short history: their universes are majority non-domestic, and both are retracted. India's problem is the benchmark, not the history alone.
What Drives Cross-Country Variation
Korea clears +0.745% while Japan and Canada sit near zero. Several structural factors are candidates for the difference. None of them is tested here, and none of them can be invoked for the retracted UK and Germany rows or for India's unresolved number:
Analyst coverage density. Fewer analysts per listed company means less pre-announcement information diffusion. Markets with thinner coverage tend to show stronger drift.
Options market development. Where single-stock options markets are deep and active, delta-hedging creates mechanical buying pressure that either amplifies or efficiently prices in the effect. Less developed options markets may leave more room for the drift.
Institutional trading behavior. Systematic earnings-season positioning is more developed in the US, Canada, and Japan. More capital targeting the pattern compresses the available premium.
Retail participation. Korea has high retail trading volume relative to institutional flow. Calendar-driven retail positioning may create the broad, undifferentiated drift observed there.
Limitations
Universe construction. Every universe here is built by filtering on listing exchange, not on company domicile. For most markets the two are nearly the same thing: Korea, Japan and Thailand are 100% domestic at the event level, India 99.6%, Taiwan 97.4%, Sweden 97.2%, Norway 96.5%, Canada 95.4%, Hong Kong 93.1% (China-domiciled H-shares counted as local), the US 79.4%. Switzerland is looser at 68.3% domestic, though restricting it to Swiss companies doesn't change that row's insignificant result. For the LSE (14.8% domestic) and XETRA (31.9%) they are not, which is what forced the retraction above.
No placebo control. We never measured abnormal return over matched non-earnings windows. Without that control we can't separate the size of a market's pre-earnings drift from a standing tilt between its universe and its benchmark index. This is the reason India's number is unresolved rather than dismissed, and the reason Korea's level is less certain than Korea's shape.
Benchmark size mismatch. Several benchmarks are narrow mega-cap indices measured against much broader universes. The Sensex against an all-cap NSE universe is the worst case in the table.
Variable data windows. Comparing Korea (2016-2025) to the US (2000-2025) conflates market-structure effects with sample-period effects.
No portfolio-level costs. CAR numbers don't include transaction costs, spreads, or market impact.
Index benchmark limitations. Local indices are market-cap-weighted and may not perfectly represent the stock universe being studied. A broader benchmark (TOPIX for Japan, S&P/TSX Composite for Canada) or equal-weighted index could produce slightly different results.
Takeaway
Pre-earnings drift is not universal. With local benchmarks it's clearly significant in Korea, the US and Sweden, unresolved in India, and absent in five markets (Japan, Canada, Hong Kong, Norway, Taiwan). Switzerland and Thailand are directionally negative and insignificant. The UK and Germany rows are retracted.
Two lessons came out of this, one from the benchmark work and one from the audit that followed it. Use local currency indices for cross-market event studies: US-listed ETFs introduced systematic biases that inflated results in some markets (Japan) and distorted them in others (Taiwan, Thailand). And check what an exchange filter selects before you attach a country label to it. A London listing is not a British company, and in our LSE sample it usually wasn't one.
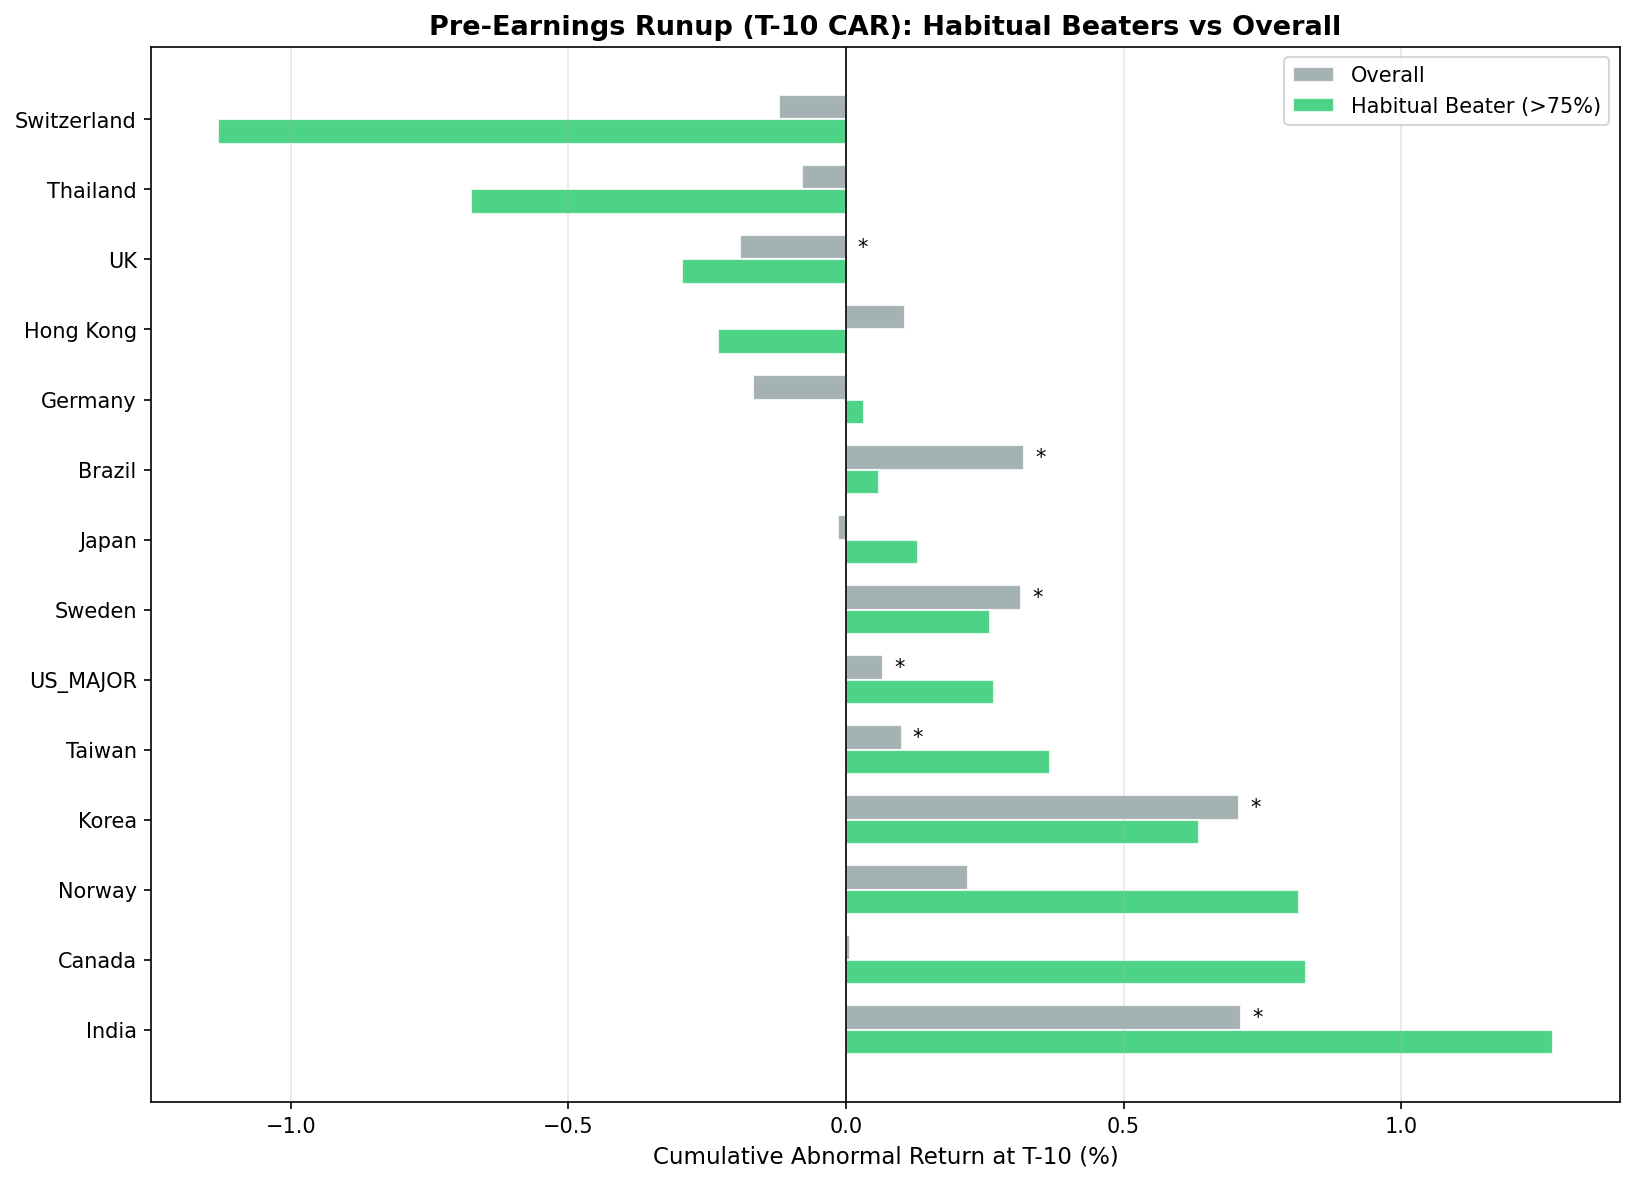
This chart predates the correction. The UK and Germany bars are the retracted rows and the India bar is the unresolved one.
Data: Ceta Research (FMP financial data). Event study: earnings_surprises + stock_eod + key_metrics tables. Exchange-specific market cap thresholds and local currency index benchmarks. Winsorized at 1%/99%. India, UK, Germany, Hong Kong data coverage sparse before 2021-2023. UK and Germany rows retracted 2026-08-29 for universe contamination; India interpretation withdrawn the same day. This is educational content, not investment advice.
References
- Barber, B., De George, E., Lehavy, R. & Trueman, B. (2013). "The Earnings Announcement Premium Around the Globe." Journal of Financial Economics, 108(1), 118-138.
- So, E. & Wang, S. (2014). "News-Driven Return Reversals: Liquidity Provision Ahead of Earnings Announcements." Journal of Financial Economics, 114(1), 20-35.

