
Post-Earnings Drift in China: Everything Drifts Up on A-Shares
20,059 earnings events across Shenzhen and Shanghai (2000-2025). Beats drift +1.75% vs SSE Composite at T+63 (t=+8.04). Misses drift +0.70% (t=+4.42, also significant). Both legs up, so the level is a coverage premium and the Q5-Q1 spread of +2.14pp is the earnings signal.

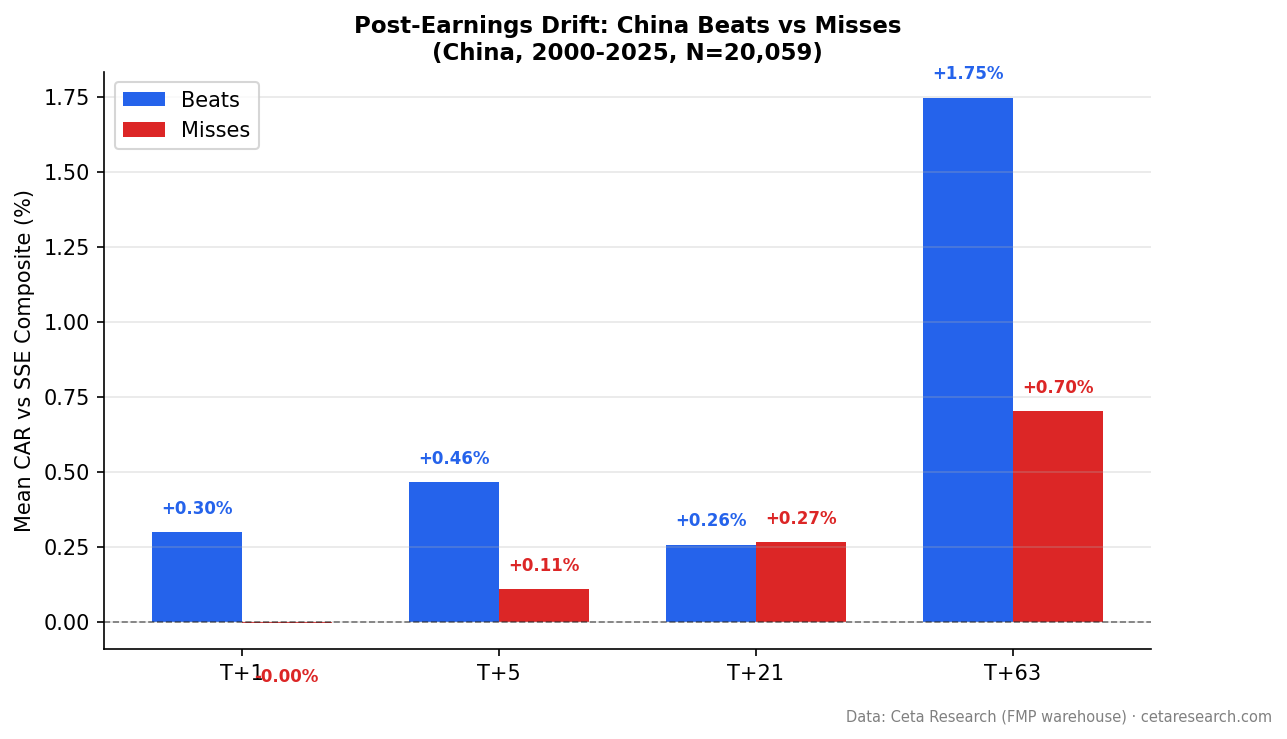
China's PEAD pattern is unusual. Both beats and misses drift positive against the SSE Composite. The entire market of earnings-covered stocks outperforms the index, with beats outperforming more.
Contents
- The Strategy
- What We Found
- Why Everything Drifts Up
- China vs the Global Pattern
- Limitations
- Takeaway
- References
We ran 20,059 earnings events across Shenzhen (SHZ) and Shanghai (SHH) exchanges from 2000 to 2025 using next-day close (MOC) entry and the SSE Composite as benchmark. Beats drifted +1.75% over 63 trading days (t=+8.04). Misses drifted +0.70% (t=+4.42). Both are statistically significant.
The beat-vs-miss gradient still works: beats outperform misses by about 1 percentage point at T+63. But the old story of "misses don't move" was an artifact of using FXI as benchmark. With a local index, misses drift positive too.
Data: FMP financial data warehouse, 2000–2025. Backtest run 2026-05-05. Corrected 2026-08-29.
Correction, 2026-08-29. Both legs drifting up is not a curiosity of the Chinese market. It means the +1.75% and the +0.70% are not measurements of the earnings surprise. When beats and misses both move the same way and both are significant, the level they share belongs to the whole earnings-covered universe measured against the index, not to the surprise. This post already raised that possibility as a coverage premium; we are now stating it as the reading rather than as a question. What is attributable to the surprise is the roughly 1 percentage point gap between the legs and the +2.14pp Q5-Q1 spread. No backtest number has been changed.
The Strategy
Post-Earnings Announcement Drift (PEAD) is an event study. We measure cumulative abnormal returns in the days and weeks after an earnings surprise, not a portfolio.
The signal: Surprise = (epsActual - epsEstimated) / |epsEstimated|
Parameters:
- Universe: SHZ + SHH (Shenzhen + Shanghai), market cap > ¥2B RMB (historical FY)
- Period: 2000-2025 (20,059 events: 6,946 beats, 13,113 misses)
- Benchmark: SSE Composite (000001.SS)
- Execution: Next-day close (market-on-close)
- Surprise cap: |surprise| <= 200%
- Winsorized means: 1st/99th percentile
- Event windows: T+1, T+5, T+21, T+63 trading days
Data: Ceta Research (FMP financial data warehouse), earnings_surprises table.
Screen for current earnings surprises on Chinese A-shares:
SELECT es.symbol,
    CAST(es.date AS DATE) AS event_date,
    es.epsActual AS actual_eps,
    es.epsEstimated AS est_eps,
    ROUND((es.epsActual - es.epsEstimated)
        / ABS(NULLIF(es.epsEstimated, 0)) * 100, 1) AS surprise_pct
FROM earnings_surprises es
JOIN profile p ON es.symbol = p.symbol
WHERE CAST(es.date AS DATE) >= CURRENT_DATE - INTERVAL '30' DAY
  AND es.epsEstimated IS NOT NULL
  AND ABS(es.epsEstimated) > 0.01
  AND es.epsActual > es.epsEstimated
  AND p.exchange IN ('SHZ', 'SHH')
ORDER BY surprise_pct DESC
LIMIT 30
What We Found
Both sides drift positive. Beats drift more.
| Category | T+63 | t-stat | Significant? |
|---|---|---|---|
| Beats (6,946 events) | +1.75% | +8.04 | Yes |
| Misses (13,113 events) | +0.70% | +4.42 | Yes |
Beats drift upward and keep drifting. The +1.75% abnormal return at T+63 is highly significant (t=+8.04).
Misses also drift positive. The +0.70% at T+63 is significant (t=+4.42). This is a major change from our earlier FXI-benchmarked analysis, which showed misses flat at -0.04%. The difference is entirely benchmark-driven: FXI (a USD-traded ETF) was a poor proxy for A-share returns. Against the SSE Composite, stocks with analyst coverage outperform the broad index regardless of whether they beat or miss.
That last clause is the reason we don't claim the +1.75% as an earnings effect. If missing estimates moves a stock up too, the upward push isn't coming from the surprise. It's coming from something both groups share. Two candidates, and they stack: analyst coverage is a quality filter, so the covered subset outruns a broad index either way (the section below works through this), and the SSE Composite is a price index while our stock returns are dividend-adjusted, which biases both legs up by construction. Subtract one leg from the other and the shared part cancels. That leaves the roughly 1 percentage point beat-minus-miss gap and the quintile spread as the parts that trace to the surprise. We have no significance test on the gap itself, which would need a rerun, so treat it as descriptive.
One more thing to notice: 65.4% of the 20,059 events are misses. Chinese companies beat analyst estimates less than 35% of the time. That's the inverse of the US market, where beat rates have climbed to ~65%. Despite being the majority of events, misses still drift positive. This suggests that having analyst coverage itself is a positive selection filter in the A-share market.
The quintile breakdown confirms the gradient.
| Quintile | CAR at T+63 |
|---|---|
| Q1 (worst misses) | +0.37% |
| Q2 | +0.38% |
| Q3 | +1.10% |
| Q4 | +0.95% |
| Q5 (biggest beats) | +2.51% |
The Q5-Q1 spread is +2.14 percentage points. Every quintile is positive. Even Q1 (worst misses) drifts +0.37% vs the SSE Composite. The surprise gradient still works: Q5 at +2.51% is the clear winner, and Q1 is the weakest. But "weakest" here means slightly positive, not negative.
The middle quintiles are noisy (Q3 slightly above Q4), but the extremes tell the story: bigger beats produce more drift, and even the worst misses don't underperform the index.
Why Everything Drifts Up
The pattern where all quintiles drift positive against the SSE Composite reflects structural features of China's A-share market.
Analyst coverage as a quality filter. The SSE Composite includes thousands of stocks, many with no analyst coverage at all. The subset of companies that have earnings estimates is inherently higher quality: larger, more liquid, more institutionally held. When you benchmark this subset against the full index, positive drift is expected. The +0.70% miss drift isn't PEAD. It's a coverage premium, and the same premium sits inside the +1.75% beat number.
A price index against dividend-adjusted stocks. The SSE Composite (000001.SS) is a price index. Our stock returns use dividend-adjusted closes, which include reinvested dividends. Comparing the two adds a positive abnormal return to every A-share event in the study whatever it reported. This is mechanical, it applies to both legs, and it cancels out of the quintile spread.
Retail-dominated trading. A-share investors are predominantly retail. Institutional penetration, while growing, remains lower than in developed markets. Retail-heavy markets tend to be optimism-biased: investors buy aggressively on positive surprises but react inconsistently to bad news. This helps explain why beats drift more than misses, even though both sides are positive.
State-owned enterprise earnings management. A significant portion of Chinese listed companies are partially or majority state-owned. SOEs have strong incentives to manage reported earnings, often smoothing results over time. Analyst estimates for SOEs carry unusual uncertainty, making the "miss" label less meaningful.
Short-sale constraints. A-share shorting is severely restricted. Securities lending is limited, margin rules are tight, and many stocks have no borrowable shares at all. In developed markets, miss drift is partly sustained by short sellers building positions after a negative surprise. In China, that mechanism barely exists. This contributes to the absence of negative drift even for the worst misses.
China vs the Global Pattern
| Market | Beats T+63 | Misses T+63 | Pattern |
|---|---|---|---|
| India | +2.93% | -0.05% (not sig.) | Legs separate: beat side only |
| China † | +1.75% | +0.70% | Both legs up: coverage premium |
| Canada | +1.28% | -0.08% (not sig.) | Legs separate: beat side only |
| US † | -0.32% | -0.91% | Both legs down |
| Japan † | -0.30% | -0.83% | Both legs down |
† Beats and misses move the same way and both legs are significant, so the per-leg level in these markets is not attributable to the earnings surprise. Read the gap between the legs. Full detail in the global comparison post.
China is unusual because both legs drift positive rather than both drifting negative. Hong Kong is the only other market in our global study with the same shape. The explanation is that analyst-covered A-shares systematically outperform the SSE Composite, and the beat/miss gradient sits on top of that base effect.
For practical purposes, the Q5-Q1 spread of +2.14pp still means beats outperform misses. But you can't capture the miss side as a short signal. Everything drifts up.
Limitations
Benchmark and coverage premium. We use the SSE Composite (000001.SS) as benchmark, which is a better local match than FXI or MCHI. The positive drift across all quintiles is a coverage premium, not PEAD: analyst-covered stocks outperform the broad index whether they beat or miss. The Q5-Q1 gradient is the earnings-specific part. The baseline drift underneath it is not, and neither per-leg number should be read as an earnings result.
Price index vs dividend-adjusted returns. The SSE Composite is a price index and our stock returns are dividend-adjusted. That mismatch adds a mechanical positive bias to both legs. We have not measured its size for this study, so we can't say how much of the +0.70% it accounts for.
Universe construction. The universe is selected on the listing venue in the profile table with a ¥2B market cap floor, no domicile filter, and deduplication only by symbol and event date. For SHZ and SHH that is close to a pure A-share universe, but the same code path is what forced the UK and Germany rows out of our global comparison post.
Exchange coverage gaps. The dataset covers SHZ and SHH (Shenzhen and Shanghai main boards) but not ChiNext, STAR Market, or B-shares separately. Smaller growth companies on ChiNext may have different PEAD dynamics.
Shorting constraints in analysis. Even though misses drift positive, the relative underperformance of misses vs beats isn't capturable as a short signal. Executing short strategies on A-shares remains operationally difficult for most investors.
Estimate quality. Chinese analyst consensus estimates vary in quality and coverage. The high miss rate (65.4%) likely reflects systematic over-estimation rather than a pattern of company underperformance.
Transaction costs. Gross abnormal returns. A-share bid-ask spreads and stamp duty (0.1% on sells) reduce practical capture.
Takeaway
China's PEAD pattern is positive across the board. Beats drift +1.75% (t=+8.04) and misses drift +0.70% (t=+4.42) at T+63 vs the SSE Composite. Because both legs are positive and both are significant, neither number is a measurement of the earnings surprise. The Q5-Q1 spread of +2.14pp is, and it shows the surprise gradient still works.
The practical signal is beat selection: Q5 at +2.51% outperforms Q1 at +0.37%. If you're building a long-only screen for Chinese A-shares, earnings beats rank ahead of non-beats. But the absence of any negative drift means the "avoid misses" leg of a traditional PEAD strategy has no value here.
The base effect is a coverage premium, not PEAD. Analyst-covered stocks outperform the SSE Composite as a group, helped by a price-index benchmark measured against dividend-adjusted stock returns. The surprise gradient sits on top of that. Whether the beat-vs-miss gap of roughly 1pp at T+63 justifies the trading costs is the practical question, and note that we have no significance test on that gap.
Data: Ceta Research (FMP financial data warehouse). 20,059 events, SHZ+SHH (Shenzhen+Shanghai), 2000-2025. Abnormal returns computed vs SSE Composite (000001.SS) benchmark. Next-day close (MOC) entry. 1st/99th percentile winsorization. Surprise cap 200%. Single-period return cap 200%. Past performance does not guarantee future results. Educational content only, not investment advice.
References
- Ball, R. & Brown, P. (1968). "An Empirical Evaluation of Accounting Income Numbers." Journal of Accounting Research, 6(2), 159-178.
- Bernard, V. & Thomas, J. (1989). "Post-Earnings-Announcement Drift: Delayed Price Response or Risk Premium?" Journal of Accounting Research, 27(Supplement), 1-36.
- Bernard, V. & Thomas, J. (1990). "Evidence that Stock Prices Do Not Fully Reflect the Implications of Current Earnings for Future Earnings." Journal of Accounting and Economics, 13(4), 305-340.

