
P/E Mean Reversion in Sweden: 6.68% CAGR, 3.72% Alpha vs the OMX Stockholm 30
A sector-relative P/E mean reversion screen on 25 years of Nasdaq Stockholm data returned 6.68% annually vs 2.95% for the OMX Stockholm 30, with 42% down-capture and a shallower drawdown than the index. The catch: it holds cash in 10 of 25 years.

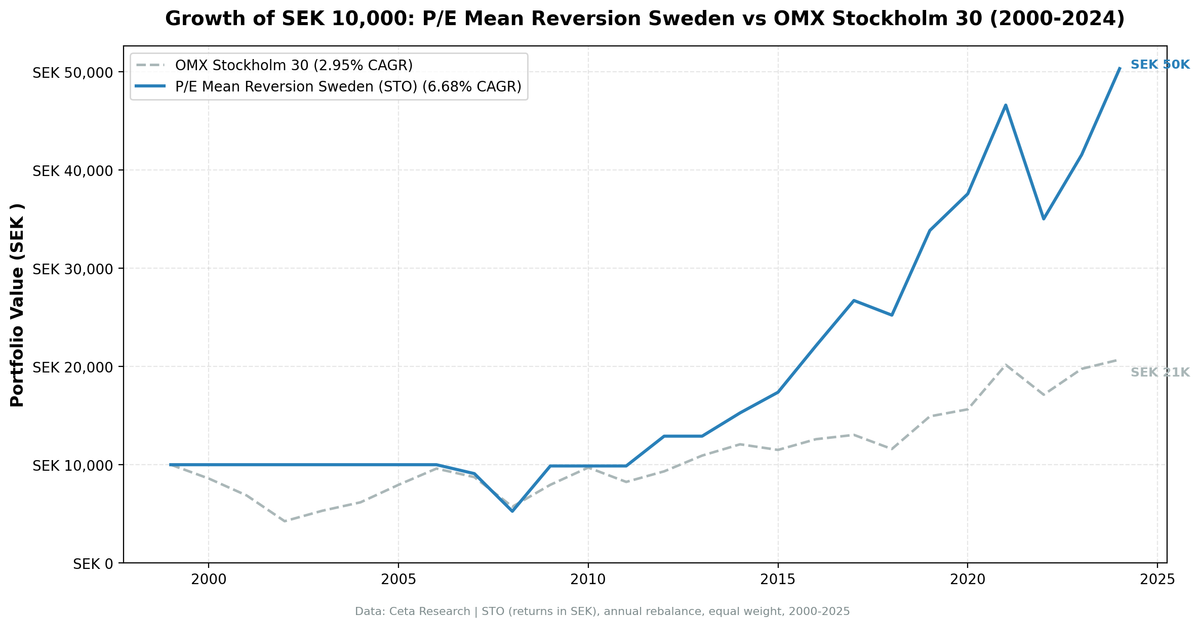
We tested a sector-relative P/E mean reversion screen on 25 years of Swedish stock data from Nasdaq Stockholm. The signal buys stocks trading at a 40%+ discount to their sector peers on P/E, filtered for quality. The strategy returned 6.68% annually vs 2.95% for the OMX Stockholm 30, a 3.72% excess, with a shallower drawdown than the index and a 64% win rate.
Contents
- Method
- What Is Sector-Relative P/E Mean Reversion?
- The Screen
- Sector-Relative P/E Screen: Sweden (STO)
- What We Found
- 25 years, 15 of them invested. 3.72% annual alpha.
- The cash years are not where the alpha came from
- Year-by-year returns
- 2009: the year that carries the record
- 2014-2020: the consistent stretch
- 2022: the worst relative year
- Backtest Methodology
- Limitations
- Conclusion
Sweden is the most interesting result outside the four markets that beat the S&P 500, and it comes with the study's most awkward constraint: the screen sits in cash 40% of the time.
Data: FMP financial data warehouse, 2000–2025. Updated August 2026.
Method
Data source: Ceta Research (FMP financial data warehouse) Universe: STO-listed companies, market cap > 5B SEK Period: 2000-2024 (25 years), 15 invested years Rebalancing: Annual (January), equal weight, top 30 by lowest P/E-to-sector ratio Benchmark: OMX Stockholm 30 (^OMXS30, price return) Cash rule: Hold cash if fewer than 10 stocks qualify
The backtest reads annual (FY) filings from financial_ratios for P/E and debt ratios and key_metrics for ROE and market cap, with a 45-day lag on every filing to prevent look-ahead bias. Trades execute at the next day's close after the signal date. Returns are in SEK.
What Is Sector-Relative P/E Mean Reversion?
The screen compares each stock's P/E to the current median P/E of its sector peers, not to its own history. If Swedish Industrials trade at a median 20x and a specific industrial trades at 11x, that's a 45% discount. The bet is that the gap closes: the multiple expands, earnings grow, or the company gets taken out.
The cross-sectional framing is what makes it usable in a market like Sweden. You don't need five years of clean P/E history per company. You need one year of data and at least five sector peers to build a median against.
Signal: - Stock P/E < 60% of sector median P/E (40%+ discount to peers) - P/E range: 3-50 (exclude loss-making and extreme valuations) - Minimum 5 stocks per sector required to compute a valid median
Quality filters:
| Criterion | Metric | Threshold |
|---|---|---|
| Profitable | Return on Equity | > 8% |
| Manageable debt | Debt-to-Equity | < 2.0 |
Size:
| Criterion | Metric | Threshold |
|---|---|---|
| Institutional grade | Market Cap | > 5B SEK |
Stocks must pass all filters. The top 30 by deepest discount are selected each year, equal weighted. If fewer than 10 qualify, the portfolio holds cash for that year.
The Screen
Sector-Relative P/E Screen: Sweden (STO)
WITH km_dedup AS (
  SELECT k.* FROM key_metrics_ttm k
  JOIN (SELECT symbol, MAX(fetchedAtEpoch) AS max_e FROM key_metrics_ttm GROUP BY symbol) lat
    ON k.symbol = lat.symbol AND k.fetchedAtEpoch = lat.max_e
),
fr_dedup AS (
  SELECT f.* FROM financial_ratios_ttm f
  JOIN (SELECT symbol, MAX(fetchedAtEpoch) AS max_e FROM financial_ratios_ttm GROUP BY symbol) lat
    ON f.symbol = lat.symbol AND f.fetchedAtEpoch = lat.max_e
),
universe AS (
    SELECT k.symbol, p.companyName, p.exchange, p.sector,
           fr.priceToEarningsRatioTTM AS pe_ttm, k.returnOnEquityTTM AS roe,
           fr.debtToEquityRatioTTM AS de, p.marketCap,
           ROW_NUMBER() OVER (PARTITION BY p.companyName ORDER BY p.averageVolume DESC) AS listing_rank
    FROM km_dedup k
    JOIN fr_dedup fr ON k.symbol = fr.symbol
    JOIN profile p ON k.symbol = p.symbol
    WHERE fr.priceToEarningsRatioTTM BETWEEN 3 AND 50
      AND k.returnOnEquityTTM > 0.08
      AND (fr.debtToEquityRatioTTM IS NULL OR (fr.debtToEquityRatioTTM >= 0 AND fr.debtToEquityRatioTTM < 2.0))
      AND p.marketCap > 5000000000
      AND p.sector IS NOT NULL
      AND p.exchange = 'STO'
),
primary_listing AS (
    SELECT * FROM universe WHERE listing_rank = 1
),
sector_medians AS (
    SELECT sector,
           PERCENTILE_CONT(0.5) WITHIN GROUP (ORDER BY pe_ttm) AS median_pe,
           COUNT(*) AS n_sector_stocks
    FROM primary_listing GROUP BY sector HAVING COUNT(*) >= 5
)
SELECT u.symbol, u.companyName, u.sector,
       ROUND(u.pe_ttm, 2) AS pe_ttm, ROUND(sm.median_pe, 2) AS sector_median_pe,
       ROUND(u.pe_ttm / sm.median_pe, 3) AS pe_ratio_to_sector,
       ROUND((1 - u.pe_ttm / sm.median_pe) * 100, 1) AS discount_pct,
       ROUND(u.roe * 100, 1) AS roe_pct, ROUND(u.de, 2) AS debt_to_equity,
       ROUND(u.marketCap / 1e9, 1) AS mktcap_b_sek
FROM primary_listing u JOIN sector_medians sm ON u.sector = sm.sector
WHERE u.pe_ttm / sm.median_pe < 0.60
ORDER BY u.pe_ttm / sm.median_pe ASC LIMIT 30
Run this query on Ceta Research
Live screen note: the query keeps one listing per company (the most liquid share class) and sizes on profile.marketCap, which is denominated in the listing currency. The backtest applied neither adjustment, so its holding counts include separate share classes of the same company.
Run it today (August 2026) and it returns 10 names, not 30. That's not a bug in the query. It's the same constraint that produces 10 cash years in the backtest.
What We Found
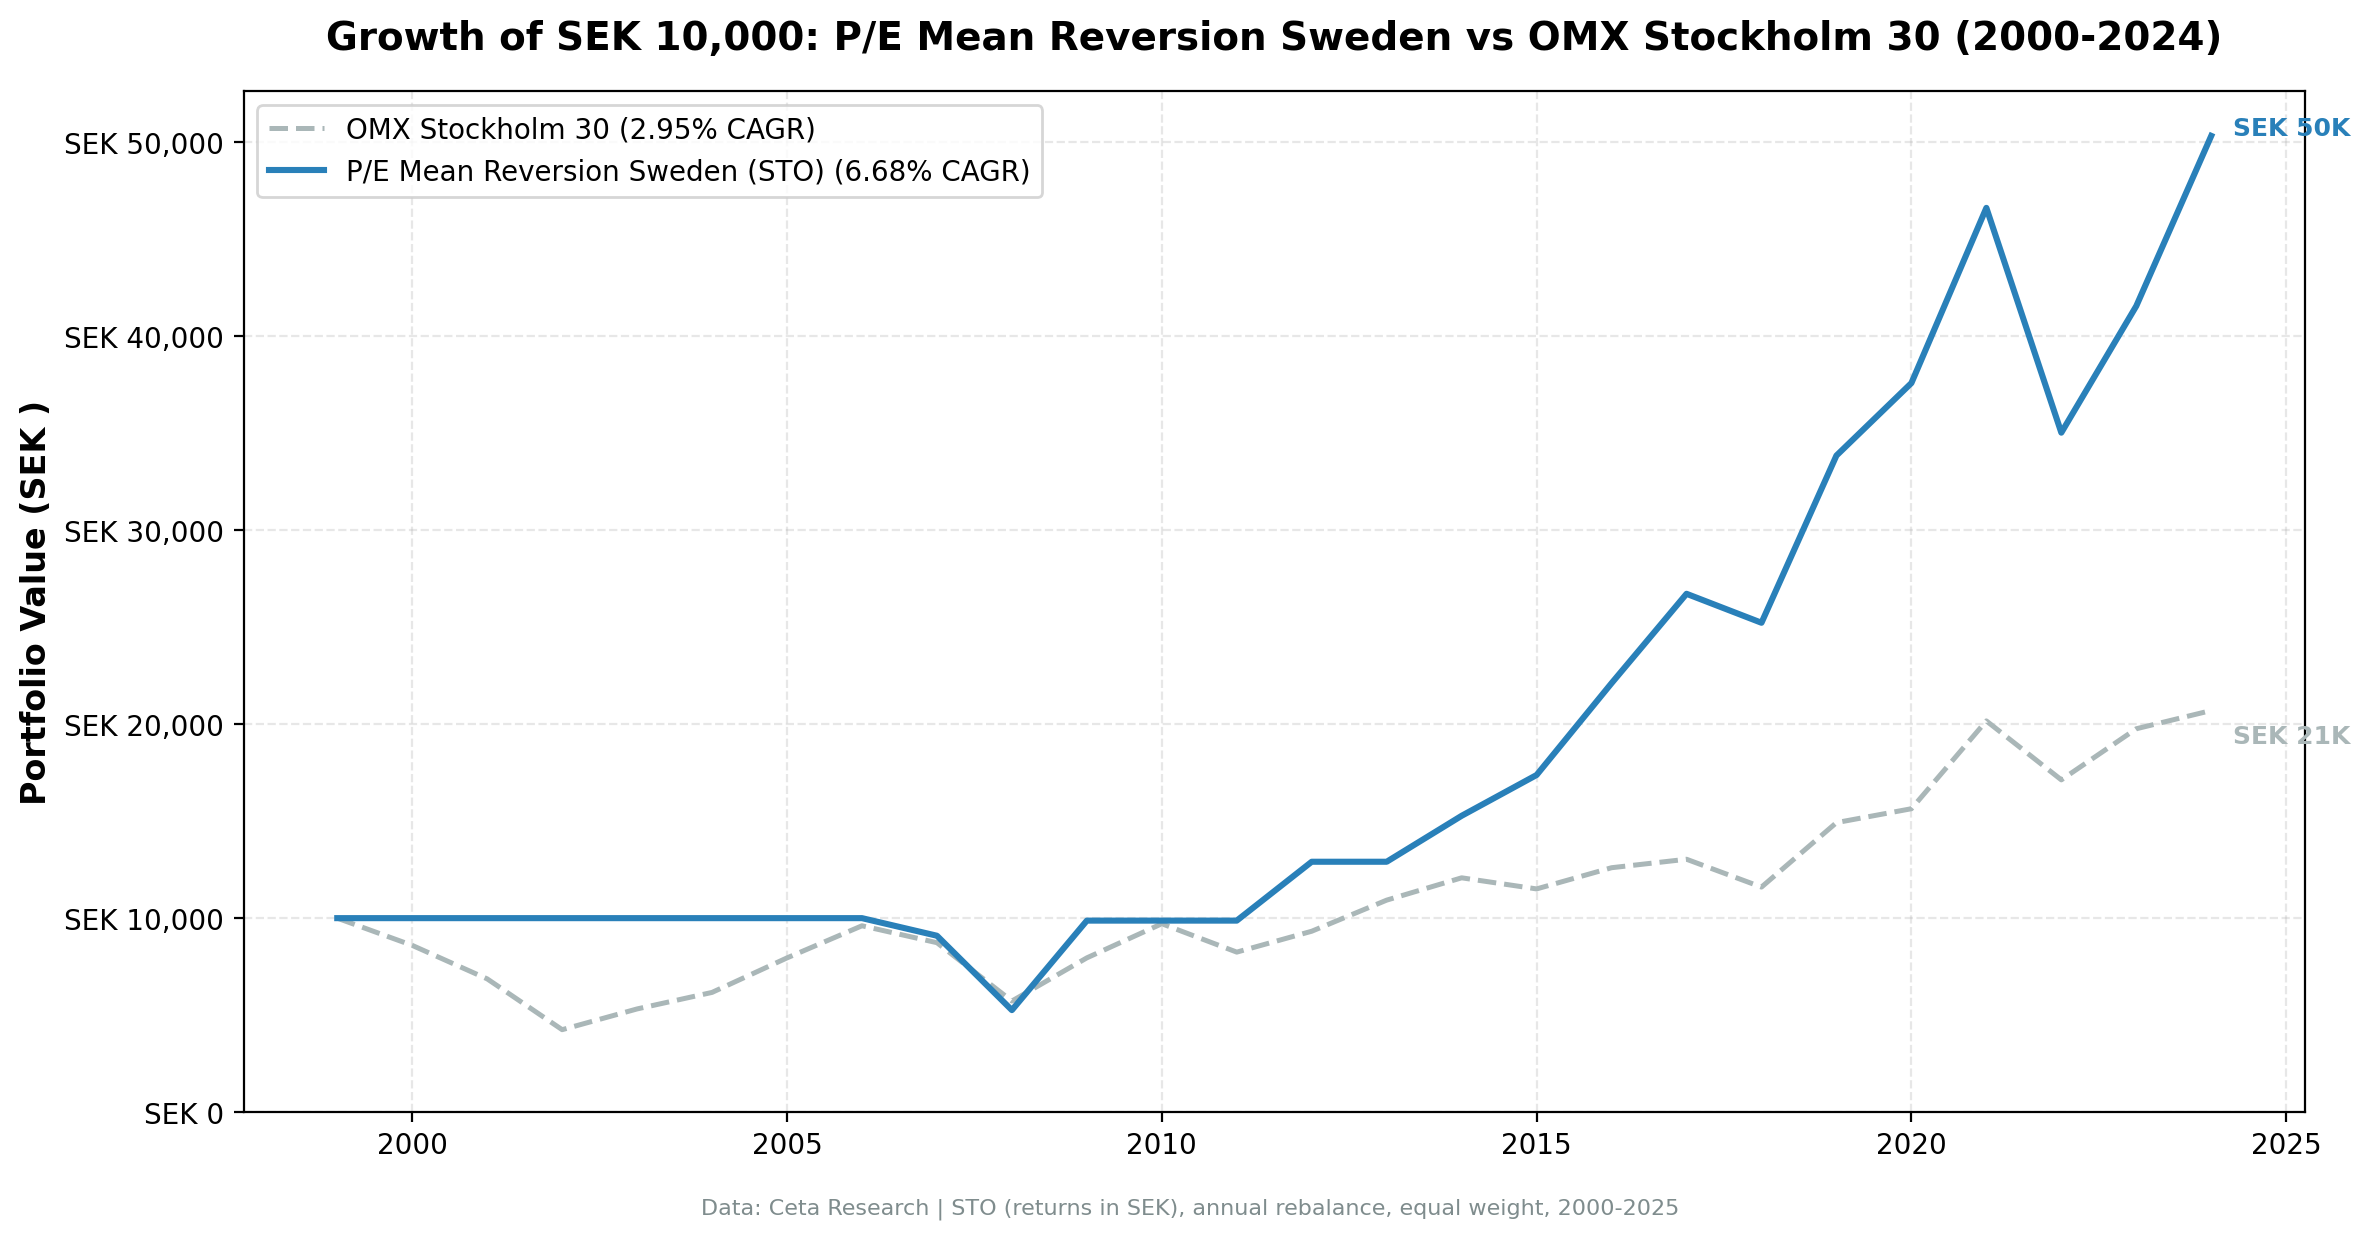
25 years, 15 of them invested. 3.72% annual alpha.
| Metric | P/E Mean Reversion (Sweden) | OMX Stockholm 30 |
|---|---|---|
| CAGR | 6.68% | 2.95% |
| Total Return | 403.36% | 107.03% |
| Sharpe Ratio | 0.197 | 0.047 |
| Sortino Ratio | 0.435 | 0.070 |
| Max Drawdown | -47.44% | -57.52% |
| Up Capture | 102.01% | 100% |
| Down Capture | 42.02% | 100% |
| Beta | 0.717 | 1.00 |
| Win Rate vs Index | 64% | - |
| Avg Stocks per Year | 13.7 | - |
| Cash Periods | 10 of 25 | - |
10,000 SEK grew to about 50,336 SEK vs 20,703 SEK for the index. The capture profile is the appealing part: 102% of the upside against 42% of the downside, with a beta of 0.717 and a max drawdown 10 points shallower than the index's own.
The cash years are not where the alpha came from
The obvious worry with a strategy that holds cash 40% of the time is that its record is really a market-timing record. It isn't, and the split is clean:
| Period | Strategy | OMX Stockholm 30 |
|---|---|---|
| 2000-2006 (all cash) | 0.0% | -3.9% |
| 2007-2024 | +403.4% (9.39% a year) | +115.5% (4.36% a year) |
Sitting out 2000 to 2006 was worth about 4 percentage points in total. The index fell 57.5% through the dot-com bust and then gained 126% over the following four years, and those two moves nearly cancelled. All of the outperformance comes from the years the screen was actually invested, where it compounded at 9.39% against the index's 4.36%.
That matters for how you'd use this. The cash rule isn't adding value by dodging crashes. It's a coverage constraint, and the strategy's edge shows up when it has something to hold.
Year-by-year returns
| Year | Sweden P/E MR | OMX Stockholm 30 | Excess |
|---|---|---|---|
| 2000 | Cash (0.0%) | -14.0% | +14.0% |
| 2001 | Cash (0.0%) | -20.1% | +20.1% |
| 2002 | Cash (0.0%) | -38.2% | +38.2% |
| 2003 | Cash (0.0%) | +25.2% | -25.2% |
| 2004 | Cash (0.0%) | +16.0% | -16.0% |
| 2005 | Cash (0.0%) | +28.8% | -28.8% |
| 2006 | Cash (0.0%) | +20.8% | -20.8% |
| 2007 | -9.1% | -9.1% | +0.0% |
| 2008 | -42.2% | -34.5% | -7.7% |
| 2009 | +87.8% | +38.9% | +48.9% |
| 2010 | Cash (0.0%) | +22.1% | -22.1% |
| 2011 | Cash (0.0%) | -15.1% | +15.1% |
| 2012 | +30.8% | +13.1% | +17.7% |
| 2013 | Cash (0.0%) | +17.2% | -17.2% |
| 2014 | +18.4% | +10.5% | +7.8% |
| 2015 | +13.8% | -4.7% | +18.5% |
| 2016 | +27.2% | +9.5% | +17.7% |
| 2017 | +20.8% | +3.5% | +17.4% |
| 2018 | -5.6% | -11.0% | +5.4% |
| 2019 | +34.2% | +28.7% | +5.5% |
| 2020 | +11.0% | +4.8% | +6.2% |
| 2021 | +24.0% | +29.0% | -4.9% |
| 2022 | -24.9% | -15.1% | -9.8% |
| 2023 | +18.6% | +15.4% | +3.2% |
| 2024 | +21.1% | +4.8% | +16.3% |
2009: the year that carries the record
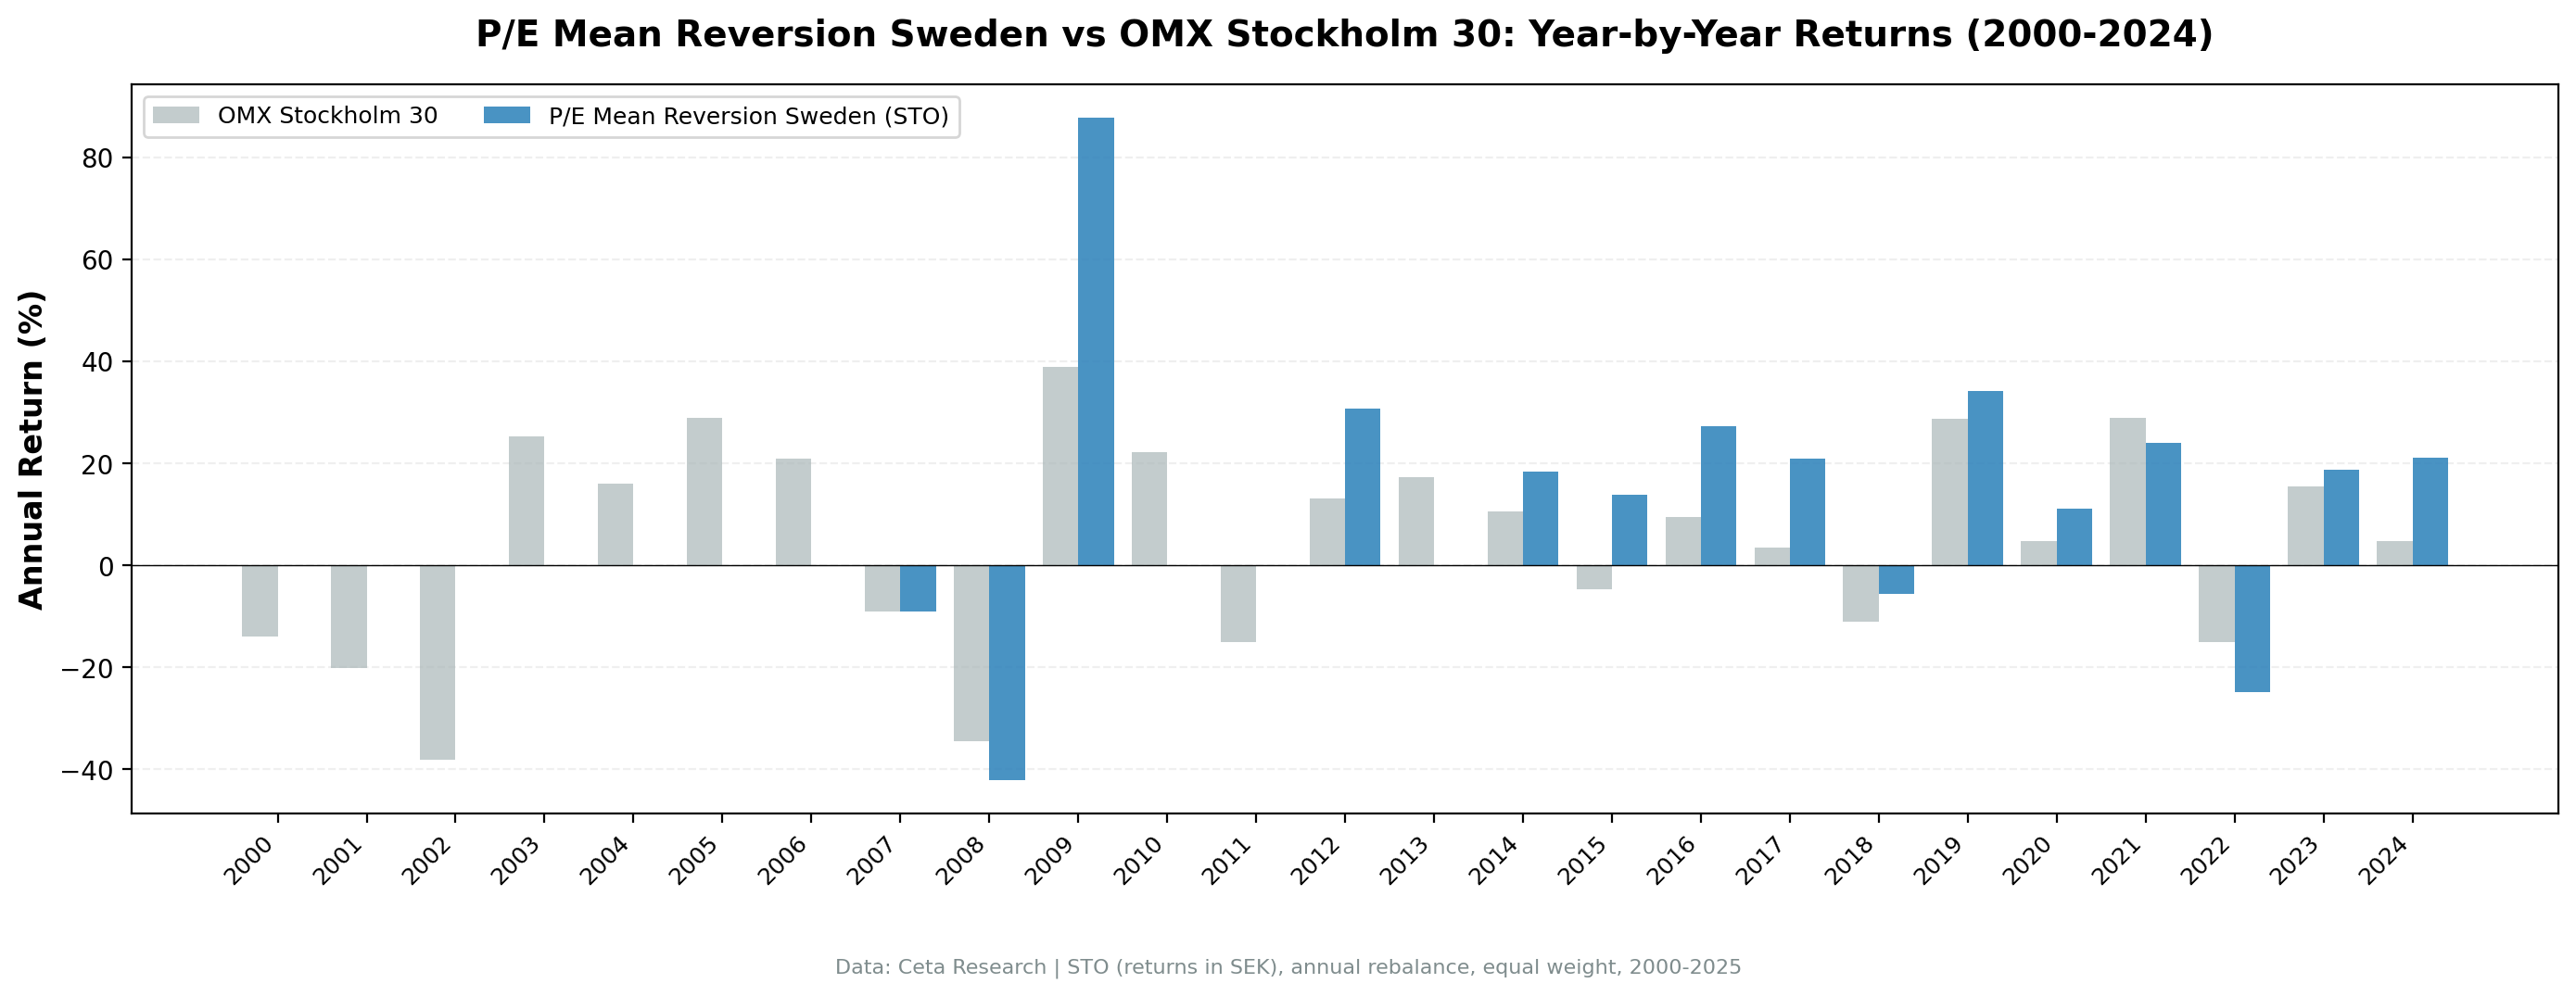
+87.8% against an index up 38.9%. Swedish equities are heavily weighted toward industrials, materials and banks, all of which were priced for a depression at the start of 2009 and repriced violently once it didn't arrive. The screen was holding the cheapest names inside each of those sectors, which is exactly the position that benefits most from a snapback.
Strip 2009 out and the strategy still beats the index over the remaining invested years, but the margin narrows a lot. One year doing this much work is a real fragility, and it's the single biggest reason to treat the 3.72% figure with caution.
2014-2020: the consistent stretch
Seven consecutive invested years, all of them positive excess: +7.8%, +18.5%, +17.7%, +17.4%, +5.4%, +5.5%, +6.2%. This is the most convincing part of the record because it doesn't depend on a crisis or a recovery. It's the screen doing ordinary work in ordinary markets, including 2018 when the index fell 11% and the portfolio gave up only 5.6%.
2022: the worst relative year
-24.9% against an index down 15.1%. Rising rates hit the mid-cap Swedish industrials and consumer names that dominate this screen harder than they hit the large-cap index. A 30-stock target that only fills to 13 or 14 names leaves the portfolio exposed to whichever part of the market is being repriced.
Backtest Methodology
Full methodology documentation: backtests/METHODOLOGY.md
| Parameter | Choice |
|---|---|
| Universe | STO-listed companies, Market Cap > 5B SEK |
| Signal | Stock P/E < 60% of sector median, P/E 3-50, ROE > 8%, D/E < 2.0 |
| Portfolio | Top 30 by lowest P/E-to-sector ratio, equal weight |
| Rebalancing | Annual (January) |
| Cash rule | Hold cash if < 10 qualify |
| Benchmark | OMX Stockholm 30 (^OMXS30, price return) |
| Period | 2000-2024 (25 years), 15 invested |
| Currency | SEK (local) |
| Data | Point-in-time (45-day lag on FY financial statements) |
| Execution | Next-day close after the signal date |
| Transaction costs | 0.1% one-way (size-tiered by market cap) |
Limitations
40% of periods are cash. This is the headline constraint. The strategy holds nothing in 10 of 25 years, including a scattered run in 2010, 2011 and 2013 rather than one clean early gap. You can't compound what you aren't holding, and a strategy that spends this much time flat needs a plan for the capital in the meantime. The 6.68% CAGR already includes those zero years, so it's an honest number, but it's a return on a strategy that was only working two years in three.
15 invested years is a small sample. Every risk metric on this page rests on 15 observations, and one of them (2009, +87.8%) is an outlier large enough to move the whole record. Treat the 3.72% excess as suggestive rather than established.
The benchmark is price-only. The OMX Stockholm 30 series here excludes dividends while the portfolio's stock returns include them via adjusted closes. Swedish large caps have historically paid substantial dividends, so a total-return version of the index would close a meaningful part of the 3.72% gap. This is the same caveat that applies to the UK page in this series, and it's the reason the local excess figures across the study aren't directly comparable to the US one.
Thin portfolios. The screen averages 13.7 names against a 30-stock target, and the live version currently returns 12. Concentration risk is real, and 2022 is what it looks like.
Share classes double up in the backtest. Swedish companies commonly list A and B shares, and the backtest treats each class as a separate name. Investor AB and Industrivärden contribute two slots apiece, so the 13.7 average holding count overstates the number of distinct businesses held. The live screen above now collapses each company to its most liquid listing, which is why it returns 10 names rather than 12. The backtest figures on this page do not carry that adjustment, and correcting it would concentrate the portfolio further rather than improve it.
Survivorship bias. Exchange membership uses current profiles, not historical. Delistings and bankruptcies aren't fully tracked, which is a standard limitation of this backtest approach and flatters all results in this series.
Conclusion
Sector-relative P/E mean reversion on Swedish stocks returned 6.68% a year against 2.95% for the OMX Stockholm 30, with 42% down-capture and a drawdown 10 points shallower than the index. The excess comes from the invested years rather than from sitting in cash, which is the result you want to see from a strategy with this much cash exposure.
The catch is coverage. Stockholm doesn't consistently offer 30 quality companies trading at a 40% discount to their sector peers, so the screen spends 40% of its life flat and fills to an average of 13.7 names when it does deploy. That makes Sweden a reasonable satellite position and a poor core one.
Compared to the rest of this 13-market study, Sweden lands in an unusual spot: it loses to the S&P 500 by 0.96% a year while beating its own market by 3.72%. If you already want Swedish equity exposure, this screen improved on the index over 25 years. If you're deciding where to allocate in the first place, that's a different question, and the absolute return is the one that answers it.
Data: Ceta Research (FMP financial data warehouse). Returns in SEK (local currency). OMX Stockholm 30 (price return) used as local benchmark. Past performance does not guarantee future results. This is not investment advice. See full methodology at github.com/ceta-research/backtests.

