
P/E Mean Reversion on German Stocks: 10.37% CAGR, 5.92% Alpha vs DAX
A sector-relative P/E screen on 25 years of XETRA-listed data returned 10.37% annually vs 4.45% for the DAX, the best Sharpe of 13 exchanges (0.413) and 43% down-capture. The universe is companies listed on XETRA, not German-domiciled ones, and that distinction changes the answer.

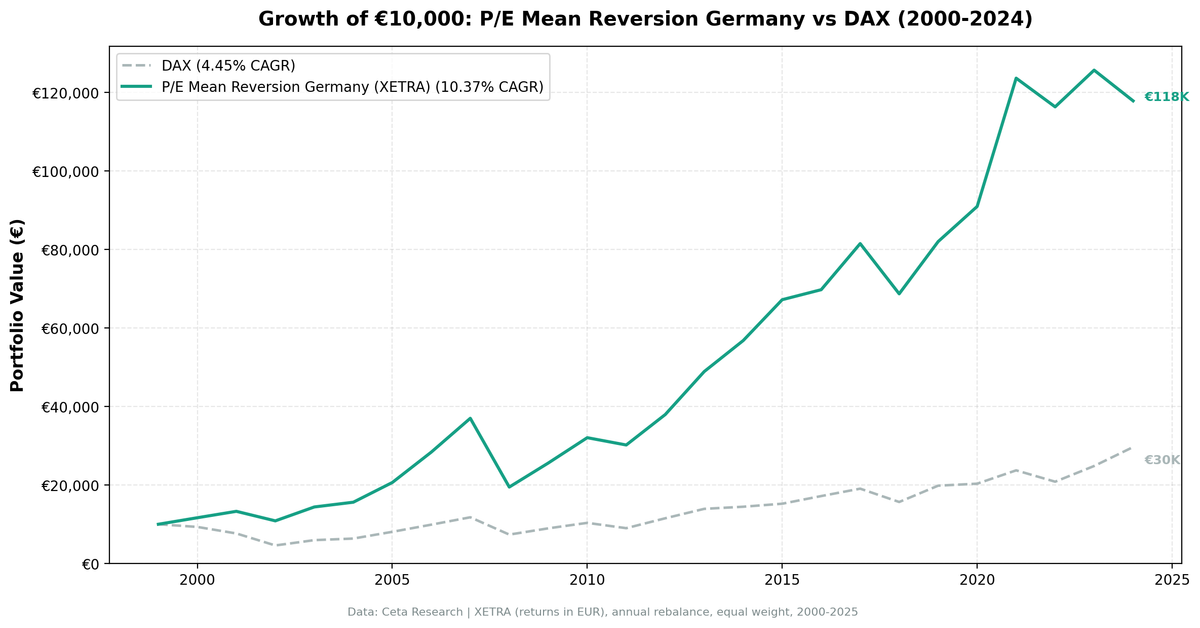
We tested a sector-relative P/E mean reversion screen on 25 years of XETRA-listed stock data. The signal triggers when a stock's P/E ratio falls 40% below its sector median, filtered for quality. The strategy returned 10.37% annually vs 4.45% for the DAX, with 5.92% excess return, the highest Sharpe ratio of all 13 exchanges tested (0.413), and down-capture of 43.04%.
Contents
- Method
- What Is Sector-Relative P/E Mean Reversion?
- The Screen
- Sector-Relative P/E Screen for XETRA (SQL)
- What We Found
- 25 years. 5.92% annual alpha vs DAX. Best Sharpe ratio of 13 exchanges tested.
- The asymmetry story
- Year-by-year returns
- 2000-2001: resilience during dot-com crash
- 2005-2007: pre-crisis surge
- 2008: the worst year
- 2016 and 2024: the underperformance years
- 2022: standout downside protection
- 2024: the worst relative year
- Backtest Methodology
- Limitations
- Conclusion
One thing to be clear about up front: this is a test of the companies listed on XETRA, not of German companies. Most of the qualifying names are foreign businesses with a Frankfurt listing, and that distinction turns out to matter a lot. The limitations section has the numbers.
Data: FMP financial data warehouse, 2000–2025. Updated August 2026.
Method
Data source: Ceta Research (FMP financial data warehouse) Universe: XETRA-listed companies (any domicile), market cap > €500M Period: 2000-2024 (25 years, 0 cash periods) Rebalancing: Annual (January), equal weight, top 30 by discount to sector median Benchmark: DAX (^GDAXI, total return) Cash rule: Hold cash if fewer than 10 stocks qualify
The backtest reads annual (FY) filings from financial_ratios for P/E and debt ratios, key_metrics for ROE and market cap, and profile for sector classification, with a 45-day lag on every filing to prevent look-ahead bias. Trades execute at the next day's close after the signal date. The universe is every company listed on XETRA, regardless of where it's headquartered.
What Is Sector-Relative P/E Mean Reversion?
This strategy looks for stocks trading at a steep discount to their own sector peers. If the median Industrials stock on XETRA trades at 18x earnings and a specific company trades at 10x, that's a 44% discount. The bet is that the gap closes: either the stock's multiple expands, its earnings grow, or both.
The key distinction from time-series P/E compression is the comparison point. We're not asking "is this stock cheap relative to its own history?" We're asking "is this stock cheap relative to what the market is currently paying for similar businesses?" That cross-sectional view updates with market conditions and doesn't require years of historical P/E data per stock.
Signal: - Stock P/E < 60% of sector median P/E (40%+ discount to peers) - P/E range: 3-50 (exclude loss-making and extreme valuations) - Minimum 5 stocks per sector required to compute a valid median
Quality filters:
| Criterion | Metric | Threshold |
|---|---|---|
| Profitable | Return on Equity | > 8% |
| Manageable debt | Debt-to-Equity | < 2.0 |
Size:
| Criterion | Metric | Threshold |
|---|---|---|
| Institutional grade | Market Cap | > €500M |
Stocks must pass all filters. The top 30 by deepest discount to sector median are selected each year, equal weighted.
The Screen
Sector-Relative P/E Screen for XETRA (SQL)
WITH universe AS (
    SELECT k.symbol, p.companyName, p.exchange, p.sector,
           fr.priceToEarningsRatioTTM AS pe_ttm, k.returnOnEquityTTM AS roe,
           fr.debtToEquityRatioTTM AS de, p.marketCap,
           ROW_NUMBER() OVER (PARTITION BY p.companyName ORDER BY p.averageVolume DESC) AS listing_rank
    FROM key_metrics_ttm k
    JOIN financial_ratios_ttm fr ON k.symbol = fr.symbol
    JOIN profile p ON k.symbol = p.symbol
    WHERE fr.priceToEarningsRatioTTM BETWEEN 3 AND 50
      AND k.returnOnEquityTTM > 0.08
      AND (fr.debtToEquityRatioTTM IS NULL OR (fr.debtToEquityRatioTTM >= 0 AND fr.debtToEquityRatioTTM < 2.0))
      AND p.marketCap > 500000000
      AND p.sector IS NOT NULL
      AND p.exchange IN ('XETRA')
),
primary_listing AS (
    SELECT * FROM universe WHERE listing_rank = 1
),
sector_medians AS (
    SELECT exchange, sector,
           PERCENTILE_CONT(0.5) WITHIN GROUP (ORDER BY pe_ttm) AS median_pe,
           COUNT(*) AS n_sector_stocks
    FROM primary_listing GROUP BY exchange, sector HAVING COUNT(*) >= 5
)
SELECT u.symbol, u.companyName, u.sector,
       ROUND(u.pe_ttm, 2) AS pe_ttm, ROUND(sm.median_pe, 2) AS sector_median_pe,
       ROUND(u.pe_ttm / sm.median_pe, 3) AS pe_ratio_to_sector,
       ROUND((1 - u.pe_ttm / sm.median_pe) * 100, 1) AS discount_pct,
       ROUND(u.roe * 100, 1) AS roe_pct, ROUND(u.de, 2) AS debt_to_equity,
       ROUND(u.marketCap / 1e6, 0) AS mktcap_m_eur
FROM primary_listing u JOIN sector_medians sm ON u.exchange = sm.exchange AND u.sector = sm.sector
WHERE u.pe_ttm / sm.median_pe < 0.60
ORDER BY u.pe_ttm / sm.median_pe ASC LIMIT 30
Run this query on Ceta Research
Live screen note: the query keeps one listing per company (the most liquid share class) and sizes on profile.marketCap, which is denominated in the listing currency. The backtest applied neither adjustment, so its holding counts include separate share classes of the same company.
What We Found
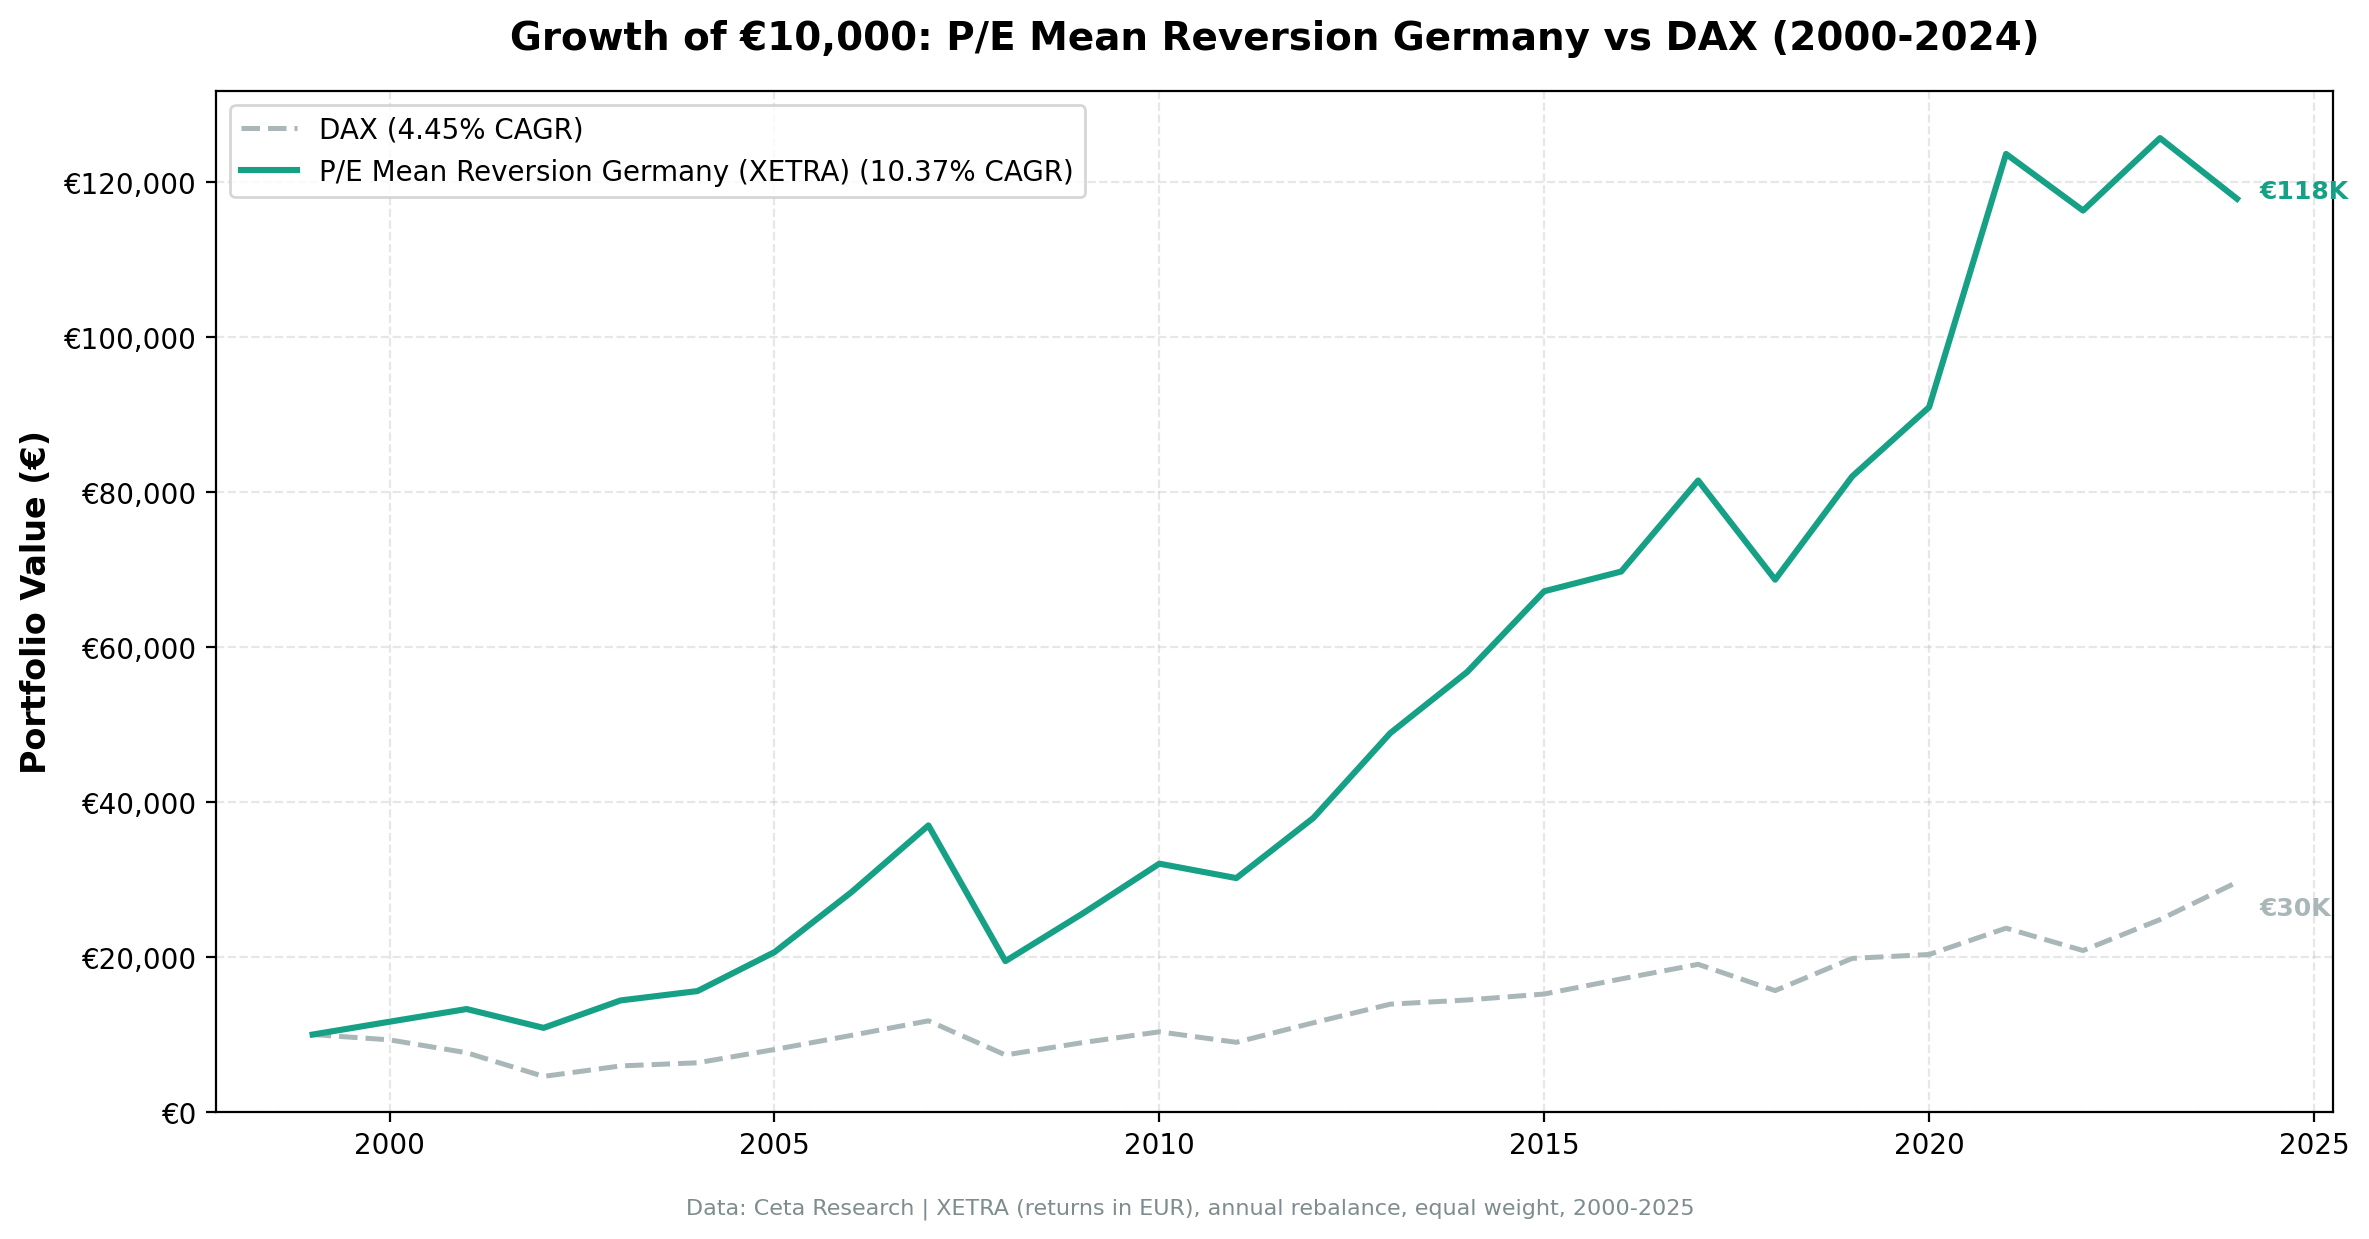
25 years. 5.92% annual alpha vs DAX. Best Sharpe ratio of 13 exchanges tested.
| Metric | P/E Mean Reversion (XETRA) | DAX |
|---|---|---|
| CAGR | 10.37% | 4.45% |
| Total Return | 1,078.28% | 196.63% |
| Sharpe Ratio | 0.413 | 0.123 |
| Sortino Ratio | 0.723 | 0.180 |
| Max Drawdown | -47.35% | -54.00% |
| Up Capture | 121.79% | 100% |
| Down Capture | 43.04% | 100% |
| Win Rate vs DAX | 76% | - |
| Avg Stocks per Year | 16.7 | - |
| Cash Periods | 0 of 25 | - |
€10,000 grew to ~€117,828 vs ~€29,663 for the DAX. That's nearly 4x the benchmark's terminal wealth. The DAX returned 4.45% CAGR over this period (total return version), making the strategy's 10.37% CAGR a 5.92% annual alpha.
The Sharpe ratio of 0.413 ranked first across all 13 exchanges in this study. The down-capture of 43.04% means when the DAX lost 10%, this portfolio lost about 4.3% on average, and its worst drawdown (-47.35%) was shallower than the index's own (-54.00%).
Zero cash periods. The XETRA-listed universe consistently produced qualifying stocks meeting the P/E discount, quality, and size filters every single year over 25 years. Restricting that universe to German-headquartered companies breaks this completely, which is the subject of the limitations section.
The asymmetry story
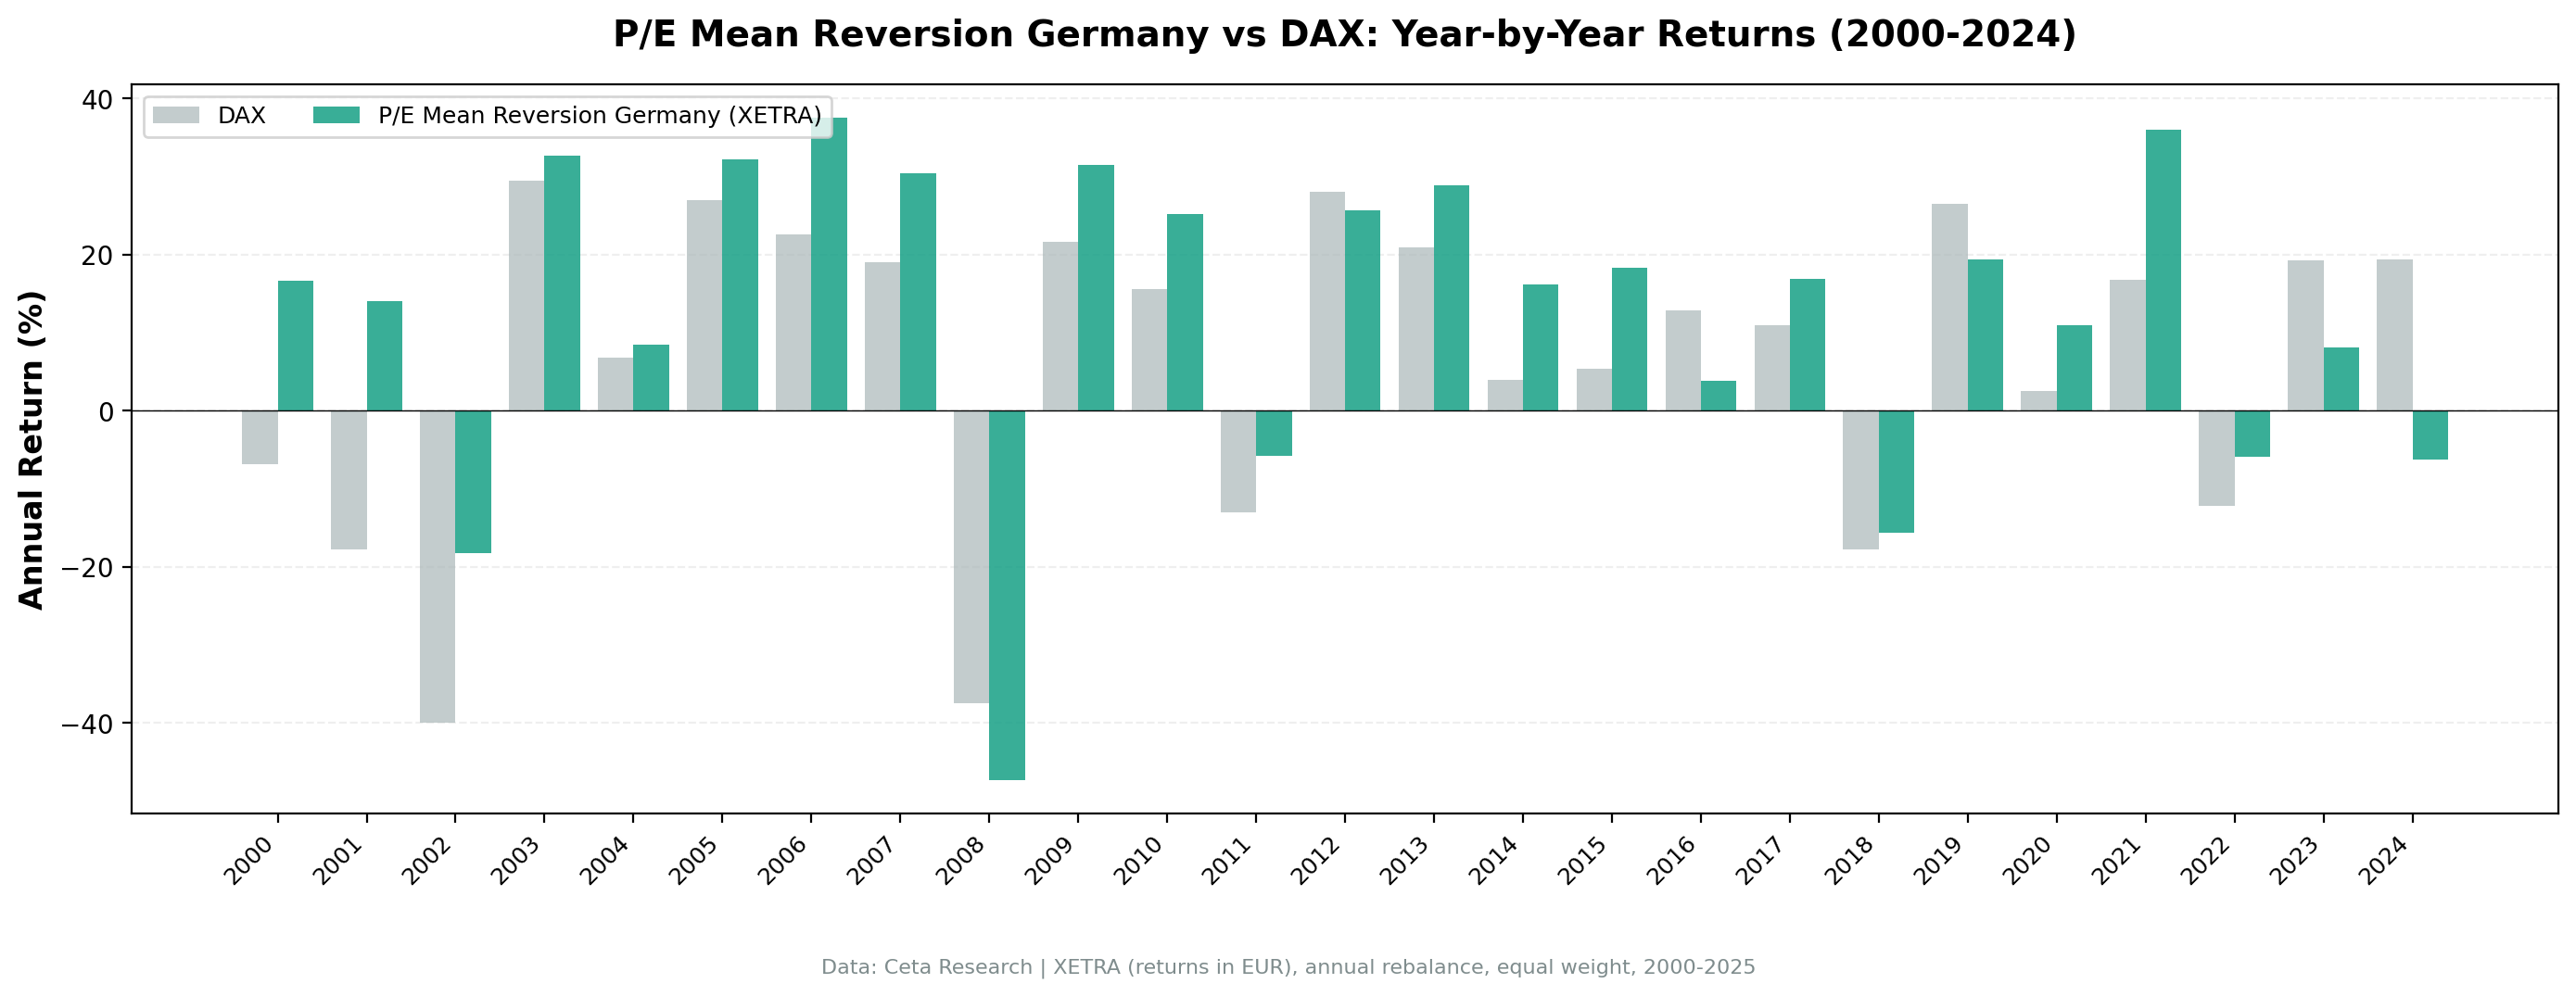
The win rate is 76%. The strategy beat the DAX in 19 of 25 years. The annual alpha of 5.92% and 4x terminal wealth gap show this is a consistent outperformer, not a one-era phenomenon.
When this screen wins, it wins big. The early 2000s, 2006-2007, 2010, 2014-2015 and 2021 all produced large positive excess returns. When it loses, the losses are usually smaller in magnitude. A 43% down-capture ratio means the drag in bad years is damped relative to the gains in good years. Over 25 years, the compounding does the rest.
Year-by-year returns
| Year | P/E Mean Reversion | DAX | Excess |
|---|---|---|---|
| 2000 | +16.6% | -6.8% | +23.4% |
| 2001 | +14.0% | -17.8% | +31.9% |
| 2002 | -18.3% | -39.9% | +21.7% |
| 2003 | +32.6% | +29.4% | +3.2% |
| 2004 | +8.4% | +6.8% | +1.6% |
| 2005 | +32.2% | +27.0% | +5.2% |
| 2006 | +37.5% | +22.6% | +14.9% |
| 2007 | +30.3% | +19.0% | +11.4% |
| 2008 | -47.4% | -37.4% | -9.9% |
| 2009 | +31.4% | +21.6% | +9.8% |
| 2010 | +25.2% | +15.6% | +9.7% |
| 2011 | -5.8% | -13.1% | +7.3% |
| 2012 | +25.7% | +28.0% | -2.3% |
| 2013 | +28.9% | +20.8% | +8.0% |
| 2014 | +16.2% | +3.9% | +12.3% |
| 2015 | +18.3% | +5.3% | +13.0% |
| 2016 | +3.8% | +12.8% | -9.0% |
| 2017 | +16.8% | +11.0% | +5.9% |
| 2018 | -15.7% | -17.8% | +2.1% |
| 2019 | +19.4% | +26.5% | -7.1% |
| 2020 | +10.9% | +2.5% | +8.4% |
| 2021 | +35.9% | +16.7% | +19.2% |
| 2022 | -5.9% | -12.2% | +6.3% |
| 2023 | +8.0% | +19.2% | -11.2% |
| 2024 | -6.2% | +19.4% | -25.6% |
2000-2001: resilience during dot-com crash
The dot-com crash hit growth stocks globally, including German tech. But the DAX fell harder (-6.8% in 2000, -17.8% in 2001) while this portfolio returned +16.6% and +14.0%. The cumulative gap from those two years was +56 percentage points.
The sector-relative screen filtered toward industrials, financials, and consumer names trading at discounts to sector peers. These sectors had limited exposure to the tech bubble, and the cheapest stocks within each sector had the most room to recover when fundamentals normalized.
2005-2007: pre-crisis surge
Three consecutive years of outperformance: +5.2%, +14.9%, and +11.4% excess returns. This was the peak of the European economic expansion, and exporters and financials were pricing in high earnings growth. Stocks trading at discounts to sector medians caught up as earnings reverted upward.
By the end of 2007, the portfolio was significantly ahead of the DAX on a cumulative basis.
2008: the worst year
| Event | P/E Mean Reversion | DAX | Gap |
|---|---|---|---|
| Dot-com bust (2000-2002) | +8.6% cumulative | -54.0% cumulative | +62.6% |
| Financial crisis (2008) | -47.4% | -37.4% | -9.9% |
| Euro debt crisis (2011) | -5.8% | -13.1% | +7.3% |
| 2022 inflation shock | -5.9% | -12.2% | +6.3% |
2008 was brutal. Industrials and financials were directly exposed to the global credit crisis. The -47.35% drawdown exceeded the DAX's -37.4% loss that year by 10 percentage points. No quality filter protects a concentrated portfolio of small-to-mid-cap names when the global financial system seizes up.
The down-capture advantage of 43% is a 25-year average. Individual crisis years can be far worse. 2008 and 2024 prove that.
2016 and 2024: the underperformance years
2016 saw -9.0% excess return (+3.8% vs DAX +12.8%). This was a year of DAX strength driven by financials repricing upward after ECB policy easing. The sector-relative screen missed it because it was positioned in non-financial sectors trading at discounts. When one sector dominates index returns, the screen's equal-weight, multi-sector positioning underperforms.
2024 was far worse at -25.6% excess, and it's the largest single-year miss in the series. The DAX rose 19.4% while this portfolio fell 6.2%.
2022: standout downside protection
The inflation shock of 2022 was different. When high-multiple growth stocks collapsed under rising rates, value names held up. The portfolio fell only -5.9% while the DAX dropped -12.2%, a +6.3% excess return. That's the asymmetry working: the strategy has low exposure to the duration risk embedded in growth stocks, so rate-driven selloffs hit it less.
2024: the worst relative year
The most severe underperformance year was 2024: -25.6% excess return (-6.2% portfolio vs +19.4% DAX). Germany entered recession, industrial output declined, and automotive and chemicals earnings contracted. The screen concentrated in these struggling sectors, which traded at discounts for fundamental reasons. The DAX rose because its diversified composition included sectors that held up better.
Backtest Methodology
Full methodology documentation: backtests/METHODOLOGY.md
| Parameter | Choice |
|---|---|
| Universe | XETRA-listed companies (any domicile), Market Cap > €500M |
| Signal | Stock P/E < 60% of sector median, P/E 3-50, ROE > 8%, D/E < 2.0 |
| Portfolio | Top 30 by deepest discount to sector median, equal weight |
| Rebalancing | Annual (January) |
| Cash rule | Hold cash if < 10 qualify |
| Benchmark | DAX Total Return (^GDAXI) |
| Execution | Next-day close after the signal date |
| Period | 2000-2024 (25 years) |
| Data | Point-in-time (45-day lag on FY financial statements) |
| Transaction costs | 0.1% one-way (size-tiered by market cap) |
Limitations
This is an XETRA-listed universe, not a German one, and that changes the answer. The screen selects every company listed on XETRA regardless of domicile, which is the same basis used for all 13 markets in this study so the comparison stays like-for-like. But re-running it on German-headquartered companies only produces a completely different result:
| XETRA universe | CAGR | Excess vs DAX | Invested periods | Avg stocks |
|---|---|---|---|---|
| Exchange-listed (the figures above) | 10.37% | +5.92% | 25 of 25 | 16.7 |
| German-domiciled only | 4.11% | -0.34% | 9 of 25 | 15.2 |
The invested-period count is the tell. Restricted to German companies, the screen can only fill a portfolio in 9 years out of 25: Frankfurt doesn't list enough domestic names that clear a 40% sector discount plus the quality and size filters. So most of the alpha above belongs to foreign companies that happen to have a Frankfurt listing. Read this page as a result about a venue, not about German business. Claims that German sector medians anchor valuations unusually well, or that German industrials reliably re-rate, aren't supported by this test. The UK page passes the same check (+6.47% excess with 22 of 25 periods invested), so this is a Frankfurt-specific problem rather than a flaw in the signal.
Severe 2008 drawdown. The portfolio's -47.35% max drawdown came in 2008, when the DAX lost -37.4%. Over the full period the index's own worst drawdown was deeper (-54.00%), but in the single year that mattered the strategy lost more. The 43% average down-capture doesn't protect against years when sector-relative discounts don't matter because everything sells.
Small effective portfolio in early years. From 2000 to 2003, the XETRA universe after quality and size filters produced only a handful of qualifying stocks in some years. Returns are real but concentration risk was high. The 16.7 average across all 25 years is dragged down by these early years.
Win rate of 76%. The strategy beat the DAX in 19 of 25 years. The payoff comes from both frequency and asymmetric size of wins vs losses (large gains in good years, smaller losses in bad years).
EUR-based returns. The portfolio returns and the DAX benchmark are both in EUR. A European investor gets these returns directly. Non-EUR investors need to account for currency fluctuation when converting to their home currency.
2024 recession sensitivity. The industrial-heavy XETRA universe compresses earnings and multiples together when global industrial production and China demand slow at the same time. The sector-relative filter finds "cheap" stocks, but cheap can get cheaper when the whole sector is under pressure.
Sector concentration. Without a sector cap, the screen can cluster in Industrials and Consumer Cyclical names in down cycles. Single-sector concentration risk isn't bounded by the strategy design.
Conclusion
Sector-relative P/E mean reversion on XETRA-listed stocks delivered 10.37% CAGR over 25 years vs 4.45% for the DAX, with 5.92% annual alpha, the highest Sharpe ratio of 13 exchanges tested (0.413), and down-capture of 43.04%. €10,000 grew to ~€117,828 vs ~€29,663 for the DAX. That's nearly 4x the benchmark's terminal wealth.
The win rate of 76% tells the story. This strategy beat the DAX in 19 of 25 years. It wins big when value reverts (2000-2002, 2006-2007, 2010, 2014-2015, 2021) and limits losses when it doesn't. That asymmetry, sustained over 25 years, compounds into meaningful outperformance.
The important qualifier is the one in the limitations: this is a result about companies listed on XETRA, and it does not survive a restriction to German-headquartered companies, which can only fill the portfolio in 9 years out of 25. If you're using Frankfurt as a venue to reach a broad pool of European and international listings, the result is directly relevant. If you're trying to buy German industry specifically, this backtest doesn't tell you that it works.
The screen struggles when a single sector dominates index returns (2016 financials rally) or when the industrial-heavy end of the universe faces a demand shock (2024).
Data: Ceta Research (FMP financial data warehouse). Returns in EUR (local currency). Benchmark DAX Total Return. Past performance does not guarantee future results. This is not investment advice. See full methodology at github.com/ceta-research/backtests.

