
Japan P/E Compression: +2.45% Annual Alpha vs Nikkei 225
P/E compression on Japanese stocks returns 5.40% annually vs 2.95% for the Nikkei 225, beating the local benchmark by 2.45% per year with 53% down-capture. The strategy works in Japan when compared against the correct local benchmark.

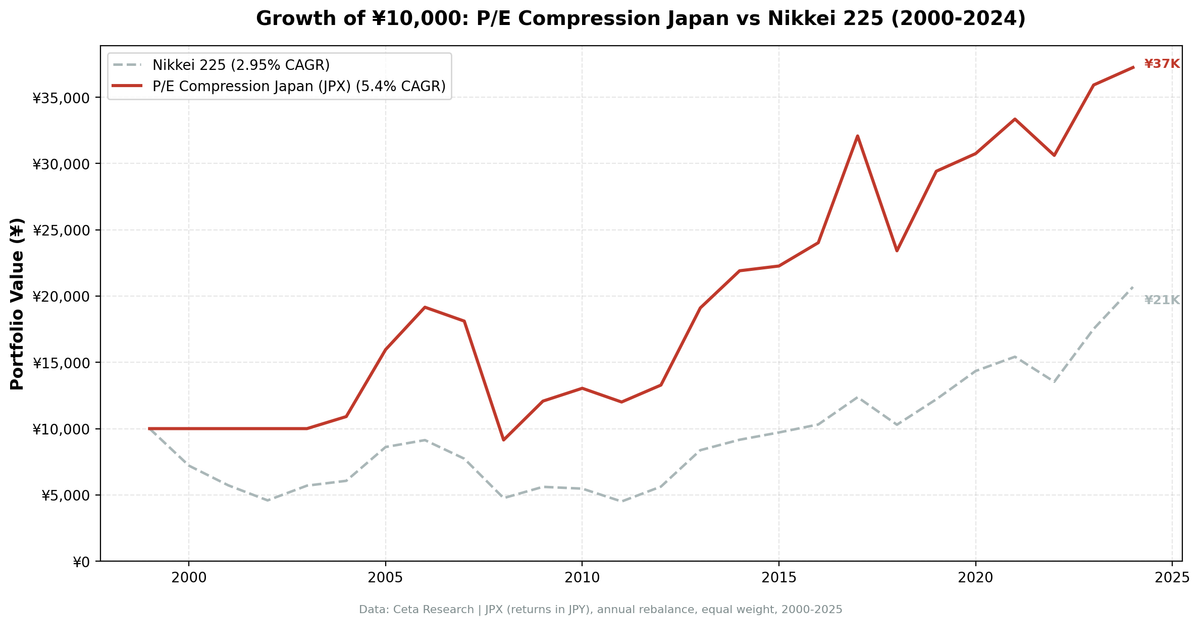
We tested P/E compression mean reversion on 25 years of Japanese stock data. The strategy returned 5.40% annually (JPY-denominated) vs 2.95% for the Nikkei 225, with 2.45% excess return. When compared to the correct local benchmark, P/E compression works in Japan. The key: Japan's equity market has been a poor benchmark. The strategy doesn't need to beat the S&P 500. It needs to beat what a Japanese investor could otherwise hold.
Contents
- Method
- What We Found
- 25 years. +2.45% annual alpha vs Nikkei 225. Consistent downside protection.
- Why P/E Compression Works in Japan (vs Local Benchmark)
- Honest Caveats
- Year-by-year returns
- 2000-2003: cash, and mostly by luck
- 2008 and 2018: where the strategy bleeds
- 2023-2024: the growth rotation challenge
- Backtest Methodology
- Limitations
- Conclusion
Data: FMP financial data warehouse, 2000-2025. Updated August 2026.
Method
Data source: Ceta Research (FMP financial data warehouse) Universe: JPX, market cap > ¥100B Period: 2000-2025 (25 years, 25 annual periods, 21 invested) Rebalancing: Annual (January), equal weight, top 30 by compression ratio Benchmark: Nikkei 225 (^N225, JPY, price index) Execution: Next-day close (mark-on-close) Cash rule: Hold cash if fewer than 10 stocks qualify and can be priced
Returns are in JPY. The Nikkei 225 is the local benchmark a Japanese investor would compare against.
What We Found
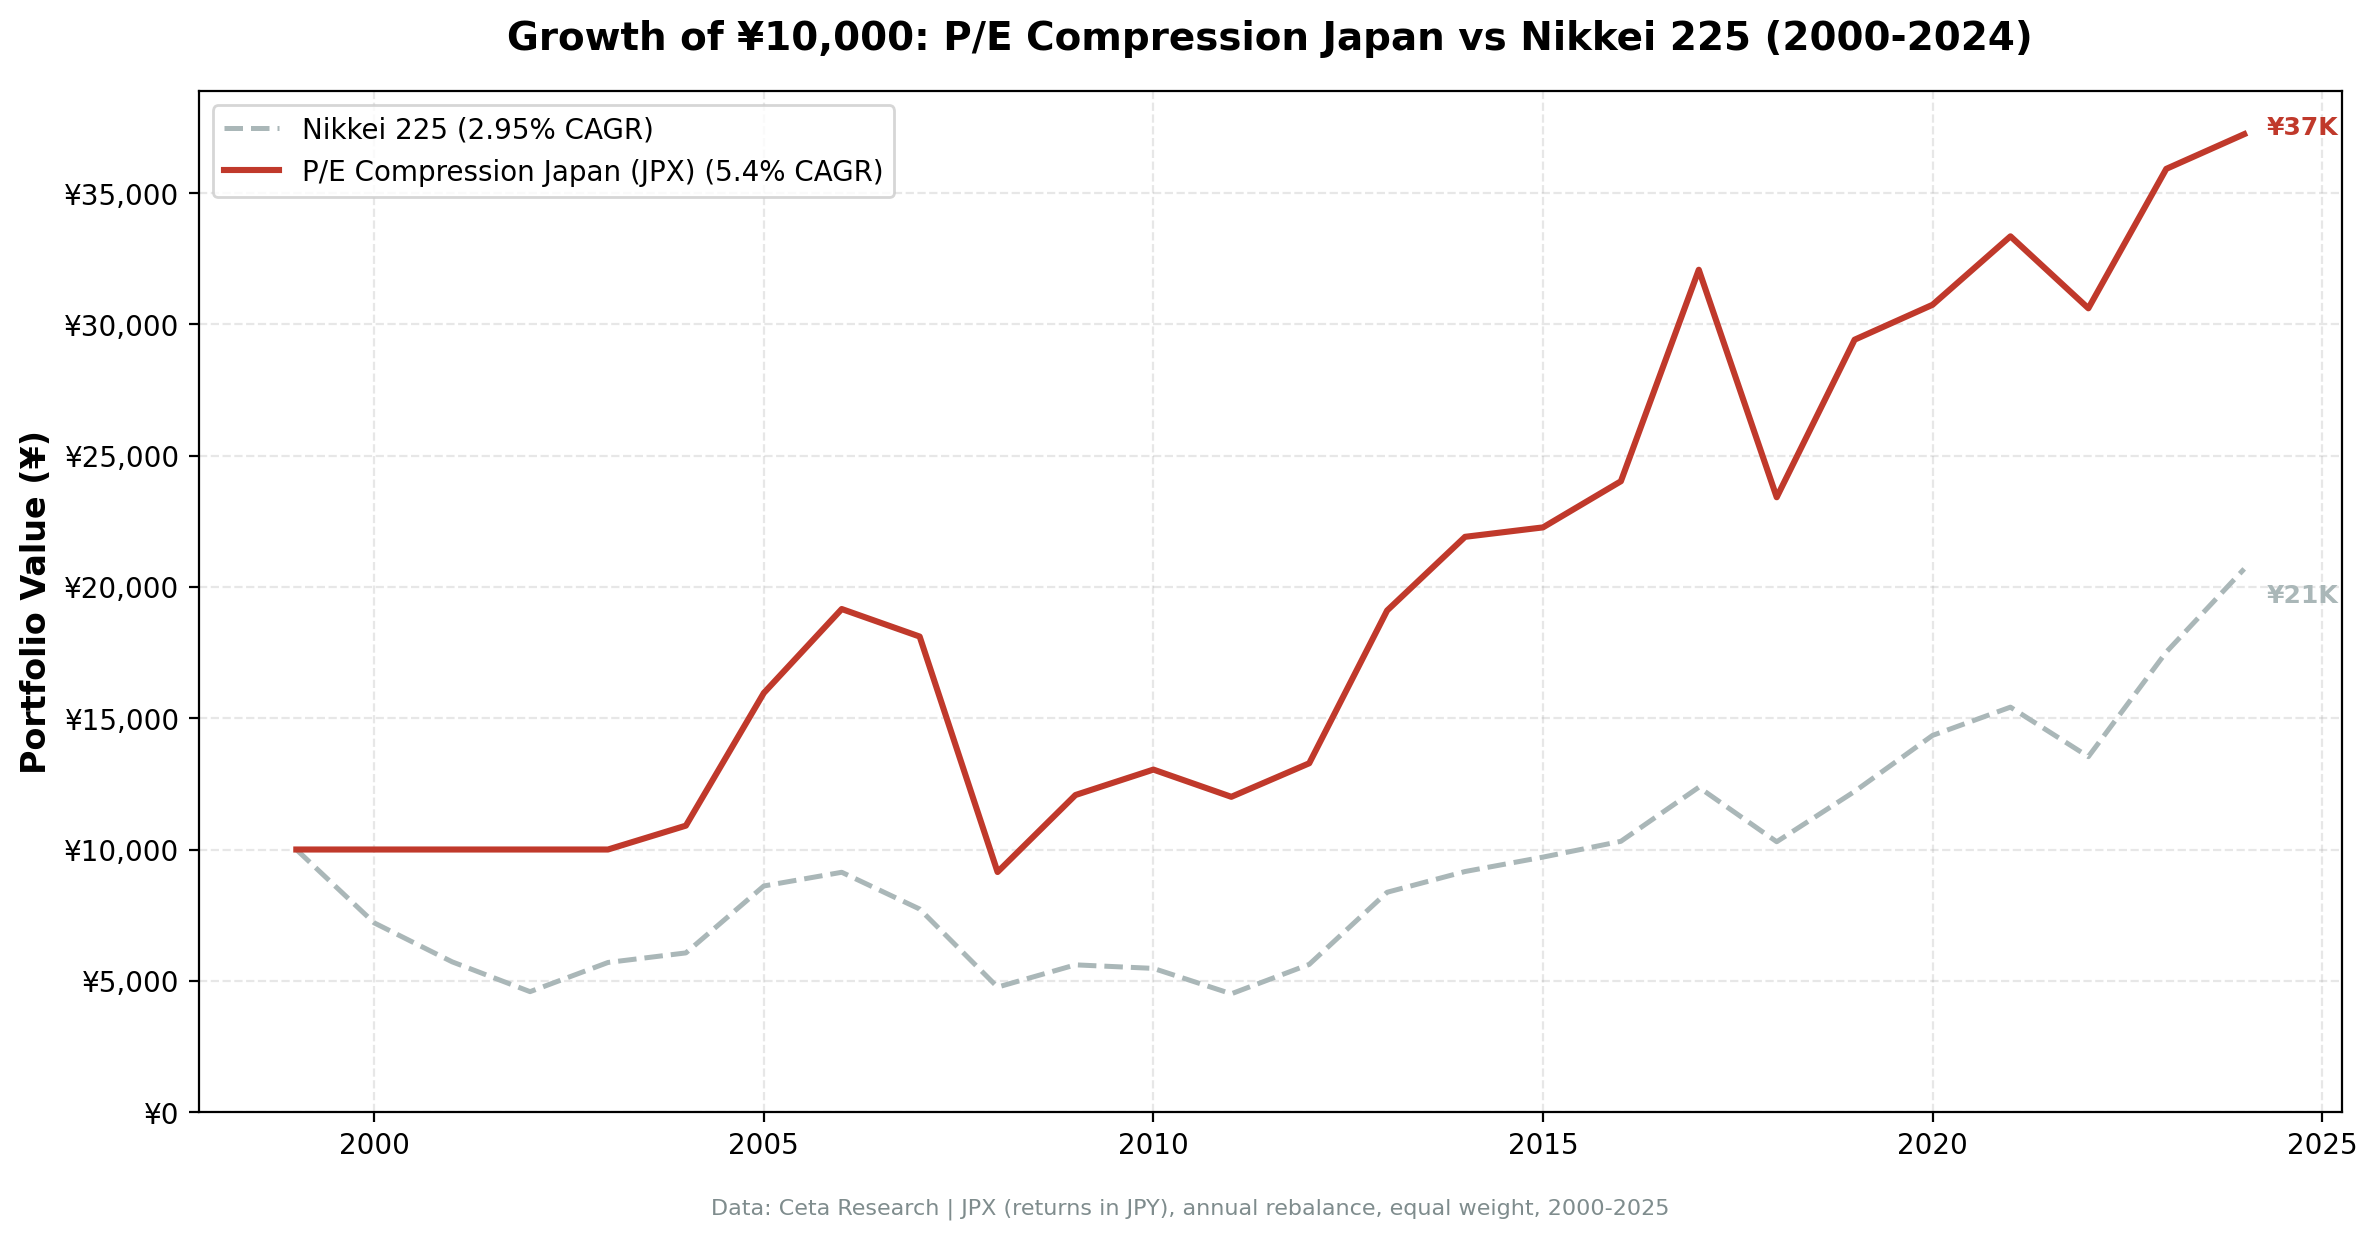
25 years. +2.45% annual alpha vs Nikkei 225. Consistent downside protection.
| Metric | P/E Compression (Japan) | Nikkei 225 |
|---|---|---|
| CAGR | 5.40% | 2.95% |
| Total Return | 272% | 107% |
| Excess CAGR | +2.45% | - |
| Sharpe Ratio | 0.258 | 0.130 |
| Sortino Ratio | 0.457 | 0.223 |
| Max Drawdown | -52.28% | -54.95% |
| Up Capture | 92.21% | 100% |
| Down Capture | 52.63% | 100% |
| Win Rate | 64% | - |
| Avg Stocks per Year | 27.2 | - |
| Cash Periods | 4 of 25 (16%) | - |
The strategy beats Japan's equity market by 2.45% annually over 25 years, and it wins in 16 of 25 years, the second-highest win rate in the 21-market study behind Canada. The 53% down-capture is the reason: when the Nikkei fell 10%, this portfolio fell 5.3% on average. That's meaningful downside protection in a market that has had severe drawdown periods.
Japan is also one of the few markets here where the strategy is invested in most periods. 21 of 25 years had at least 10 qualifying names that could actually be priced. In most of the other markets tested, thin early price coverage forces cash for a third or more of the study, which makes their numbers much harder to read.
The benchmark excludes dividends. Portfolio returns use dividend-adjusted prices, but ^N225 is the Nikkei 225 price index and does not reinvest dividends. The Nikkei has yielded roughly 1.5% to 2% a year over this period, so a like-for-like total-return comparison would reduce the +2.45% excess by approximately that much. The direction of the result holds; the margin is narrower than the headline.
The four cash periods are 2000 through 2003. Three of them helped and one hurt: the Nikkei fell 28%, 21% and 20% in 2000-2002, then rose 24% in 2003. Read them as luck rather than skill. The strategy didn't decide to sit those years out. FMP's Japanese price history doesn't reach far enough back to price 10 qualifying names before 2004, so it held cash by default.
Why P/E Compression Works in Japan (vs Local Benchmark)
The Nikkei 225 is a weak benchmark. Over 25 years, the Nikkei returned only 2.95% annually as a price index. Japan's structural deflation, corporate governance reform cycle, and low earnings growth kept the index suppressed for decades. Beating 2.95% is not a high bar.
Quality filters exclude zombie companies. Japan has many cash-rich but low-return companies. The ROE > 10% filter eliminates these. What remains are companies that are profitable but temporarily unloved by the market. These do revert.
Deflation made P/E compression more common. In a deflationary environment, P/E ratios compress frequently as earnings stagnate or grow slowly. This creates more signals, but the quality filters ensure we're selecting companies with genuine business strength.
Abenomics created mean reversion opportunities. The post-2012 period saw significant corporate governance reforms and earnings improvements. Companies that had been trading at compressed multiples relative to their own history saw multiple expansion as ROE improved. The strategy captured this.
Honest Caveats
Lower CAGR than US. 5.40% vs 10.92% in the US. Japan delivers positive alpha but the absolute return is lower. A Japanese investor faces real currency and opportunity cost trade-offs.
High max drawdown. -52.28% is severe. The 2008 crisis hit Japanese stocks hard. A portfolio that can lose half its value needs to be sized appropriately.
Currency matters for international investors. The numbers here are in JPY. For a USD-based investor, JPY/USD movements add significant uncertainty. The +2.45% alpha vs Nikkei exists in JPY terms. In USD terms, the comparison is different.
vs SPY, this strategy underperforms. The S&P 500 returned 7.64% annually over this period vs this strategy's 5.40%. Japanese equities broadly underperformed US equities. The question is whether Japanese investors should use this strategy relative to their domestic market, not whether they should prefer it over US equities.
Year-by-year returns
| Year | P/E Compression | Nikkei 225 | Excess |
|---|---|---|---|
| 2000 | cash | -27.9% | +27.9% |
| 2001 | cash | -20.6% | +20.6% |
| 2002 | cash | -19.9% | +19.9% |
| 2003 | cash | +24.2% | -24.2% |
| 2004 | +9.1% | +6.4% | +2.7% |
| 2005 | +46.3% | +42.0% | +4.3% |
| 2006 | +20.0% | +6.1% | +14.0% |
| 2007 | -5.5% | -15.3% | +9.9% |
| 2008 | -49.5% | -38.5% | -11.1% |
| 2009 | +32.1% | +17.8% | +14.2% |
| 2010 | +8.0% | -2.4% | +10.4% |
| 2011 | -8.0% | -17.7% | +9.7% |
| 2012 | +10.6% | +24.9% | -14.2% |
| 2013 | +43.8% | +48.9% | -5.0% |
| 2014 | +14.7% | +9.4% | +5.3% |
| 2015 | +1.6% | +6.0% | -4.3% |
| 2016 | +7.9% | +6.2% | +1.7% |
| 2017 | +33.5% | +20.0% | +13.6% |
| 2018 | -27.0% | -16.8% | -10.2% |
| 2019 | +25.6% | +18.6% | +7.0% |
| 2020 | +4.5% | +17.5% | -12.9% |
| 2021 | +8.5% | +7.5% | +1.0% |
| 2022 | -8.2% | -12.2% | +4.0% |
| 2023 | +17.4% | +29.4% | -12.1% |
| 2024 | +3.7% | +18.1% | -14.4% |
2000-2003: cash, and mostly by luck
The first four years have no position. The Nikkei fell 28%, 21% and 20% in 2000-2002, so holding cash beat losing about 55% cumulatively, then it rose 24% in 2003 and the strategy missed that too.
It's tempting to call the first three a structural win. They weren't a decision. Price coverage before 2004 is too thin to fill a 10-name portfolio, so the strategy was in cash regardless of what the screen said. The net effect over the four years happened to be positive. In Thailand and Switzerland, the same data gap produced the opposite result.
2008 and 2018: where the strategy bleeds
Two years showed double-digit underperformance: 2008 (-11%) and 2018 (-11%). Both were global risk-off events where Japanese quality stocks sold off harder than the Nikkei average. Forced selling doesn't discriminate by compression ratio.
2023-2024: the growth rotation challenge
The last two years showed significant underperformance as Nikkei surged on semiconductor and AI-adjacent stocks. P/E compression misses that wave by design. It selects for compressed multiples, which excludes anything trading at elevated valuations.
Backtest Methodology
Full methodology documentation: backtests/METHODOLOGY.md
| Parameter | Choice |
|---|---|
| Universe | JPX, Market Cap > ¥100B |
| Signal | Current P/E < 85% of 5-year avg, P/E 5-40, ROE > 10%, D/E < 2.0 |
| Portfolio | Top 30 by lowest compression ratio, equal weight |
| Rebalancing | Annual (January) |
| Cash rule | Hold cash if fewer than 10 qualify and can be priced |
| Execution | Next-day close (mark-on-close) |
| Benchmark | Nikkei 225 (^N225, JPY, price index) |
| Period | 2000-2025 (25 years, 21 invested) |
| Data | Point-in-time (45-day lag on FY financial statements) |
| Transaction costs | 0.1% one-way (large cap tier) |
Limitations
High absolute drawdown. -52.28% max drawdown is severe, worse than the Nikkei's own worst periods. Japanese quality stocks can still get hit hard in global crises.
Low absolute CAGR. 5.40% annually is modest. The strategy works relative to Japan, but Japan itself is not a high-growth equity market.
Cash drag, and its cause. 16% cash periods mean the portfolio misses some of the Nikkei's strong years, 2003 in particular. Those years are set by FMP's price coverage rather than by the signal, so they say nothing about whether the strategy would have worked then.
Currency risk for international investors. All returns are in JPY. USD/JPY can swing 20%+ in a year, overwhelming the 2.45% alpha.
Survivorship bias. Standard backtest limitation: exchange membership uses current profiles. Delistings over 25 years aren't fully tracked.
Conclusion
P/E compression beats Japan's local equity market by 2.45% annually over 25 years, with 53% down-capture versus the Nikkei 225 and wins in 16 of 25 years. The strategy works in Japan, but only when measured against the correct benchmark.
The key distinction: Japan's equity market has been a weak benchmark. If you compare this strategy to US equities (SPY), Japan underperforms. If you compare it to what a Japanese investor can actually hold locally, the strategy adds value.
For Japanese investors or those with JPY exposure, P/E compression provides consistent outperformance over the domestic market with meaningful downside protection. The caveats are real: high absolute drawdown, modest absolute returns, and vulnerability to growth-led market phases.
Data: Ceta Research (FMP financial data warehouse). Returns in JPY. Benchmark: Nikkei 225 price index, which does not reinvest dividends. Past performance does not guarantee future results. Not investment advice. See full methodology at github.com/ceta-research/backtests.

