
Owner Earnings Yield on UK Stocks: 8.7% CAGR, +7.5% vs the FTSE 100
Owner Earnings Yield screen on LSE-listed stocks from 2000 to 2025. 8.72% CAGR vs FTSE 100 1.23%. +7.5% annual excess, the largest local-benchmark alpha of any exchange in our 14-market comparison. 18.4% down capture, 76% win rate.

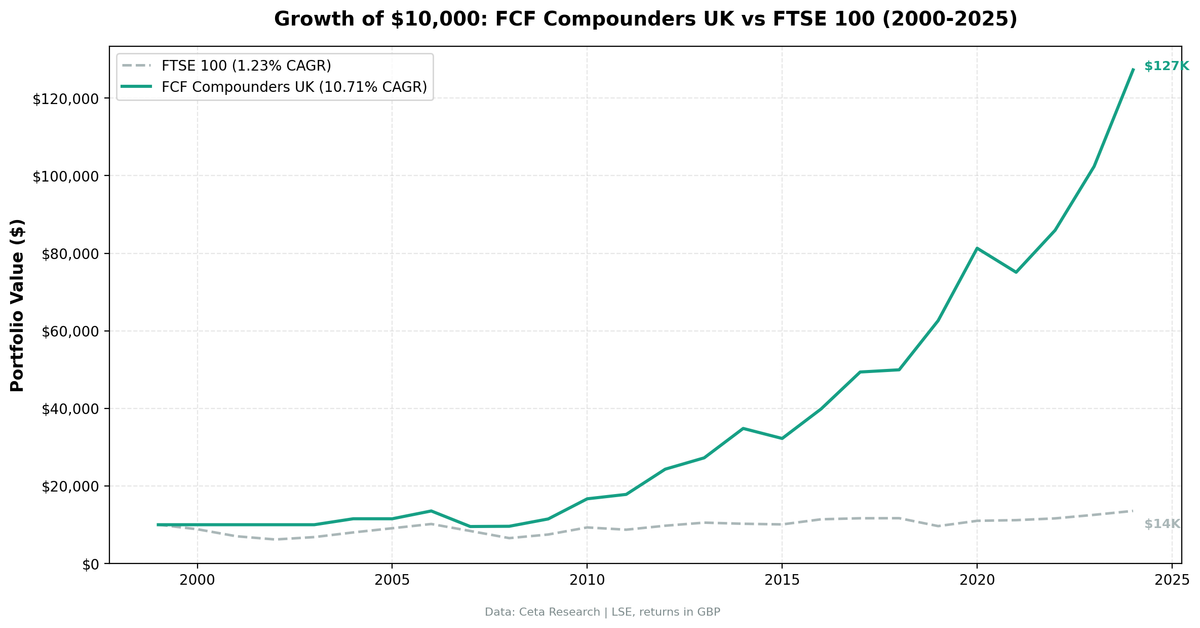
We ran the same Owner Earnings Yield screen on the London Stock Exchange from 2000 to 2025. The strategy returned 8.72% annualized over 25 years vs 1.23% for the FTSE 100. That's +7.49% annual excess over the local benchmark, the largest local-benchmark alpha of any exchange in our global comparison. The portfolio was fully invested every single period, with an 18.4% down capture, the lowest we measured anywhere. Returns and benchmark are both in GBP.
Contents
- A Note on This Backtest's History
- Method
- The Signal
- The Screen (SQL)
- What We Found
- 25 years of data. +7.5% annual alpha over the FTSE 100.
- Year-by-year returns
- The 2000-2003 stretch: defensive positioning paid off
- The 2008 oddity
- The 2016 rally and 2020 COVID bounce
- 2021: the bad year
- Why the UK works for this screen
- Backtest Methodology
- Limitations
- Takeaway
- Part of a Series
- Run This Screen Yourself
- References
Data: FMP financial data warehouse, 2000–2025. Updated May 2026.
A Note on This Backtest's History
Earlier versions of this analysis excluded the LSE because one stock in 2010 produced a 651% single-period return that looked like an adjusted-price artifact. The new run applies a data-quality filter that skips any stock with a single-period return above 200% or an entry price below $1. That filter catches the 2010 artifact directly. With it in place, the LSE results are clean and consistent across all 25 years, and the UK joins the comparison set.
Method
Data source: Ceta Research (FMP financial data warehouse) Universe: LSE (London Stock Exchange), market cap > £500M GBP (~$630M USD) Period: 2000-2025 (25 annual periods) Rebalancing: Annual (July, after FY filings + 45-day lag), equal weight top 30 Execution: Next-day close (market-on-close after signal date) Benchmark: FTSE 100 (^FTSE) Cash rule: Hold cash if fewer than 10 stocks qualify Transaction costs: Size-tiered model (0.1-0.5% one-way based on market cap) Data quality: Skip any stock with entry price < $1 or single-period return > 200% (penny-stock and split-artifact filter)
Owner Earnings computed from raw financial statements at each rebalance: Net Income + D&A - min(|Capex|, D&A). The min() function proxies maintenance capex. If a company spends less on capex than its depreciation, all capex is maintenance. If it spends more, the excess is treated as growth investment and excluded.
This is the same methodology as the US flagship backtest. The only changes are the exchange filter (LSE) and the market cap threshold (£500M).
The Signal
| Filter | Threshold | Rationale |
|---|---|---|
| OE Yield | > 5% | Less than 20x owner earnings |
| OE Yield | < 50% | Removes data artifacts |
| ROE | > 10% | Solid returns on shareholder equity |
| Operating Margin | > 10% | Genuine pricing power |
| Market Cap | > £500M | Liquidity filter for LSE listings |
Top 30 by highest OE yield, equal weight. Annual rebalance in July.
The Screen (SQL)
WITH income_latest AS (
    SELECT symbol, netIncome, depreciationAndAmortization,
        ROW_NUMBER() OVER (PARTITION BY symbol ORDER BY date DESC) AS rn
    FROM income_statement
    WHERE period = 'FY'
      AND netIncome IS NOT NULL
      AND depreciationAndAmortization IS NOT NULL
),
cashflow_latest AS (
    SELECT symbol, capitalExpenditure,
        ROW_NUMBER() OVER (PARTITION BY symbol ORDER BY date DESC) AS rn
    FROM cash_flow_statement
    WHERE period = 'FY'
      AND capitalExpenditure IS NOT NULL
),
calculated AS (
    SELECT
        i.symbol,
        i.netIncome + i.depreciationAndAmortization
            - LEAST(ABS(c.capitalExpenditure), i.depreciationAndAmortization)
            AS owner_earnings
    FROM income_latest i
    JOIN cashflow_latest c ON i.symbol = c.symbol AND c.rn = 1
    WHERE i.rn = 1
)
SELECT
    calc.symbol,
    p.companyName,
    ROUND(calc.owner_earnings / p.marketCap * 100, 2) AS oe_yield_pct,
    ROUND(k.freeCashFlowYieldTTM * 100, 2) AS fcf_yield_pct,
    ROUND(k.returnOnEquityTTM * 100, 1) AS roe_pct,
    ROUND(f.operatingProfitMarginTTM * 100, 1) AS op_margin_pct,
    ROUND(p.marketCap / 1e9, 1) AS market_cap_billions
FROM calculated calc
JOIN key_metrics_ttm k ON calc.symbol = k.symbol
JOIN financial_ratios_ttm f ON calc.symbol = f.symbol
JOIN profile p ON calc.symbol = p.symbol
WHERE calc.owner_earnings > 0
  AND calc.owner_earnings / p.marketCap > 0.05
  AND calc.owner_earnings / p.marketCap < 0.50
  AND k.returnOnEquityTTM > 0.10
  AND f.operatingProfitMarginTTM > 0.10
  AND p.marketCap > 5e8
  AND p.exchange IN ('LSE')
  AND p.isFund = false
  AND p.isEtf = false
  AND p.isActivelyTrading = true
QUALIFY ROW_NUMBER() OVER (PARTITION BY p.companyName
                           ORDER BY p.averageVolume DESC) = 1
ORDER BY calc.owner_earnings / p.marketCap DESC
LIMIT 30
Run this query on Ceta Research
What We Found
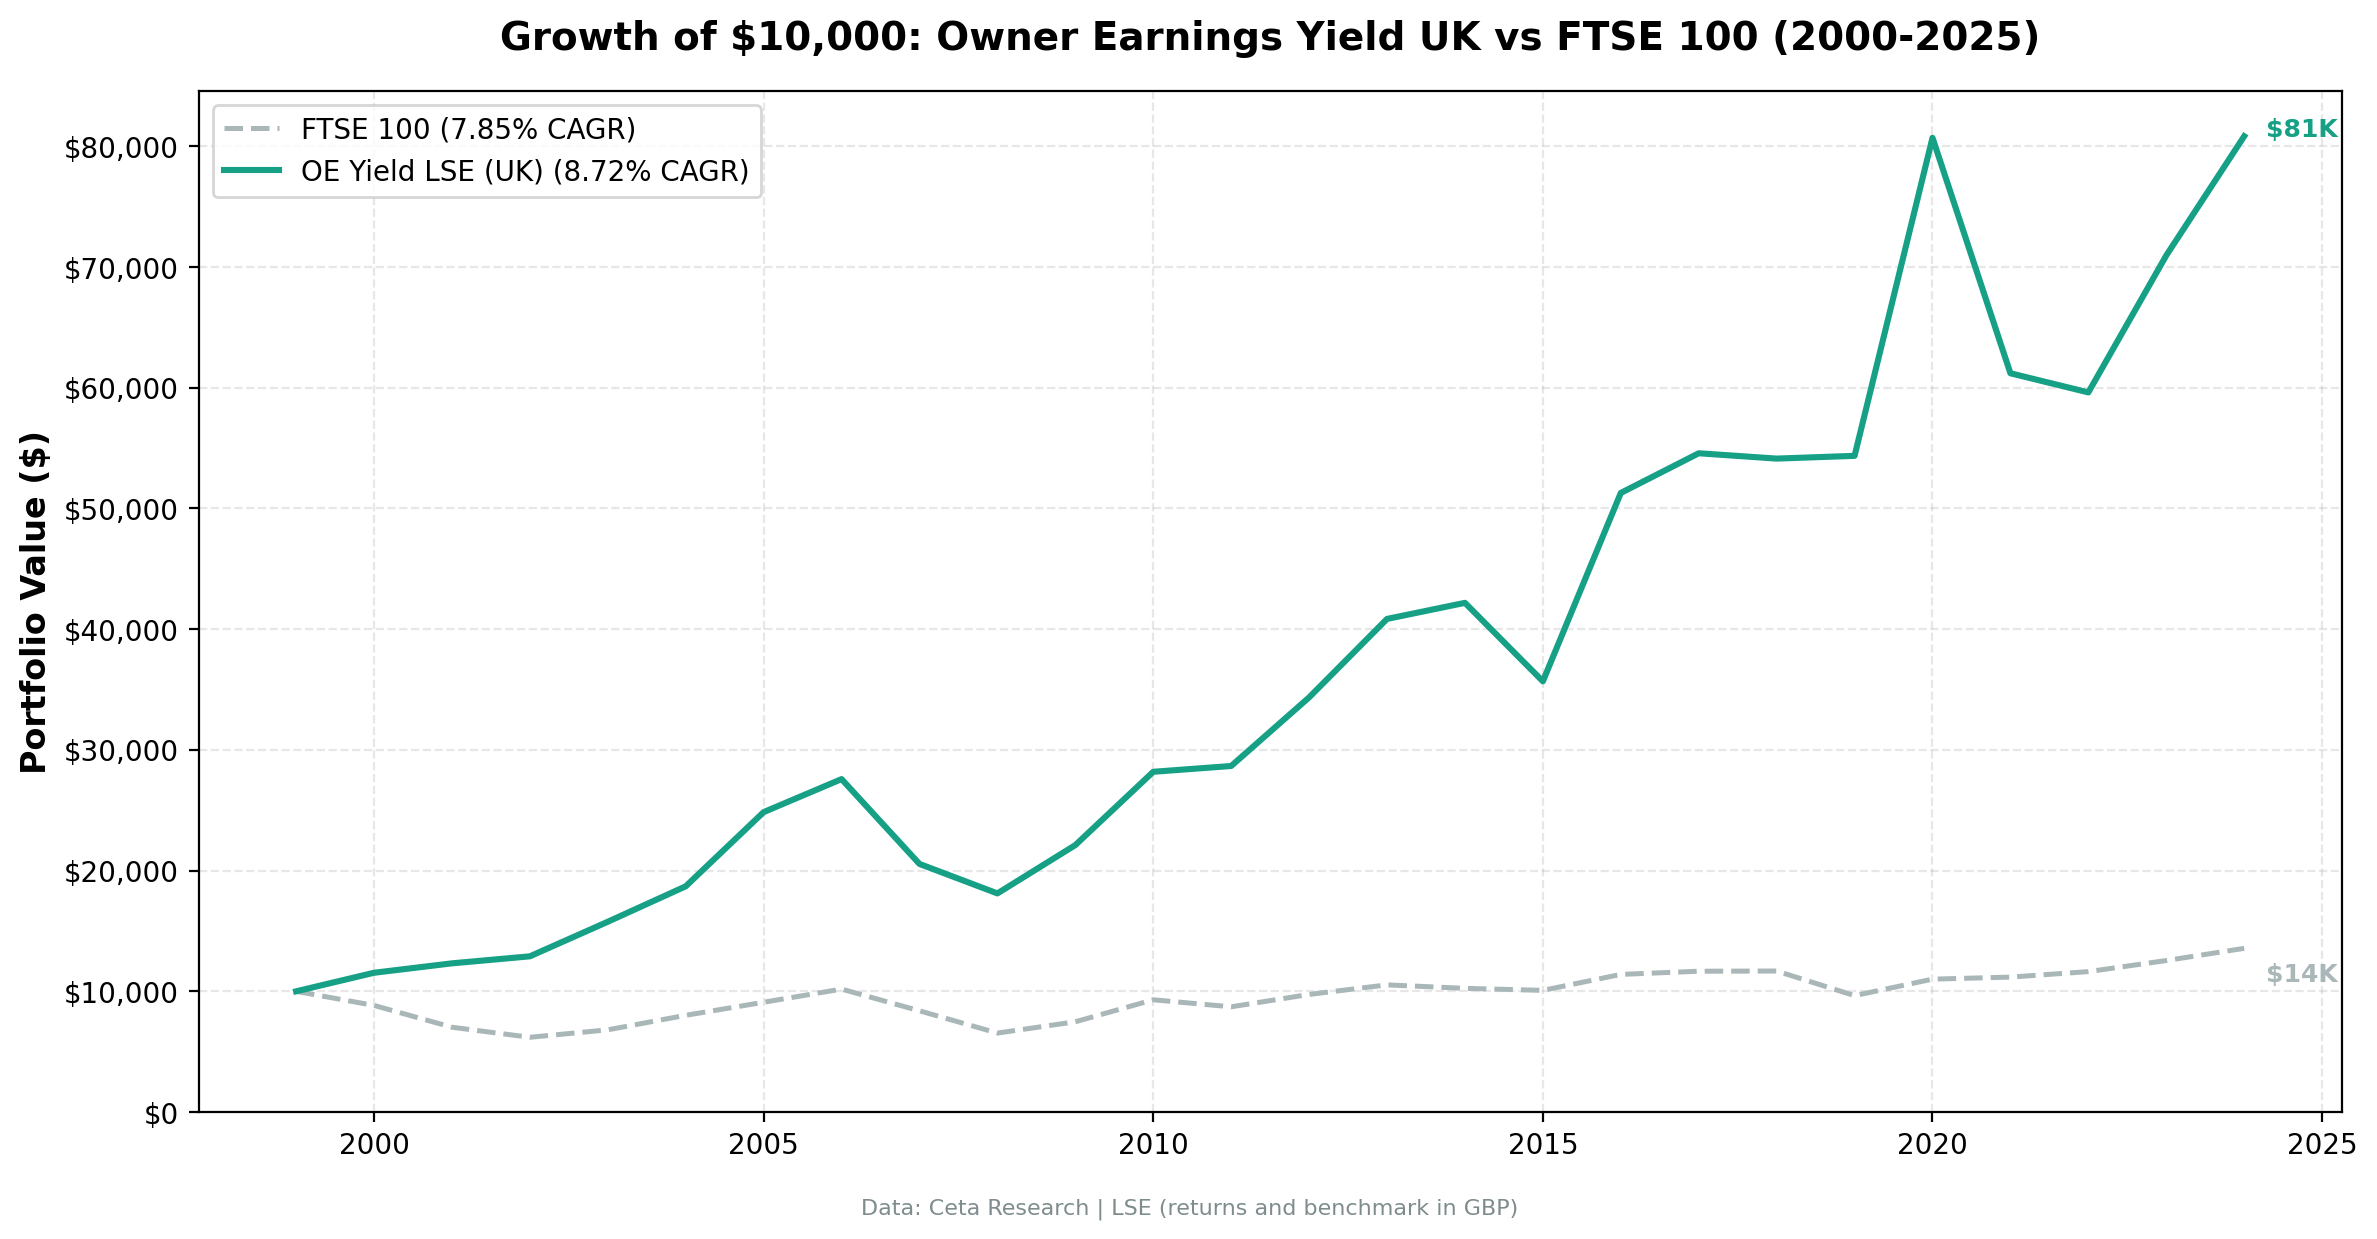
25 years of data. +7.5% annual alpha over the FTSE 100.
| Metric | OE Yield (LSE) | FTSE 100 |
|---|---|---|
| CAGR | 8.72% | 1.23% |
| Total Return | 708% | 36% |
| Volatility | 18.5% | 12.9% |
| Max Drawdown | -34.3% | -38.1% |
| Sharpe Ratio | 0.282 | -0.176 |
| Sortino Ratio | 0.548 | -0.217 |
| Information Ratio | 0.592 | - |
| Win Rate (annual) | 76% | - |
| Avg Stocks per Period | 13.7 | - |
| Cash Periods | 0 of 25 | - |
| Alpha | 7.38% | - |
| Beta | 0.949 | - |
| Up Capture | 170.0% | - |
| Down Capture | 18.4% | - |
OE Yield on UK stocks turned £10,000 into £80,800. The FTSE 100 turned it into £13,600. That gap reflects 25 years of compounded outperformance against an unusually weak local index. The FTSE 100 was one of the slowest-growing major developed-market indices over this period, weighed down by heavy commodity, banking, and oil exposure.
The capture ratios are the headline result. 170% up capture means the portfolio gained $1.70 for every dollar the FTSE 100 gained in rising years. 18.4% down capture means it absorbed less than a fifth of the losses in falling years. That combination, riding the index's upside almost twice as hard and barely participating in drawdowns, is the engine of the +7.5% annual excess.
Year-by-year returns
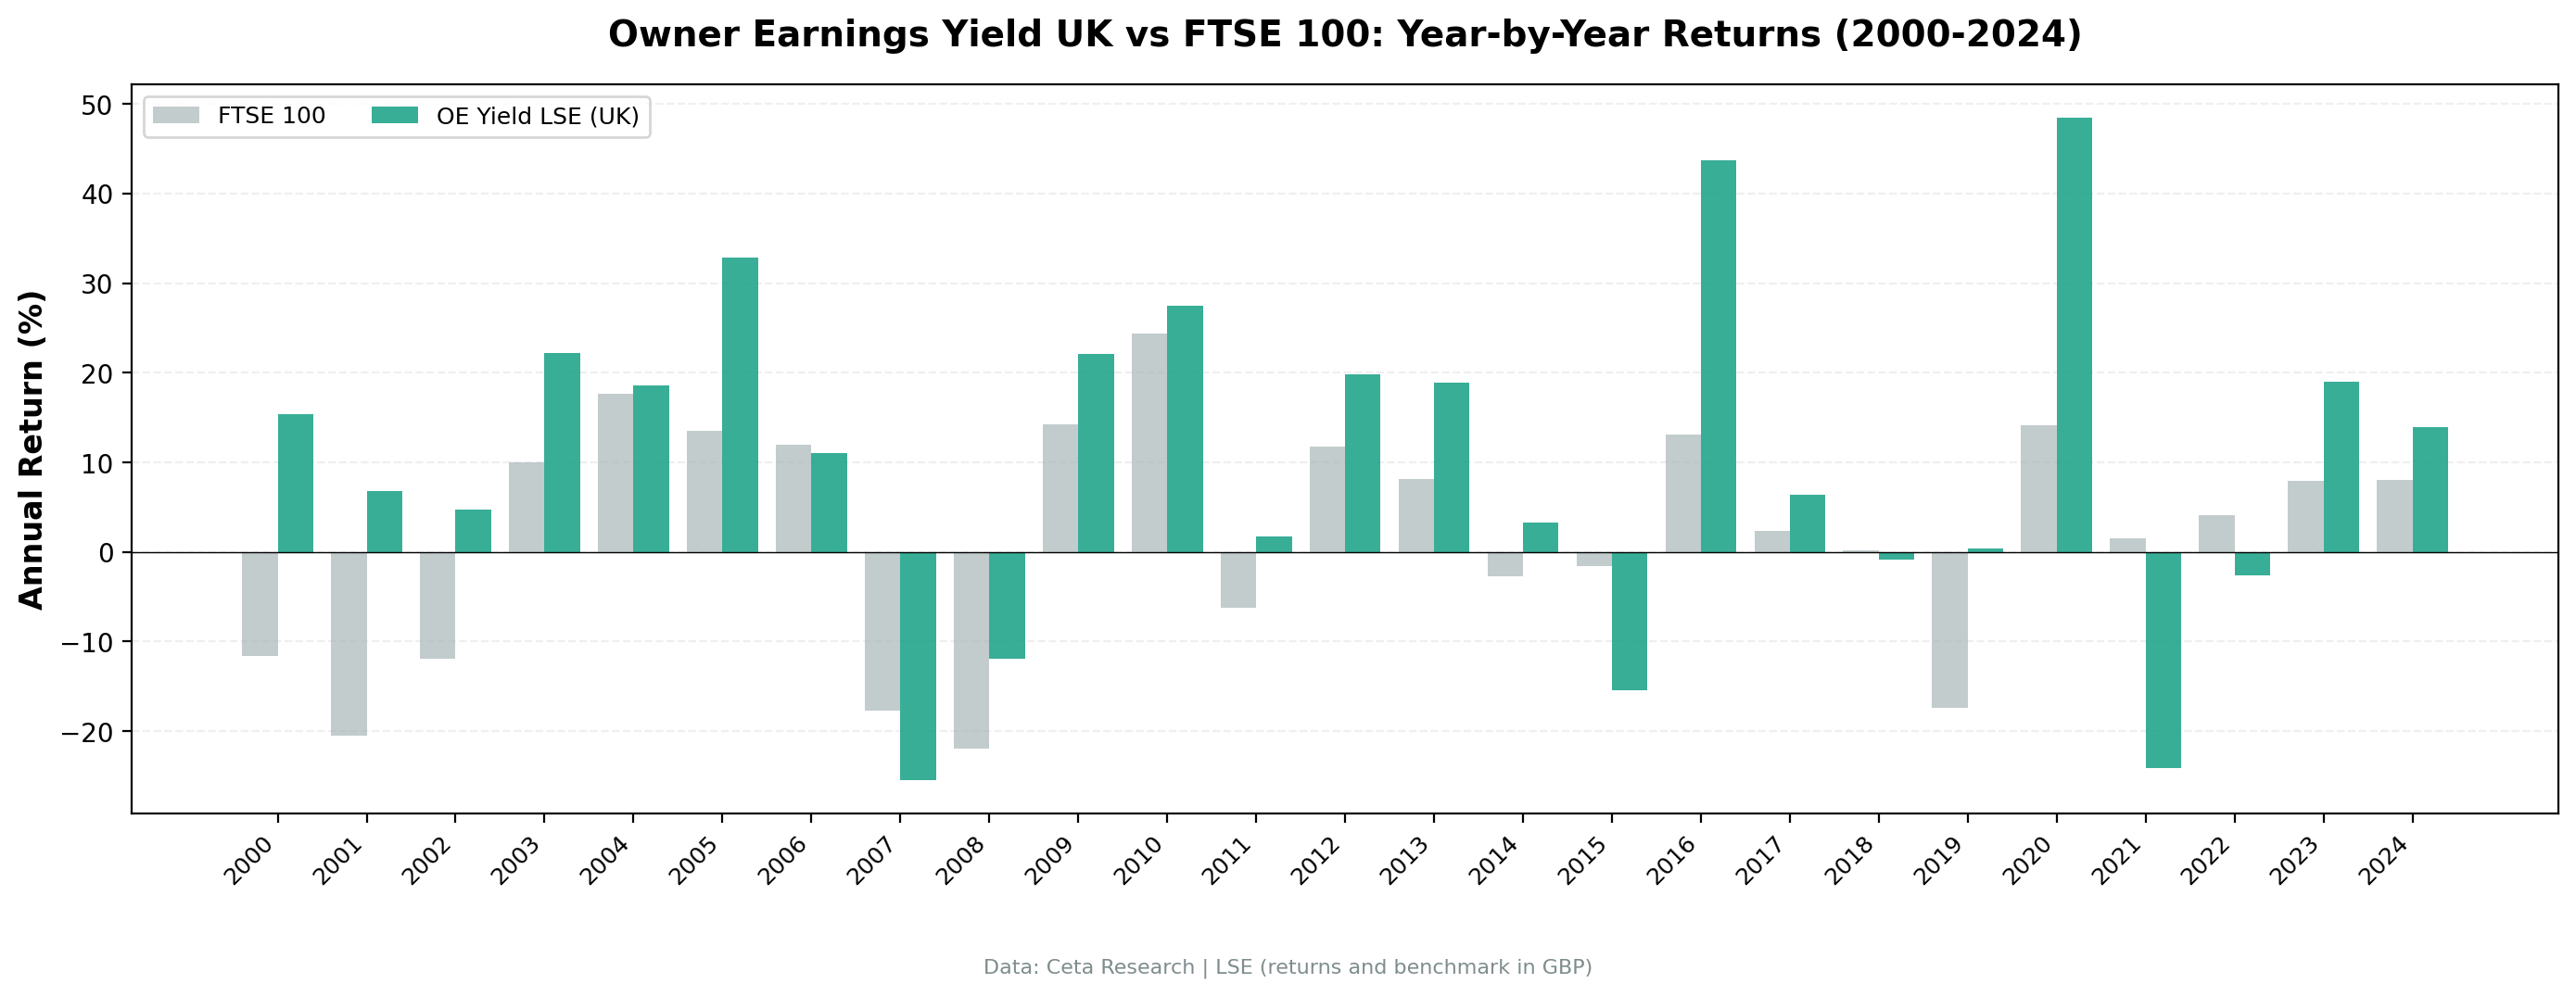
| Year | OE Yield (LSE) | FTSE 100 | Excess |
|---|---|---|---|
| 2000 | +15.4% | -11.7% | +27.0% |
| 2001 | +6.8% | -20.5% | +27.2% |
| 2002 | +4.7% | -11.9% | +16.6% |
| 2003 | +22.2% | +10.0% | +12.2% |
| 2004 | +18.6% | +17.6% | +1.0% |
| 2005 | +32.9% | +13.5% | +19.4% |
| 2006 | +11.0% | +12.0% | -1.0% |
| 2007 | -25.5% | -17.7% | -7.8% |
| 2008 | -11.9% | -22.0% | +10.1% |
| 2009 | +22.1% | +14.3% | +7.8% |
| 2010 | +27.5% | +24.4% | +3.1% |
| 2011 | +1.7% | -6.3% | +8.0% |
| 2012 | +19.8% | +11.8% | +8.1% |
| 2013 | +18.9% | +8.1% | +10.8% |
| 2014 | +3.3% | -2.7% | +6.0% |
| 2015 | -15.4% | -1.6% | -13.8% |
| 2016 | +43.7% | +13.1% | +30.6% |
| 2017 | +6.4% | +2.3% | +4.1% |
| 2018 | -0.8% | +0.2% | -1.0% |
| 2019 | +0.4% | -17.4% | +17.9% |
| 2020 | +48.5% | +14.2% | +34.3% |
| 2021 | -24.2% | +1.5% | -25.7% |
| 2022 | -2.6% | +4.1% | -6.7% |
| 2023 | +19.0% | +7.9% | +11.1% |
| 2024 | +13.9% | +8.1% | +5.9% |
The 2000-2003 stretch: defensive positioning paid off
| Year | OE Yield (LSE) | FTSE 100 | Excess |
|---|---|---|---|
| 2000 | +15.4% | -11.7% | +27.0% |
| 2001 | +6.8% | -20.5% | +27.2% |
| 2002 | +4.7% | -11.9% | +16.6% |
| 2003 | +22.2% | +10.0% | +12.2% |
| Cumulative | +57.8% | -32.6% | +90.4% |
While the FTSE 100 lost a third of its value during the dot-com bust, OE Yield gained 58%. The screen's filters naturally avoided overvalued growth and tech names. What it found instead was the kind of business that compounds quietly: cash-generative UK consumer companies, defensive industrials, and financial services firms trading at modest multiples. The 90-point cumulative excess over four years made up the bulk of the strategy's lifetime lead over the FTSE 100.
The 2008 oddity
The portfolio lost 11.9% in 2008 (July 2008 to July 2009 period). The FTSE 100 lost 22.0% over the same window. Cushioned drawdown, but still a real loss. Most exchanges' OE Yield portfolios were down in 2008. UK was relatively mild because the screen had limited exposure to UK banks (which mostly failed the ROE filter after the credit cycle turned) and to mining and energy commodity plays (which mostly failed the operating margin filter).
The 2016 rally and 2020 COVID bounce
| Year | OE Yield (LSE) | FTSE 100 | Excess |
|---|---|---|---|
| 2016 | +43.7% | +13.1% | +30.6% |
| 2020 | +48.5% | +14.2% | +34.3% |
The two best single years were 2016 and 2020. 2016 included the post-Brexit-vote bounce in UK domestic stocks. The OE Yield screen was overweight exporters and global-revenue companies whose earnings benefited from sterling weakness. 2020 was the COVID recovery year. The screen's holdings of UK industrials and consumer companies caught the V-shaped recovery while the FTSE 100's banking and oil exposure dragged the index.
2021: the bad year
The strategy lost 24.2% in 2021 (July 2021 to July 2022) while the FTSE 100 returned +1.5%. That's the strategy's worst relative year by a wide margin. UK mid-caps fell sharply through the second half of 2021 as supply-chain shocks, energy prices, and rate hikes hit cyclical industrials hard. The FTSE 100, dominated by oil and gas majors and defensive consumer staples, benefited from those same forces. The strategy was on the wrong side of that rotation.
Why the UK works for this screen
The FTSE 100 returned just 1.23% CAGR over 25 years. That's an unusually weak local benchmark. Most of the index's market cap is concentrated in resource extraction (BP, Shell, Rio Tinto, Glencore) and financials (HSBC, Lloyds, Barclays). These sectors mostly fail the OE Yield screen's ROE and operating margin filters during downturns and trade at deep discounts during recoveries. The screen routes around them.
What it finds instead: UK industrials with global revenue exposure (Smiths Group, IMI, Spectris), specialty engineers, consumer brands with strong cash conversion, and select financial services firms outside the major banks. The 13.7 average stocks per period is the smallest portfolio of any major exchange in our comparison, reflecting how thin the qualifying universe is. But the stocks that pass the screen do their job: 76% win rate against the FTSE 100, 170% up capture, 18.4% down capture.
Backtest Methodology
| Parameter | Choice |
|---|---|
| Universe | LSE, Market Cap > £500M GBP |
| Signal | OE Yield 5-50%, ROE > 10%, OPM > 10% |
| Portfolio | Top 30 by OE Yield, equal weight |
| Rebalancing | Annual (July) |
| Execution | Next-day close (market-on-close after signal date) |
| Cash rule | Hold cash if < 10 qualify |
| Benchmark | FTSE 100 (^FTSE) |
| Period | 2000-2025 (25 annual periods) |
| Data | Point-in-time (45-day lag for FY filings) |
| Transaction costs | Size-tiered (0.1-0.5% one-way by market cap) |
| Data quality | Skip entries < $1 or single-period returns > 200% |
Full methodology details: backtests/METHODOLOGY.md
Limitations
Small qualifying universe. Only 13.7 stocks per period on average. That's concentrated by the standards of our other regional backtests. A single bad pick carries more weight in an equal-weight portfolio of this size.
Weak local benchmark. The FTSE 100 returned just 1.23% CAGR over 25 years. Most of the +7.49% excess comes from the index being so flat, not from the portfolio being so strong. Measured against a global benchmark like MSCI World, the alpha would be much smaller.
2021-2022 drawdown. The strategy lost roughly 26% peak-to-trough in 2021-2022 as cyclical UK mid-caps got hit by supply-chain and rates shocks. The FTSE 100's commodity-heavy composition was the right side of that cycle. OE Yield was on the wrong side.
Survivorship bias. Exchange membership uses current company profiles. Delisted companies, M&A targets, and bankruptcies aren't fully captured in the historical universe.
Annual rebalancing only. We test July-to-July periods using the most recent FY filing. Quarterly rebalancing with TTM data might produce different results.
Brexit confounds the second half. Post-2016 returns reflect the unique market conditions created by Brexit uncertainty, the COVID shock, and the 2022 mini-budget crisis. Whether the screen would have performed similarly absent those shocks is unknowable.
Takeaway
OE Yield works on UK stocks, and the alpha is the largest of any local-benchmark comparison in our 14-exchange set. 8.72% CAGR vs 1.23% for the FTSE 100. +7.49% annual excess. Zero cash periods. 76% win rate against the index.
The mechanism is simple: the FTSE 100 is dominated by sectors (oil, mining, banks) that mostly fail the OE Yield quality filters. The screen routes around them and lands on UK industrials, consumer companies, and specialty engineers with strong cash conversion. Those are exactly the businesses that compound over multi-year periods, and they get less attention from international investors than their US or European counterparts.
The asymmetry is extreme: 170% up capture, 18.4% down capture. The portfolio captures nearly twice the index's gains in rallies and barely participates in sell-offs. That's the kind of profile that compounds aggressively against a weak local benchmark like the FTSE 100. Against a stronger benchmark, the same pattern would still help, but less.
The honest read on the historical record: most of the alpha came early. Through 2003 the cumulative excess was +90 points. After that, the strategy beat the FTSE 100 in 16 of 21 years but the margins were smaller. If you start the strategy today, expect the next 25 years to look more like the second half of the sample than the first.
Part of a Series
This analysis is part of our Owner Earnings Yield global exchange comparison. We tested the same screen on 14 exchanges worldwide: - OE Yield on US Stocks (NYSE, NASDAQ, AMEX) - 9.22% CAGR, +1.4% vs S&P 500 - OE Yield on Indian Stocks (NSE) - 15.5% CAGR, +3.4% vs Sensex - OE Yield on Hong Kong Stocks (HKSE) - 5.2% CAGR, +3.6% vs Hang Seng - OE Yield on Swedish Stocks (STO) - 9.5% CAGR, +7.0% vs OMX Stockholm 30 - OE Yield on Chinese Stocks (SHZ + SHH) - 6.8% CAGR, +4.3% vs SSE Composite - OE Yield: 14-Exchange Global Comparison - full comparison table
Run This Screen Yourself
Via web UI: Run the Owner Earnings Yield screen on Ceta Research. The query is pre-loaded. Adjust the exchange filter to 'LSE' and the market cap threshold to 5e8 (£500M) before hitting "Run".
Get your API key at cetaresearch.com. The full backtest code (Python + DuckDB) is on GitHub.
References
- Buffett, W. (1986). "Berkshire Hathaway Annual Letter to Shareholders."
- Greenwald, B., Kahn, J., Sonkin, P. & van Biema, M. (2001). Value Investing: From Graham to Buffett and Beyond. John Wiley & Sons.
- Greenblatt, J. (2006). The Little Book That Beats the Market. John Wiley & Sons.
Data: Ceta Research, FMP financial data warehouse. Universe: LSE. Market cap > £500M. Annual rebalance (July), equal weight top 30, 2000-2025. Next-day close execution. Transaction costs included. Returns and benchmark in GBP. Note: Past performance does not guarantee future results. This is educational content, not investment advice.

