
Oversold Quality US: When Quality Companies Go Technically Oversold (2000-2025)
We combined Piotroski quality scores with RSI oversold signals and tested it on 25 years of US market data. The strategy matches SPY over the full period, with most of the work done by a handful of crash and recovery years.

title: "Oversold Quality US: When Quality Companies Go Technically Oversold (2000-2025)" slug: oversold-quality-us-backtest publish_date: 2026-01-24 tags: [backtests, us-markets, quality-investing, technical-analysis, RSI] post_access: public excerpt: "We combined Piotroski quality scores with RSI oversold signals and tested it on 25 years of US market data. The strategy matches SPY over the full period, with most of the work done by a handful of crash and recovery years." authors: [Swas] feature_image: 1_us_cumulative_growth.png feature_image_alt: "Growth of $10,000: Oversold Quality US vs S&P 500 (2000-2025)" meta_title: "Oversold Quality US Backtest: Piotroski + RSI-14 < 30 (2000-2025)" meta_description: "25-year backtest of Piotroski F-Score >= 7 with RSI-14 < 30 on US stocks. 8.17% CAGR vs 8.02% for SPY, with strong crash-year alpha. Full methodology and SQL included." canonical_url: https://blog.tradingstudio.finance/oversold-quality-us-backtest og_title: "Oversold Quality US: 25 Years of Data on Buying Oversold Quality Stocks" og_description: "Quality filter (Piotroski>=7) + oversold signal (RSI<30) on US stocks: 8.17% CAGR vs 8.02% SPY. It matches the index, but the path is all crash-year alpha and mega-cap-bull drag." twitter_title: "Oversold Quality US Backtest: Does RSI+Piotroski Work?" twitter_description: "25 years of data on buying quality US stocks when they're technically oversold. 8.17% CAGR vs 8.02% SPY. The crash-year story is the whole story."
Contents
Data: FMP financial data warehouse, 2000–2025. Updated March 2026.
The idea sounds reasonable: buy fundamentally strong companies when they've been beaten down technically. Use Piotroski's nine-factor accounting quality score to filter for financial strength, then wait for RSI-14 to drop below 30 before buying. We ran this combination on 25 years of US market data. The strategy matches SPY over the full period, 8.17% a year against 8.02%, but the path it takes to get there is the part worth understanding.
The Strategy
The signal has two parts that must both be true at a quarterly rebalance date.
Piotroski F-Score >= 7 (out of 9): The Piotroski score, introduced by Joseph Piotroski in a 2000 paper on using historical financial statement data to separate winners from losers, checks nine binary conditions across three areas:
- Profitability (4 signals): Return on assets > 0, ROA improving year-over-year, operating cash flow > 0, accruals negative (cash earnings exceed reported earnings)
- Leverage and liquidity (3 signals): Debt-to-assets ratio falling, current ratio improving, no new share issuance in the past year
- Operating efficiency (2 signals): Gross margin improving, asset turnover improving
Each condition scores 0 or 1. A score of 7+ means the company passes at least seven of nine tests, indicating broad-based financial improvement.
RSI-14 < 30: The Relative Strength Index, developed by J. Welles Wilder in 1978, measures the magnitude of recent price changes on a 0-100 scale. An RSI below 30 is conventionally considered "oversold," meaning the stock has fallen faster than typical over the past 14 trading periods. The hypothesis: the market has overreacted, and a quality company at RSI < 30 is temporarily mispriced.
The strategy then buys the top 30 qualifying stocks by lowest RSI, equally weighted, and holds until the next quarterly rebalance.
Methodology
- Universe: NYSE, NASDAQ, and AMEX (full exchange, not index-constrained)
- Market cap filter: $1B+ USD at each rebalance date
- Rebalancing: Quarterly (January, April, July, October rebalance dates)
- Execution: Signals are computed at each rebalance date and filled at the next trading day's close, so no position uses a price the signal itself couldn't have seen.
- Portfolio size: Up to 30 stocks, equal weight. Holds cash if fewer than 5 stocks qualify.
- RSI lookback: 14 trading periods, computed from daily price data
- Transaction costs: Size-tiered model based on market cap at time of trade
- Data period: January 2000 through December 2025 (25.8 years, 103 quarterly periods)
- Benchmark: SPY (S&P 500 ETF)
- Data source: Ceta Research FMP financial data warehouse
Full methodology, including the exact mathematical definitions of all metrics, is at backtests/METHODOLOGY.md.
Results
| Metric | Oversold Quality | SPY |
|---|---|---|
| CAGR | 8.17% | 8.02% |
| Total return (25.8yr) | 655.2% | 628.3% |
| Max drawdown | -42.1% | -43.9% |
| Sharpe ratio | 0.279 | 0.361 |
| Sortino ratio | 0.442 | — |
| Volatility (annualized) | 22.14% | 16.68% |
| Up capture vs SPY | 105.5% | — |
| Down capture vs SPY | 98.3% | — |
| Win rate vs SPY | 47.6% | — |
| Beta | 1.008 | — |
| Alpha | +0.11% | — |
| Cash periods | 5 of 103 quarters | — |
| Avg stocks (when invested) | 22.7 | — |
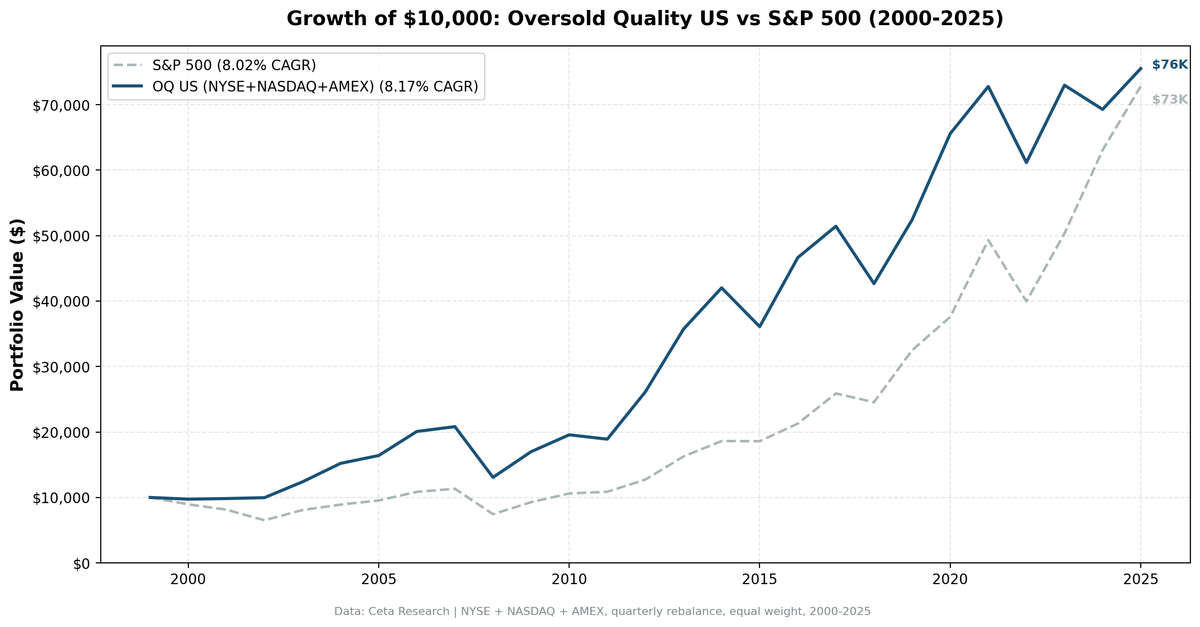
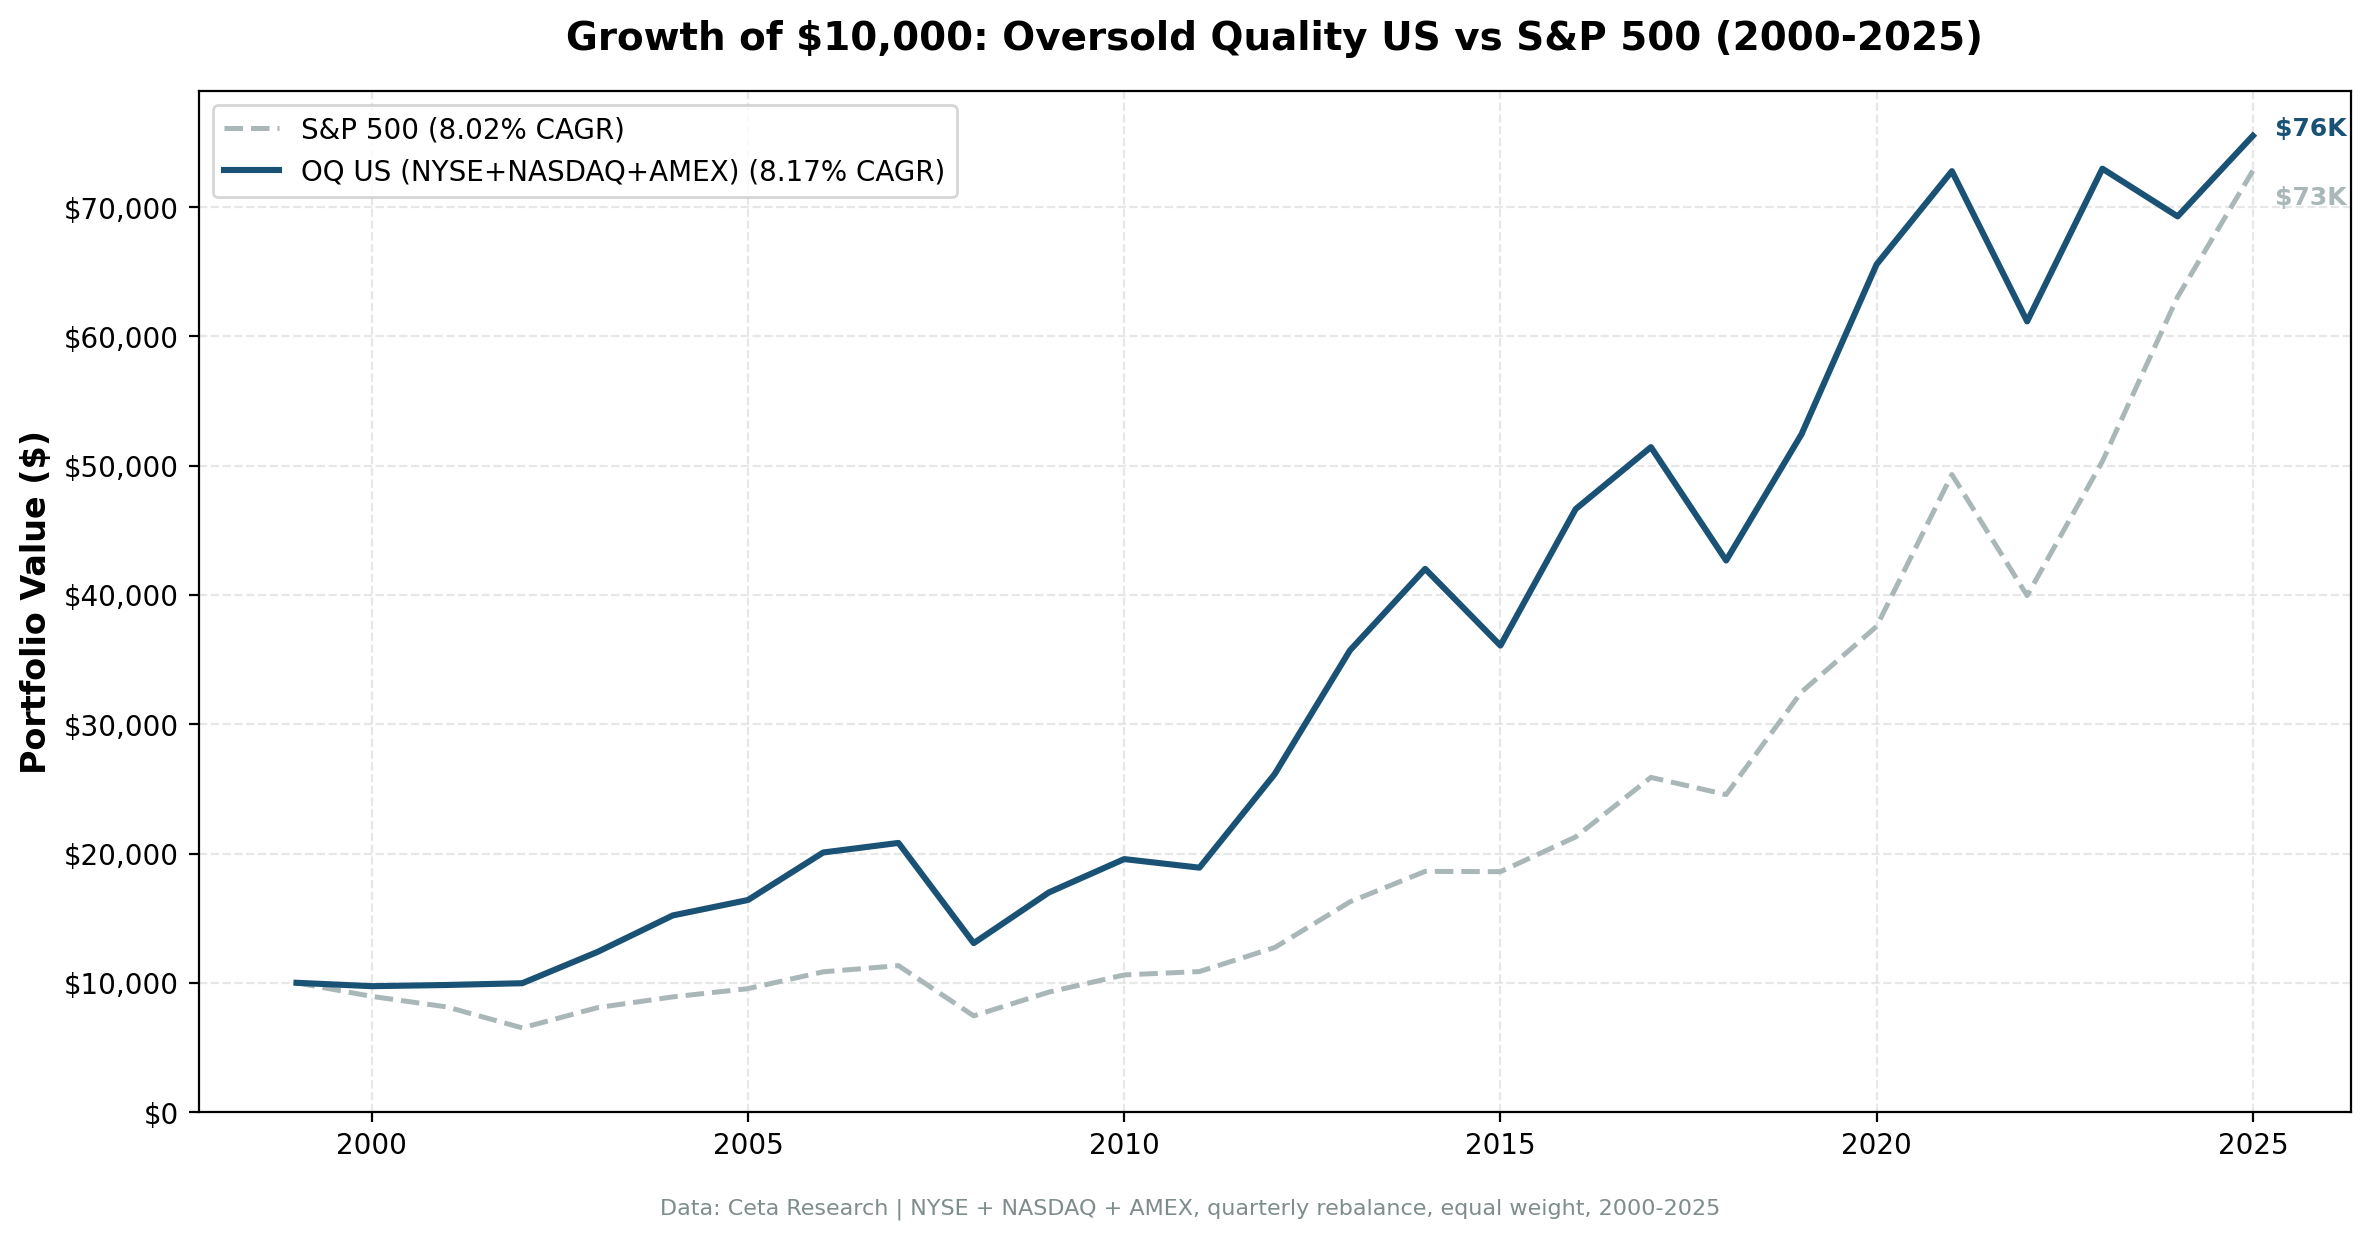
A $10,000 investment in January 2000 grew to roughly $75,500 by end of 2025 under this strategy. The same investment in SPY grew to roughly $72,800. The two finish within a few percent of each other after 25 years.
The honest read is that the strategy matched a strong index without beating it on a risk-adjusted basis. Volatility was higher (22.1% vs 16.7%), so SPY's Sharpe of 0.361 stays ahead of the strategy's 0.279 even though the raw returns are almost identical. What the strategy bought you was not higher returns. It was a different return path: more participation in selloffs and recoveries, less participation in narrow momentum-driven rallies.
The up-capture of 105.5% and down-capture of 98.3% say the same thing. The portfolio caught slightly more than all of SPY's up moves and slightly less than all of its down moves, on average. That is a reasonable profile, and it is a large improvement over what a naive version of this backtest shows. An earlier run of ours reported the strategy underperforming SPY by nearly 3% a year. Most of that gap turned out to be phantom price spikes in the raw data (single-day adjusted-close values that jumped several-fold and reverted a day later), which distorted a handful of quarterly entry prices. Filtering those artifacts and filling at next-day closes is what moved the result from apparent underperformance to parity.
Annual returns:
| Year | Portfolio | SPY | Excess |
|---|---|---|---|
| 2000 | -2.62% | -10.50% | +7.88% |
| 2001 | +0.94% | -9.17% | +10.11% |
| 2002 | +1.40% | -19.92% | +21.32% |
| 2003 | +24.27% | +24.12% | +0.15% |
| 2004 | +22.79% | +10.24% | +12.55% |
| 2005 | +7.86% | +7.17% | +0.69% |
| 2006 | +22.40% | +13.65% | +8.75% |
| 2007 | +3.69% | +4.40% | -0.71% |
| 2008 | -37.24% | -34.31% | -2.93% |
| 2009 | +30.05% | +24.73% | +5.32% |
| 2010 | +15.16% | +14.31% | +0.85% |
| 2011 | -3.39% | +2.46% | -5.85% |
| 2012 | +38.30% | +17.09% | +21.21% |
| 2013 | +36.59% | +27.77% | +8.82% |
| 2014 | +17.66% | +14.50% | +3.16% |
| 2015 | -14.11% | -0.12% | -13.99% |
| 2016 | +29.25% | +14.45% | +14.80% |
| 2017 | +10.27% | +21.64% | -11.37% |
| 2018 | -17.05% | -5.15% | -11.90% |
| 2019 | +22.85% | +32.31% | -9.46% |
| 2020 | +25.11% | +15.64% | +9.47% |
| 2021 | +10.99% | +31.26% | -20.27% |
| 2022 | -15.97% | -18.99% | +3.02% |
| 2023 | +19.32% | +26.00% | -6.68% |
| 2024 | -5.06% | +25.28% | -30.34% |
| 2025 | +9.00% | +15.47% | -6.47% |
When It Works
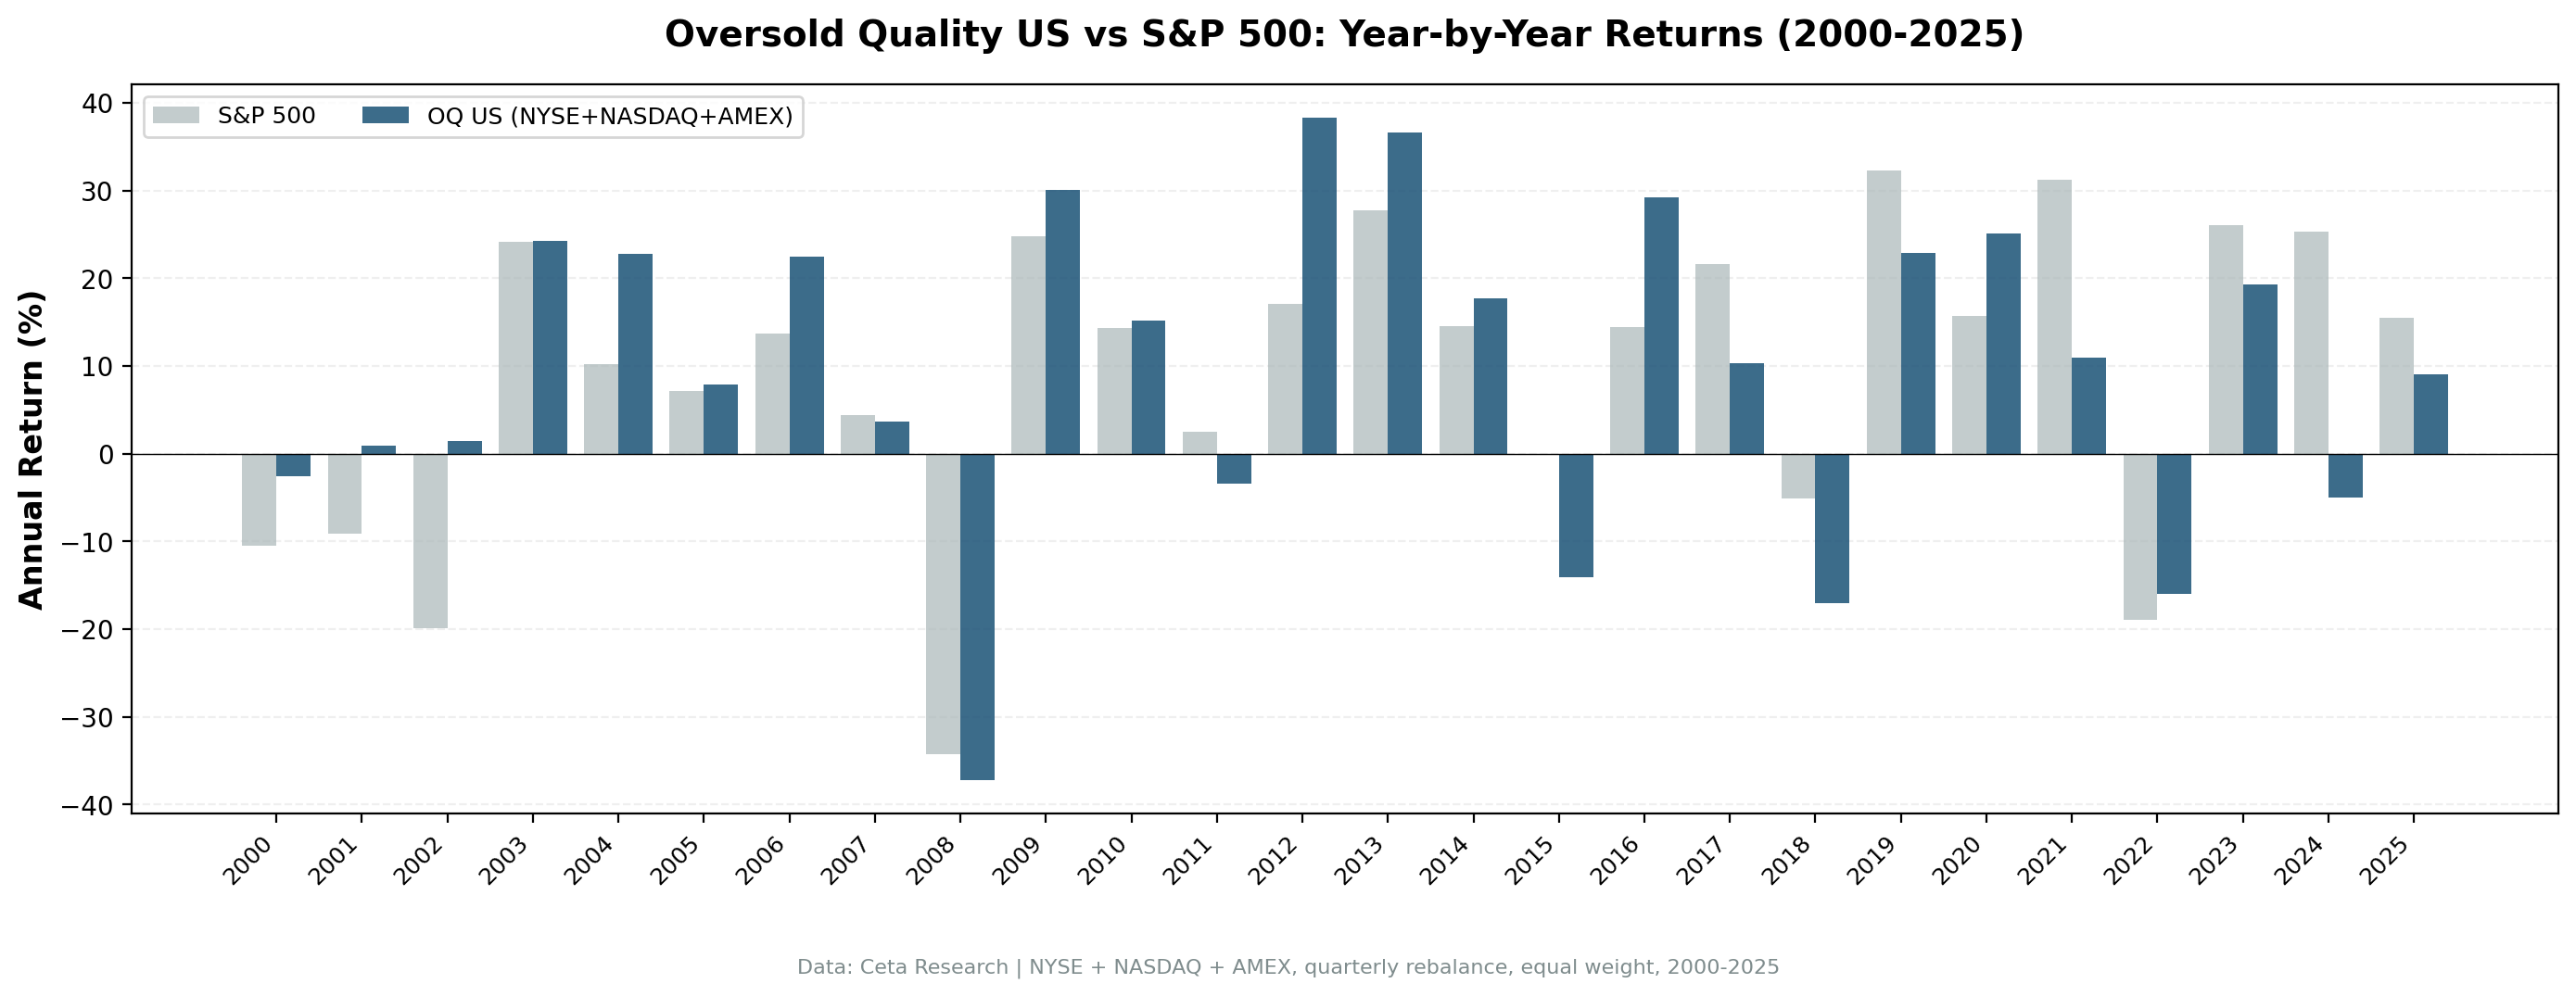
Broad selloffs. The three best years relative to SPY were 2002 (+21.32%), 2012 (+21.21%), and 2016 (+14.80%). The strategy outperformed by roughly 39 percentage points cumulative during the 2000-2002 dotcom crash. The signal was working as designed: quality companies that had genuinely been sold off were bouncing back while the broader market, full of money-losing tech stocks, kept falling.
Recovery years. 2004 (+12.55% excess), 2009 (+5.32%), 2013 (+8.82%), and 2020 (+9.47%) were all years where beaten-down quality names rebounded hard off a prior stress period. When the market rotates from fear back to fundamentals, oversold quality stocks tend to lead.
Moderate bull markets. In years where SPY returned 10-15%, the strategy generally beat it. 2006 (+8.75%) and 2010 (+0.85%) are examples. The RSI < 30 filter still found enough genuinely oversold quality names to stay invested and ahead.
When It Struggles
Narrow mega-cap bull markets. The 2024 result is the clearest example: -5.06% vs +25.28% SPY, a 30.34% excess loss. That year, SPY returns were driven by a handful of AI-related mega-cap stocks, none of which were ever technically oversold. A quality screen that required RSI < 30 missed the entire rally. 2021 (+10.99% vs +31.26%) had the same shape: the index ran on a small set of high-momentum names while the strategy held the rest of the market.
Late-cycle momentum years. 2017 (-11.37%) and 2019 (-9.46%) were strong, low-volatility bull years where quality stocks rarely dipped to RSI < 30. The portfolio invested in whatever did, and those names lagged the index.
Quality stocks that stay oversold for a reason. RSI < 30 on a Piotroski >= 7 stock can still mean the market knows something the accounting screen doesn't. A company with good historical financials can still face deteriorating fundamentals that haven't yet shown up in the annual statements. 2018 (-11.90%) and 2015 (-13.99%) caught some of those.
The drag is concentrated, not constant. This is the key change from how this strategy is often described. The full-period result is parity, and the underperformance is not spread evenly. It lives almost entirely in a few narrow-breadth bull years (2024, 2021, 2017-2019). In every broad selloff and recovery in the sample, the strategy was ahead.
Run It Yourself
Current screen (live data):
-- Current Oversold Quality Screen
-- Step 1: Quality screen (5-factor TTM proxy for Piotroski >= 7)
SELECT
    k.symbol,
    p.companyName,
    p.exchange,
    ROUND(k.returnOnAssetsTTM * 100, 1) AS roa_pct,
    ROUND(k.returnOnEquityTTM * 100, 1) AS roe_pct,
    ROUND(k.incomeQualityTTM, 2) AS income_quality,
    ROUND(k.currentRatioTTM, 2) AS current_ratio,
    ROUND(k.netDebtToEBITDATTM, 2) AS net_debt_ebitda
FROM key_metrics_ttm k
JOIN profile p ON k.symbol = p.symbol
WHERE k.returnOnAssetsTTM > 0
  AND k.returnOnEquityTTM > 0.10
  AND k.incomeQualityTTM > 1.0
  AND k.currentRatioTTM > 1.0
  AND k.netDebtToEBITDATTM BETWEEN -10 AND 3.0
  AND p.marketCap > 1000000000  -- $1B+ for US
  AND p.exchange IN ('NYSE', 'NASDAQ', 'AMEX')
  AND p.isFund = false
  AND p.isEtf = false
  AND p.isActivelyTrading = true
QUALIFY ROW_NUMBER() OVER (PARTITION BY p.companyName
                           ORDER BY p.averageVolume DESC) = 1
ORDER BY k.symbol
Run this query on Ceta Research Data Explorer
Note: this SQL uses TTM (trailing twelve months) financial ratios as a proxy for the full nine-factor annual Piotroski score used in the backtest. RSI is computed from daily price data at backtest time and isn't available directly in the quality screen SQL.
Run the full historical backtest:
git clone https://github.com/ceta-research/backtests.git
cd backtests
pip install -r requirements.txt
python3 oversold-quality/backtest.py --preset us --output results.json --verbose
Limitations
Survivorship bias: The FMP dataset includes delisted stocks, which reduces survivorship bias compared to index-only data. But the extent of coverage for stocks that were delisted mid-period isn't fully verifiable.
Look-ahead bias: The Piotroski score uses annual financial statements, applied with a 45-day filing lag to avoid look-ahead. RSI is computed from price data available at the rebalance date, and positions fill at the next day's close. We're confident in the point-in-time logic, but any backtest is susceptible to subtle look-ahead if data timestamps are inconsistent.
Data quality: Raw end-of-day data carries occasional bad rows, single-day adjusted-close values that spike several-fold and revert. We filter these before computing returns, because a handful of them on entry or exit dates can swing a quarterly result by tens of percent. The earlier, uncorrected version of this backtest understated the strategy's return by roughly 3% a year for exactly this reason.
Transaction costs: We use a size-tiered cost model based on market cap. Real-world costs for small-cap stocks in the screen can be higher than modeled, particularly for positions that require substantial price impact to fill.
The RSI threshold is fixed: RSI < 30 is the conventional oversold threshold, but it was never specifically optimized for this strategy on US data. A different threshold (25, 35) might produce different results. We didn't test variations.
Currency: All results are in USD.
Data: Ceta Research (FMP financial data warehouse), January 2000 through December 2025. Full methodology: github.com/ceta-research/backtests/blob/main/METHODOLOGY.md.
Academic references: Piotroski, J.D. (2000). "Value Investing: The Use of Historical Financial Statement Information to Separate Winners from Losers." Journal of Accounting Research, 38. Wilder, J.W. (1978). New Concepts in Technical Trading Systems. Trend Research.
Past performance does not guarantee future results. This is educational content, not investment advice.

