
Multi-Pair Pairs Trading in India: The Alpha-Dilution Curve

We ran the same multi-pair pairs trading backtest on Indian stocks (BSE + NSE) from 2005 to 2024. With 5 pairs, the strategy returned +11.80% annually, beating the S&P 500's 9.81%. With 20 pairs, it dropped to +6.45%. Each pair added beyond the top 5 diluted the returns. India is the one market in our global study where selective pairs trading generates genuine alpha, but only if you know when to stop adding pairs.
Contents
- Method
- What We Found
- The alpha-dilution curve
- The early years drove the alpha
- Crisis protection
- 20-year summary (20-pair inv-vol)
- Why India Works (at the Top 5)
- What This Means for Portfolio Construction
- Limitations
- Takeaway
- Part of a Series
Important caveat: Short selling is restricted on Indian exchanges. These are theoretical returns assuming the ability to short-sell at the same cost structure as long positions. In practice, executing the short legs in India carries additional constraints and costs.
Method
Identical to the US analysis. Same-sector pairs from BSE and NSE combined, correlation >= 0.70, half-life 5-60 days. Formation period = prior calendar year. Z-score entry/exit (±2.0 / ±0.5). Size-tiered transaction costs applied.
Portfolio sizes tested: 5, 10, 15, 20 pairs. Allocation methods: equal weight and inverse-volatility.
The 20-pair inverse-vol portfolio is the primary reported configuration (consistent with the global comparison). The interesting story is the 5-pair equal-weight configuration.
What We Found
India is the exception to the global pattern. On 10 of 11 exchanges we tested, multi-pair pairs trading underperformed SPY. India at 5 pairs is the one case where it outperforms.
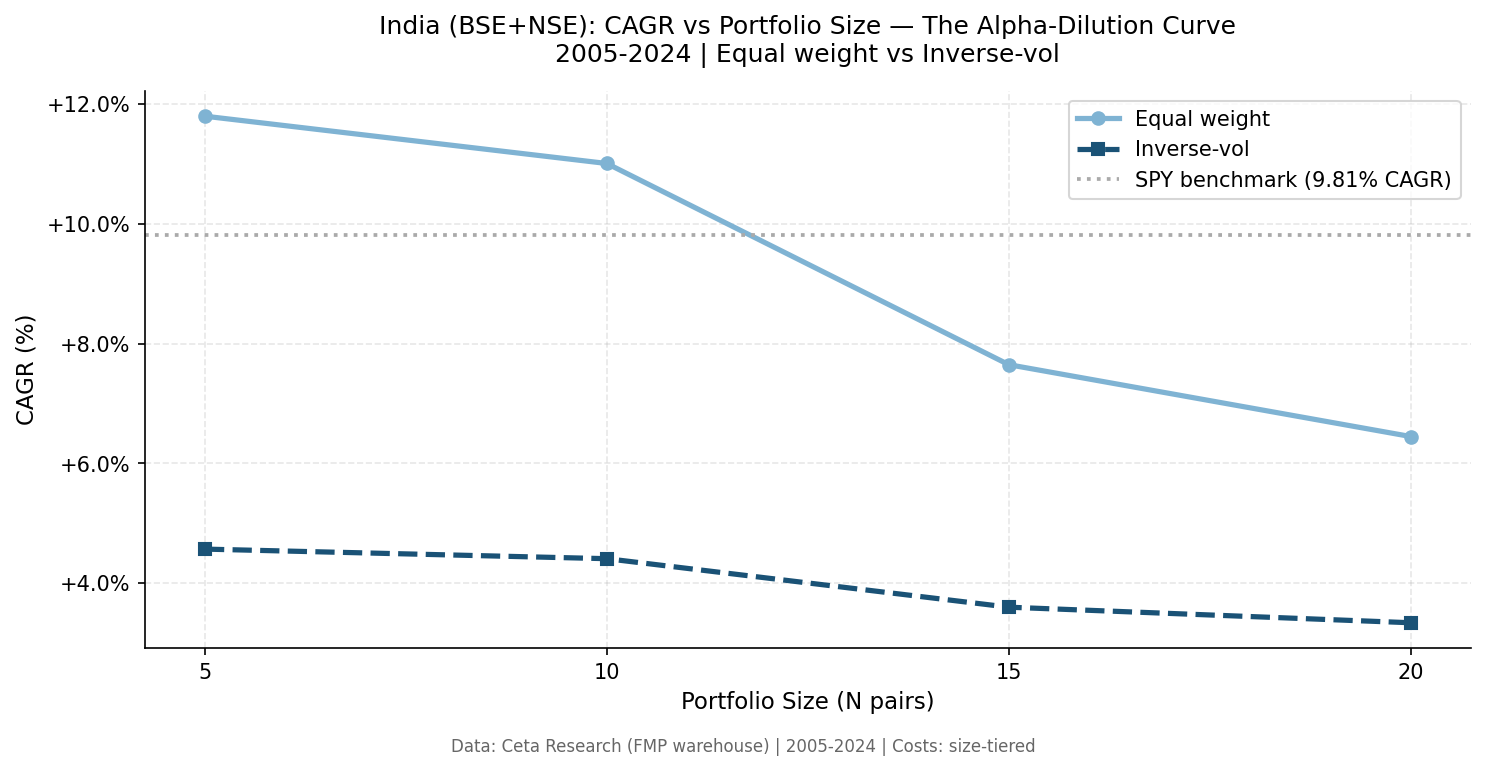
The alpha-dilution curve

| N pairs | Equal CAGR | vs SPY (9.81%) | Equal MaxDD |
|---|---|---|---|
| 5 | +11.80% | +1.99% | -24.46% |
| 10 | +11.01% | +1.20% | -24.03% |
| 15 | +7.65% | -2.16% | -22.14% |
| 20 | +6.45% | -3.36% | -20.34% |
The pattern is clear. The top-5 most correlated Indian pairs carry real short-term cointegration alpha. Pairs 6-10 are weaker but still additive. Pairs 11-15 drop the CAGR below the benchmark. By 20 pairs, you're 3.36% below SPY.
This happens because the Indian pair universe isn't homogeneous. The top-ranked pairs (by prior-year correlation) have genuinely tight relationships. They mean-revert quickly and cleanly. The pairs ranked 11-20 are lower quality: longer half-lives, noisier spreads, lower correlation. Adding them drags down the portfolio mean.
The inverse-vol allocation method makes this worse. At every portfolio size, equal weight beats inverse-vol by a significant margin:
| N pairs | Equal CAGR | Inv-vol CAGR | Gap |
|---|---|---|---|
| 5 | +11.80% | +4.57% | 7.23% |
| 10 | +11.01% | +4.41% | 6.60% |
| 15 | +7.65% | +3.60% | 4.05% |
| 20 | +6.45% | +3.34% | 3.11% |
Inverse-vol underweights the pairs with the highest expected return. High-spread-vol pairs tend to be the most strongly mean-reverting in Indian markets. Weighting them down removes the best opportunities from the portfolio.
The early years drove the alpha
The 20-pair inv-vol annual returns show where the India performance came from:
| Year | Portfolio | SPY |
|---|---|---|
| 2005 | +17.32% | +5.33% |
| 2006 | +91.73% | +13.84% |
| 2007 | +4.24% | +5.33% |
| 2008 | -0.59% | -36.23% |
| 2009 | +13.14% | +22.66% |
| 2010 | -3.59% | +13.13% |
| 2011-2024 | -1% to -3% range | Various |
2006 was exceptional: +91.73% in a market-neutral strategy. This reflects genuine Indian market conditions in 2006, not a data artifact, the BSE was in the middle of a bull cycle, and high-momentum sector pairs saw wide spread dislocations that quickly reverted. The 2006 number pulls up the long-run average.
From 2010 onward, the same transaction cost erosion seen in the US appears in India. Returns turned consistently negative.
The 5-pair equal-weight strategy likely has a similar concentration in the early high-return years. The 20-year CAGR of +11.80% overstates what you'd expect going forward.
Crisis protection
2008: -0.59% vs SPY -36.23%. India showed the same crisis insulation property as the US. Market-neutral positioning means the directional crash doesn't reach the spread positions. Even in the Indian crash of 2008, the pairs portfolio barely moved.
20-year summary (20-pair inv-vol)
| Metric | Portfolio | SPY |
|---|---|---|
| CAGR | +3.34% | +9.81% |
| Total Return | +92.78% | +550.1% |
| Max Drawdown | -26.90% | -36.23% |
| Sharpe Ratio | -0.149 | +0.194 |
| Up Capture | 34.51% | |
| Down Capture | 6.12% |
The 20-pair inv-vol portfolio underperforms SPY by 6.48% annually. The 5-pair equal-weight portfolio outperforms by 1.99%. Portfolio construction choice matters enormously in India.
Down capture of 6.12% means when SPY falls, this portfolio barely participates. In India's context, this is valuable: the BSE sees sharp drawdowns during global risk-off events, and the pairs strategy provides genuine insulation.
Why India Works (at the Top 5)
Three structural factors make Indian pairs attractive at small portfolio sizes:
1. Sector concentration. Indian markets have fewer qualifying large-cap stocks per sector than the US. The top-5 correlated pairs within a sector tend to be the only 2-3 pairs that really work in that sector. They're genuinely tight relationships.
2. Short-term momentum in Indian markets. Indian stocks exhibit higher short-term serial correlation than US stocks. Spread dislocations are more persistent and more likely to converge within the 60-day time window.
3. Lower institutional participation in pairs strategies. More alpha available from systematic mean-reversion because fewer competing strategies are running the same trades.
These advantages weaken as you add lower-quality pairs. Pairs 6-20 don't share these properties, they're borderline candidates that happen to pass the correlation filter but lack the structural tightness of the top tier.
What This Means for Portfolio Construction
The alpha-dilution curve has a practical implication: in markets with heterogeneous pair quality, running a concentrated portfolio of your best candidates beats diversifying across all available pairs.
The standard finance intuition is that more diversification reduces idiosyncratic risk. That's true. But in pairs trading, idiosyncratic risk is the source of expected return. If your best pairs have positive expected trade returns and your weaker pairs have negative expected trade returns, adding the weaker pairs doesn't reduce risk, it reduces return.
The optimal stopping point in India appears to be around 10 pairs (CAGR still +11.01%, still beats SPY). Beyond 10, each additional pair subtracts from the result.
Limitations
Short-selling restrictions. These results assume unrestricted short selling at standard cost. In practice, shorting specific Indian stocks involves borrowing costs, limited borrow availability in some securities, and regulatory constraints that vary by stock and time period. Actual returns would be lower.
2006 outlier. The +91.73% return in 2006 pulls the 20-year average. Without 2006, the long-run CAGR would be materially lower.
BSE + NSE combination. We combine both exchanges. Some stocks are listed on both. Pair selection deduplicates by symbol, but exchange-specific liquidity differences aren't modeled.
Formation-period correlation stability. Top-5 pairs in year N are the top-5 based on year N-1 correlation. Year-to-year pair rankings in India show more variation than in more liquid markets. The top-5 in 2010 were different from the top-5 in 2011.
Survivorship bias. Universe filtered by market cap at each rebalance date. Historical delistings aren't tracked.
Takeaway
India is the one market in our 11-exchange global study where multi-pair pairs trading generates meaningful alpha, but only with disciplined portfolio size limits. Five pairs returned +11.80% CAGR (vs 9.81% SPY). Twenty pairs returned +6.45%.
The alpha-dilution curve is the key insight: pair quality is heterogeneous, and the alpha is concentrated in the top-ranked pairs. Adding more pairs past the quality threshold dilutes the result.
If you're running pairs strategies on Indian markets, the data supports running a concentrated book of 5-10 pairs over a diversified 20-pair portfolio. The diversification "benefit" disappears once you've exhausted the high-quality pair universe.
The practical constraint is short-selling access. The strategy runs 50% short at all times. Before assuming these returns are achievable, verify that your specific pairs have borrowable shares and that the short-side execution cost is within the assumed range.
Part of a Series
- Multi-Pair Pairs Trading: US Analysis, why transaction costs kill the strategy in the US
- Multi-Pair Pairs Trading: 11-Exchange Comparison, global comparison across 11 exchanges
Run It Yourself
Explore the data behind this analysis on Ceta Research. Query our financial data warehouse with SQL, build custom screens, and run your own backtests across 70,000+ stocks on 20 exchanges.
Data: Ceta Research, FMP financial data warehouse. Universe: BSE + NSE, MCap threshold adjusted for Indian markets. 2005-2024. Size-tiered transaction costs included. Short-selling restrictions not modeled.


