
12-Month Momentum on US Stocks: 7.15% CAGR vs 7.77% for the Index
We ran pure 12-month price momentum (no quality filters) on US stocks from 2000 to 2025. The strategy returned 7.15% annually vs 7.77% for SPY, with 159% down capture and a -66% max drawdown. Small CAGR gap, much worse risk profile.

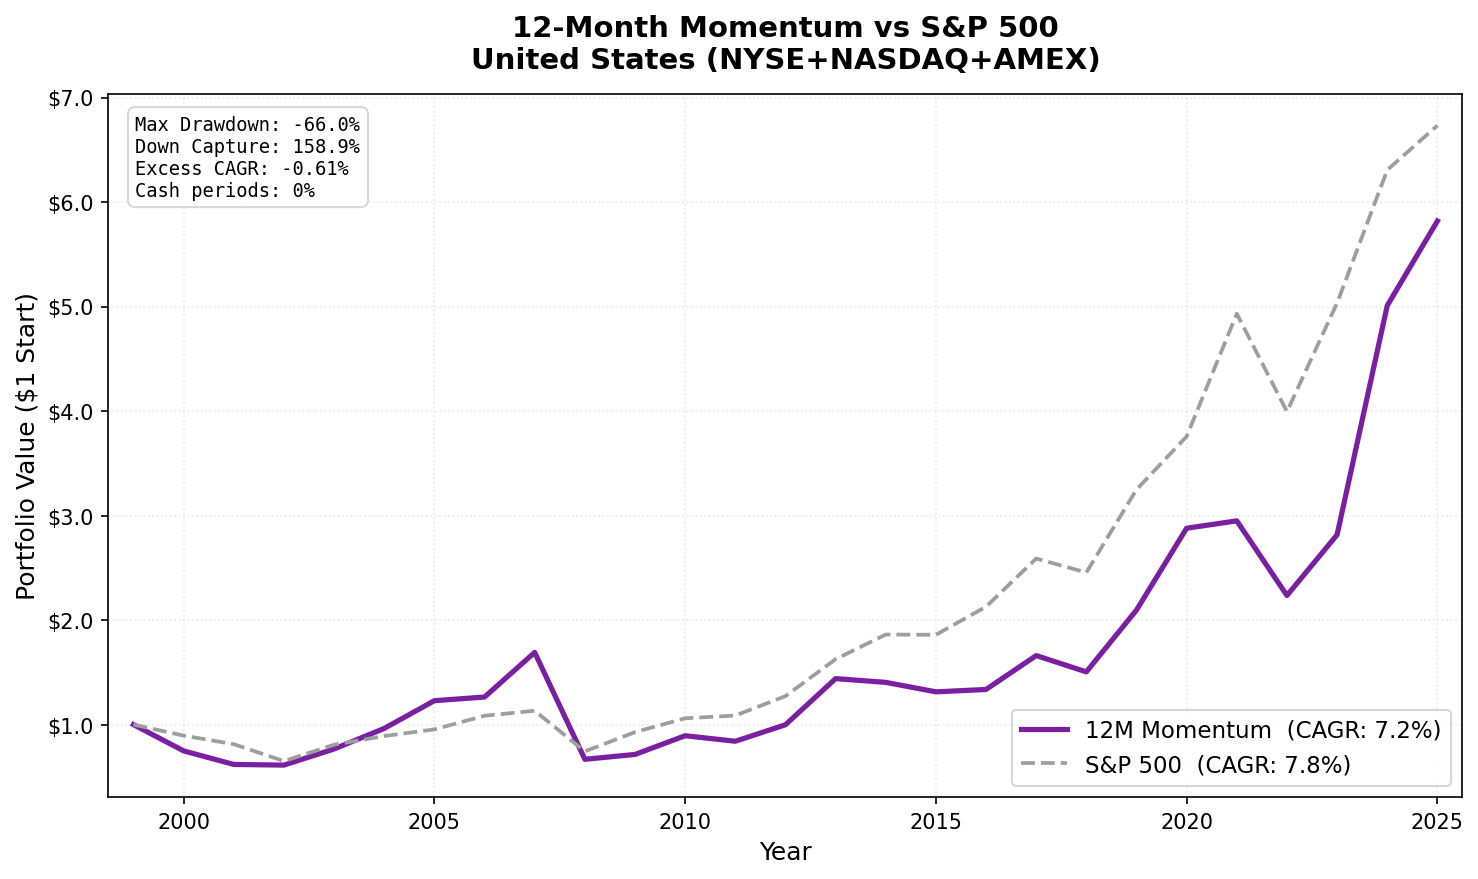
Pure 12-month price momentum is one of the most replicated factors in academic finance. Jegadeesh and Titman documented it in 1993 and the finding has held in 40+ countries for three decades. On US stocks, the raw signal almost matches the index but with much worse risk. The strategy returned 7.15% annually from 2000 to 2025, against 7.77% for the S&P 500. Down capture of 159% and a max drawdown of -66% make the comparison worse than the headline CAGR gap suggests.
Contents
- Method
- What We Found
- Backtest Methodology
- Limitations
- Takeaway
- Part of a Series
- References
- Run This Screen Yourself
Data: FMP financial data warehouse, 2000–2025. Updated May 2026.
Method
| Parameter | Value |
|---|---|
| Universe | NYSE, NASDAQ, AMEX (full exchange) |
| Rebalancing | Semi-annual (January, July) |
| Signal | 12-month return, skip last month (12M-1M) |
| Selection | Top 30 by momentum, equal weight |
| Cash rule | Fewer than 10 qualifying stocks |
| Data source | FMP via Ceta Research warehouse |
| Execution | Next-day close (MOC) |
| Benchmark | S&P 500 (SPY) |
| Period | 2000–2025 |
| Market cap filter | > $1B USD (point-in-time, 45-day lag) |
The signal is the canonical "12-1" momentum from Jegadeesh and Titman (1993): price from 12 months ago to 1 month ago, skipping the most recent month. The most recent month is skipped because short-term momentum tends to reverse. Stocks with adjusted close below $1 at either lookback date are excluded to eliminate FMP split-adjustment artifacts, and an oscillation filter removes phantom holiday rows from the price series.
What We Found
25-year summary (2000–2025):
| Metric | 12M Momentum | S&P 500 (SPY) |
|---|---|---|
| CAGR | 7.15% | 7.77% |
| Total Return | 481.9% | 573.3% |
| Sharpe Ratio | 0.188 | 0.376 |
| Max Drawdown | -65.98% | -38.01% |
| Down Capture | 158.9% | 100% |
| Up Capture | 137.8% | 100% |
| Cash Periods | 0 of 51 (0%) |
The CAGR gap is small, -0.61 percentage points annually, but the risk profile is much worse. Down capture of 158.9% means when SPY falls, the momentum portfolio falls 59% harder on average. The max drawdown of -66% is nearly double SPY's -38%. You're taking substantially more crash risk for slightly less return.
The Sharpe of 0.188 is half of SPY's 0.376. The portfolio captures 138% of SPY's upside but 159% of its downside. In any sustained bull market, the strategy keeps pace or runs ahead. In any sharp reversal, it falls harder. The math nets out to slight underperformance with double the drawdown.
Year-by-year standouts:
| Year | 12M Momentum | SPY | Notes |
|---|---|---|---|
| 2000 | -25.1% | -10.5% | Tech momentum crash |
| 2008 | -60.5% | -34.3% | Worst year, momentum crash |
| 2009 | +6.9% | +24.7% | Lagged the recovery |
| 2019 | +39.3% | +32.3% | Tech momentum surge |
| 2020 | +37.4% | +15.6% | COVID rebound, momentum led |
| 2021 | +2.5% | +31.3% | Lagged the bull market |
| 2024 | +77.8% | +25.3% | AI/tech momentum, best year |
2008 and 2009 together. The crash year defines the US drawdown. In 2008, the portfolio lost 60.5%, 26 points worse than SPY. In 2009, while SPY recovered 24.7%, momentum gained only 6.9%. The portfolio entered 2009 holding defensive names that had held up in 2008, not the beaten-down financials and cyclicals that led the recovery. Pure momentum got hit hard in the crash and lagged the rebound.
2021. The strategy gained 2.5% against SPY's 31.3%, a 28-point gap in a strong bull market. Post-COVID momentum stocks peaked in late 2020. By mid-2021, the highest-momentum names were rotating out as value and cyclicals dominated. The portfolio was holding the right names from the prior year at the wrong time.
2024. The strategy's best year in the study at +77.8%. AI-driven momentum in tech and semiconductor names was real and sustained. One outsized year doesn't fix the 25-year risk profile, but it shows the factor still fires when conditions align: trending bull markets with clear sector winners.
Backtest Methodology
- Data: FMP financial data via Ceta Research warehouse. Price data from
stock_eod(adjusted closes). - Point-in-time: Market cap filter uses annual
key_metricsfilings with 45-day lag. No look-ahead bias. - Signal: Price at T-12M to T-1M. The 1-month skip avoids short-term reversal contamination per Jegadeesh & Titman.
- Data quality: Oscillation filter removes phantom holiday rows from adjClose. Stocks with adjusted close < $1 at either lookback date excluded (split-adjustment artifacts). Portfolio momentum capped at 500% per stock as a secondary artifact guard.
- Equal weight: 30 positions, 3.33% each. No intraperiod rebalancing.
- Transaction costs: Modeled as size-tiered commissions. See methodology.
- Benchmark: SPY ETF total return, dividends reinvested.
- Annual returns: Compounded from the strategy's semi-annual rebalance windows (Jan 1 / Jul 1 anchored). For years where the year-edge days had large moves (e.g. 2013), SPY's calendar-year total return on public records can differ by a few percentage points from the period-aligned value shown here. The CAGR, max drawdown, and Sharpe figures are unaffected.
Limitations
Small CAGR drag, big risk gap. The -0.61 percentage point annual drag is modest. The risk profile gap is the real story: 159% down capture, -66% max drawdown vs SPY's -38%. The drawdown alone disqualifies the strategy for most investors.
US is the most studied momentum market. Academic papers and systematic funds have documented and traded US momentum since the 1990s. Any clean alpha from the raw signal has been largely arbitraged. The factor is crowded in US equities.
Momentum crash risk is structural. The Daniel and Moskowitz (2016) mechanism, forced deleveraging of momentum positions at market turning points, is most acute where institutional momentum trading is heaviest. That's the US.
No adjustment for factor timing. Defensive momentum overlays (reducing exposure during high volatility) can improve drawdown. The pure signal tested here doesn't include them.
Takeaway
Pure price momentum on US stocks just matches the S&P 500 over 25 years, with twice the drawdown and 59% more downside capture. 7.15% CAGR vs 7.77% for SPY, Sharpe 0.188 vs 0.376, max drawdown -66% vs -38%. The headline gap is small but the risk-adjusted picture is clear: the strategy takes more risk for less return.
The US result fits academic theory: highly efficient, heavily traded markets price known anomalies faster. The stronger case for 12-month momentum is in less crowded markets. India (NSE) shows +5.98% annual excess over the Sensex with 63% down capture. Germany outperforms the DAX by +7.45% annually with the best Sharpe in the 18 exchanges studied (0.588). The pattern is geographic: the factor works where it hasn't been systematically traded to near-exhaustion.
Part of a Series
This is part of a multi-exchange 12-month momentum study:
- 12M Momentum: Global 18-Exchange Comparison, published April 14
- 12M Momentum: India 17.33% CAGR, published April 16
- 12M Momentum: Germany Best Sharpe in 18 Exchanges, published April 18
- 12M Momentum: UK Consistent Alpha, Low Down Capture, published April 20
Data: Ceta Research (FMP financial data warehouse), 2000–2025. Universe: NYSE + NASDAQ + AMEX, market cap > $1B (point-in-time, 45-day lag). Full methodology: METHODOLOGY.md. Past performance does not guarantee future results. This is educational content, not investment advice.
References
- Jegadeesh, N. & Titman, S. (1993). Returns to Buying Winners and Selling Losers. Journal of Finance, 48(1), 65-91.
- Carhart, M. (1997). On Persistence in Mutual Fund Performance. Journal of Finance.
- Asness, C., Moskowitz, T. & Pedersen, L. (2013). Value and Momentum Everywhere. Journal of Finance.
- Daniel, K. & Moskowitz, T. (2016). Momentum Crashes. Journal of Financial Economics.
Run This Screen Yourself
The current 12-month momentum screen for US stocks is live on Ceta Research:
cetaresearch.com/data-explorer?q=PL_Mgf8mjo
-- 12-Month Momentum US Screen
-- Live at: cetaresearch.com/data-explorer?q=PL_Mgf8mjo
WITH universe AS (
    SELECT p.symbol, p.companyName, p.exchange, k.marketCap / 1e9 AS market_cap_billions
    FROM profile p JOIN key_metrics_ttm k ON p.symbol = k.symbol
    WHERE k.marketCap > 1000000000 AND p.isActivelyTrading = true
      AND p.exchange IN ('NYSE', 'NASDAQ', 'AMEX')
),
price_12m_ago AS (
    SELECT symbol, adjClose AS price_12m,
           ROW_NUMBER() OVER (PARTITION BY symbol ORDER BY ABS(CAST(dateEpoch AS BIGINT) -
               CAST(EXTRACT(EPOCH FROM (CURRENT_DATE - INTERVAL '365' DAY))::BIGINT AS BIGINT))) AS rn
    FROM stock_eod
    WHERE CAST(date AS DATE) BETWEEN CURRENT_DATE - INTERVAL '395' DAY
                                 AND CURRENT_DATE - INTERVAL '335' DAY
      AND adjClose > 0
),
price_1m_ago AS (
    SELECT symbol, adjClose AS price_1m,
           ROW_NUMBER() OVER (PARTITION BY symbol ORDER BY ABS(CAST(dateEpoch AS BIGINT) -
               CAST(EXTRACT(EPOCH FROM (CURRENT_DATE - INTERVAL '30' DAY))::BIGINT AS BIGINT))) AS rn
    FROM stock_eod
    WHERE CAST(date AS DATE) BETWEEN CURRENT_DATE - INTERVAL '45' DAY
                                 AND CURRENT_DATE - INTERVAL '15' DAY
      AND adjClose > 0
)
SELECT u.symbol, u.companyName, u.exchange,
    ROUND(u.market_cap_billions, 2) AS market_cap_billions,
    ROUND((p1m.price_1m - p12.price_12m) / p12.price_12m * 100, 1) AS return_12m_1m_pct
FROM universe u
JOIN price_12m_ago p12 ON u.symbol = p12.symbol AND p12.rn = 1
JOIN price_1m_ago p1m ON u.symbol = p1m.symbol AND p1m.rn = 1
WHERE p12.price_12m > 1.0 AND p1m.price_1m > 1.0
  AND (p1m.price_1m - p12.price_12m) / p12.price_12m <= 5.0
ORDER BY return_12m_1m_pct DESC NULLS LAST
LIMIT 30;

