
Low Volatility Quality on Swiss Stocks (SIX): 0.342 Sharpe, +2.96% vs SMI
Low-vol quality on the SIX Swiss Exchange returned 5.07% CAGR with a 0.342 Sharpe from 2000 to 2025, beating the SMI by +2.96% annually at 13.34% volatility. Switzerland's defensive market produced 257% total returns with a -46.62% max drawdown, and rarely sits in cash.

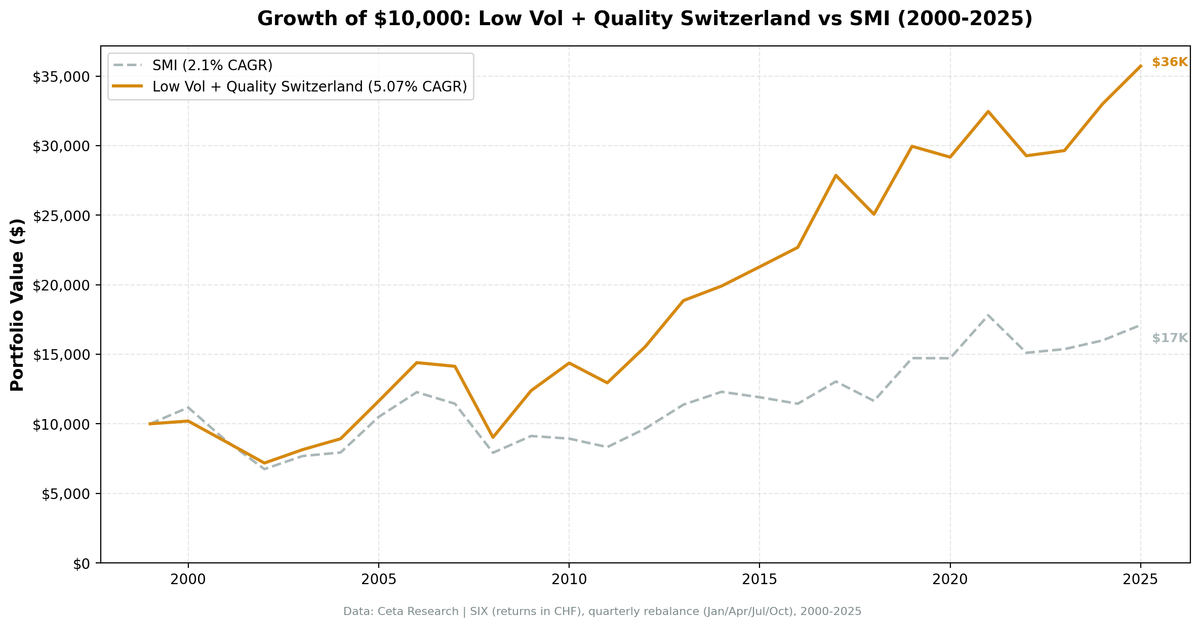
We screened the SIX Swiss Exchange for low-volatility quality stocks and backtested from 2000 to 2025. ROE > 10%, operating margin > 10%, market cap above CHF 500M (~$568M USD), then ranked by lowest 252-day realized volatility and held the top 30. The portfolio returned 5.07% CAGR with a 0.342 Sharpe ratio vs the SMI's 2.10% CAGR. Annualized volatility was 13.34%, one of the lowest in our 14-exchange study. Only 6 cash periods across 103 quarters, averaging 26.4 stocks per rebalance.
Contents
- Method
- The Screen
- Results
- When It Works
- When It Struggles
- Limitations
- Part of a Series
- Run It Yourself
- Takeaway
- References
Switzerland is a natural home for this strategy. Nestle, Novartis, Roche, Zurich Insurance, ABB. The SIX is dominated by exactly the kind of companies a low-vol quality screen selects: multinational, high-margin, stable cash flow. The portfolio beat the SMI by +2.96% annually over 25 years. When the universe already skews defensive, the volatility ranking has less room to differentiate, but the excess return over the local benchmark is clear.
Data: FMP financial data warehouse, 2000–2025. Updated March 2026.
Method
Data source: Ceta Research (FMP financial data warehouse, 70K+ global stocks) Universe: SIX (Switzerland), market cap > CHF 500M (~$568M USD) Period: January 2000 to March 2025 (25.8 years, 103 quarterly periods) Rebalancing: Quarterly (January, April, July, October) Benchmark: SMI (Swiss Market Index) Cash rule: Portfolio holds cash if fewer than 10 stocks qualify Transaction costs: Size-tiered model (0.1% for large caps, 0.3% for mid caps, 0.5% for small caps) Data quality guards: 45-day lag on annual filings, minimum 200 trading days for vol computation, max single return capped at 200%, penny stocks (< $1) excluded
Signal filters:
| Filter | Threshold | Source |
|---|---|---|
| Return on equity | > 10% | key_metrics FY |
| Operating profit margin | > 10% | financial_ratios FY |
| Market cap | > CHF 500M | key_metrics FY |
| 252-day realized volatility | Rank ASC, top 30 | stock_eod daily returns |
| Minimum trading days | >= 200 in 14-month window | stock_eod |
The CHF 500M threshold reflects Switzerland's market structure. The SIX has fewer listed companies than the LSE or JPX, but those that list tend to be large multinationals. The average of 26.4 stocks per period (slightly below the 30 target) shows the universe occasionally thins out after all quality filters are applied.
The Screen
SELECT
  k.symbol,
  p.companyName,
  ROUND(k.returnOnEquityTTM * 100, 2) AS roe_pct,
  ROUND(f.operatingProfitMarginTTM * 100, 2) AS opm_pct,
  ROUND(p.marketCap / 1e9, 2) AS mktcap_b
FROM key_metrics_ttm k
JOIN financial_ratios_ttm f ON k.symbol = f.symbol
JOIN profile p ON k.symbol = p.symbol
WHERE k.returnOnEquityTTM > 0.10
  AND f.operatingProfitMarginTTM > 0.10
  AND p.marketCap > 500000000
  AND p.exchange IN ('SIX')
  AND p.isFund = false
  AND p.isEtf = false
  AND p.isActivelyTrading = true
QUALIFY ROW_NUMBER() OVER (PARTITION BY p.companyName
                           ORDER BY p.averageVolume DESC) = 1
ORDER BY p.marketCap DESC
LIMIT 30
This produces the quality universe. The full strategy ranks these candidates by trailing 252-day volatility (computed from daily returns) and selects the 30 lowest-volatility names.
Try the quality screen on Ceta Research
Results
| Metric | Low Vol + Quality (SIX) | SMI |
|---|---|---|
| CAGR | 5.07% | 2.10% |
| Total Return | 257.10% | -- |
| Max Drawdown | -46.62% | -- |
| Annualized Volatility | 13.34% | -- |
| Sharpe Ratio | 0.342 | -- |
| Sortino Ratio | 0.518 | -- |
| Calmar Ratio | 0.109 | -- |
| VaR (95%) | -10.10% | -- |
| Beta | 0.718 | 1.0 |
| Alpha | 3.41% | -- |
| Up Capture | 91.81% | -- |
| Down Capture | 62.00% | -- |
| Win Rate | 55.34% | -- |
| Avg Stocks per Period | 26.4 | -- |
| Cash Periods | 6 of 103 | -- |
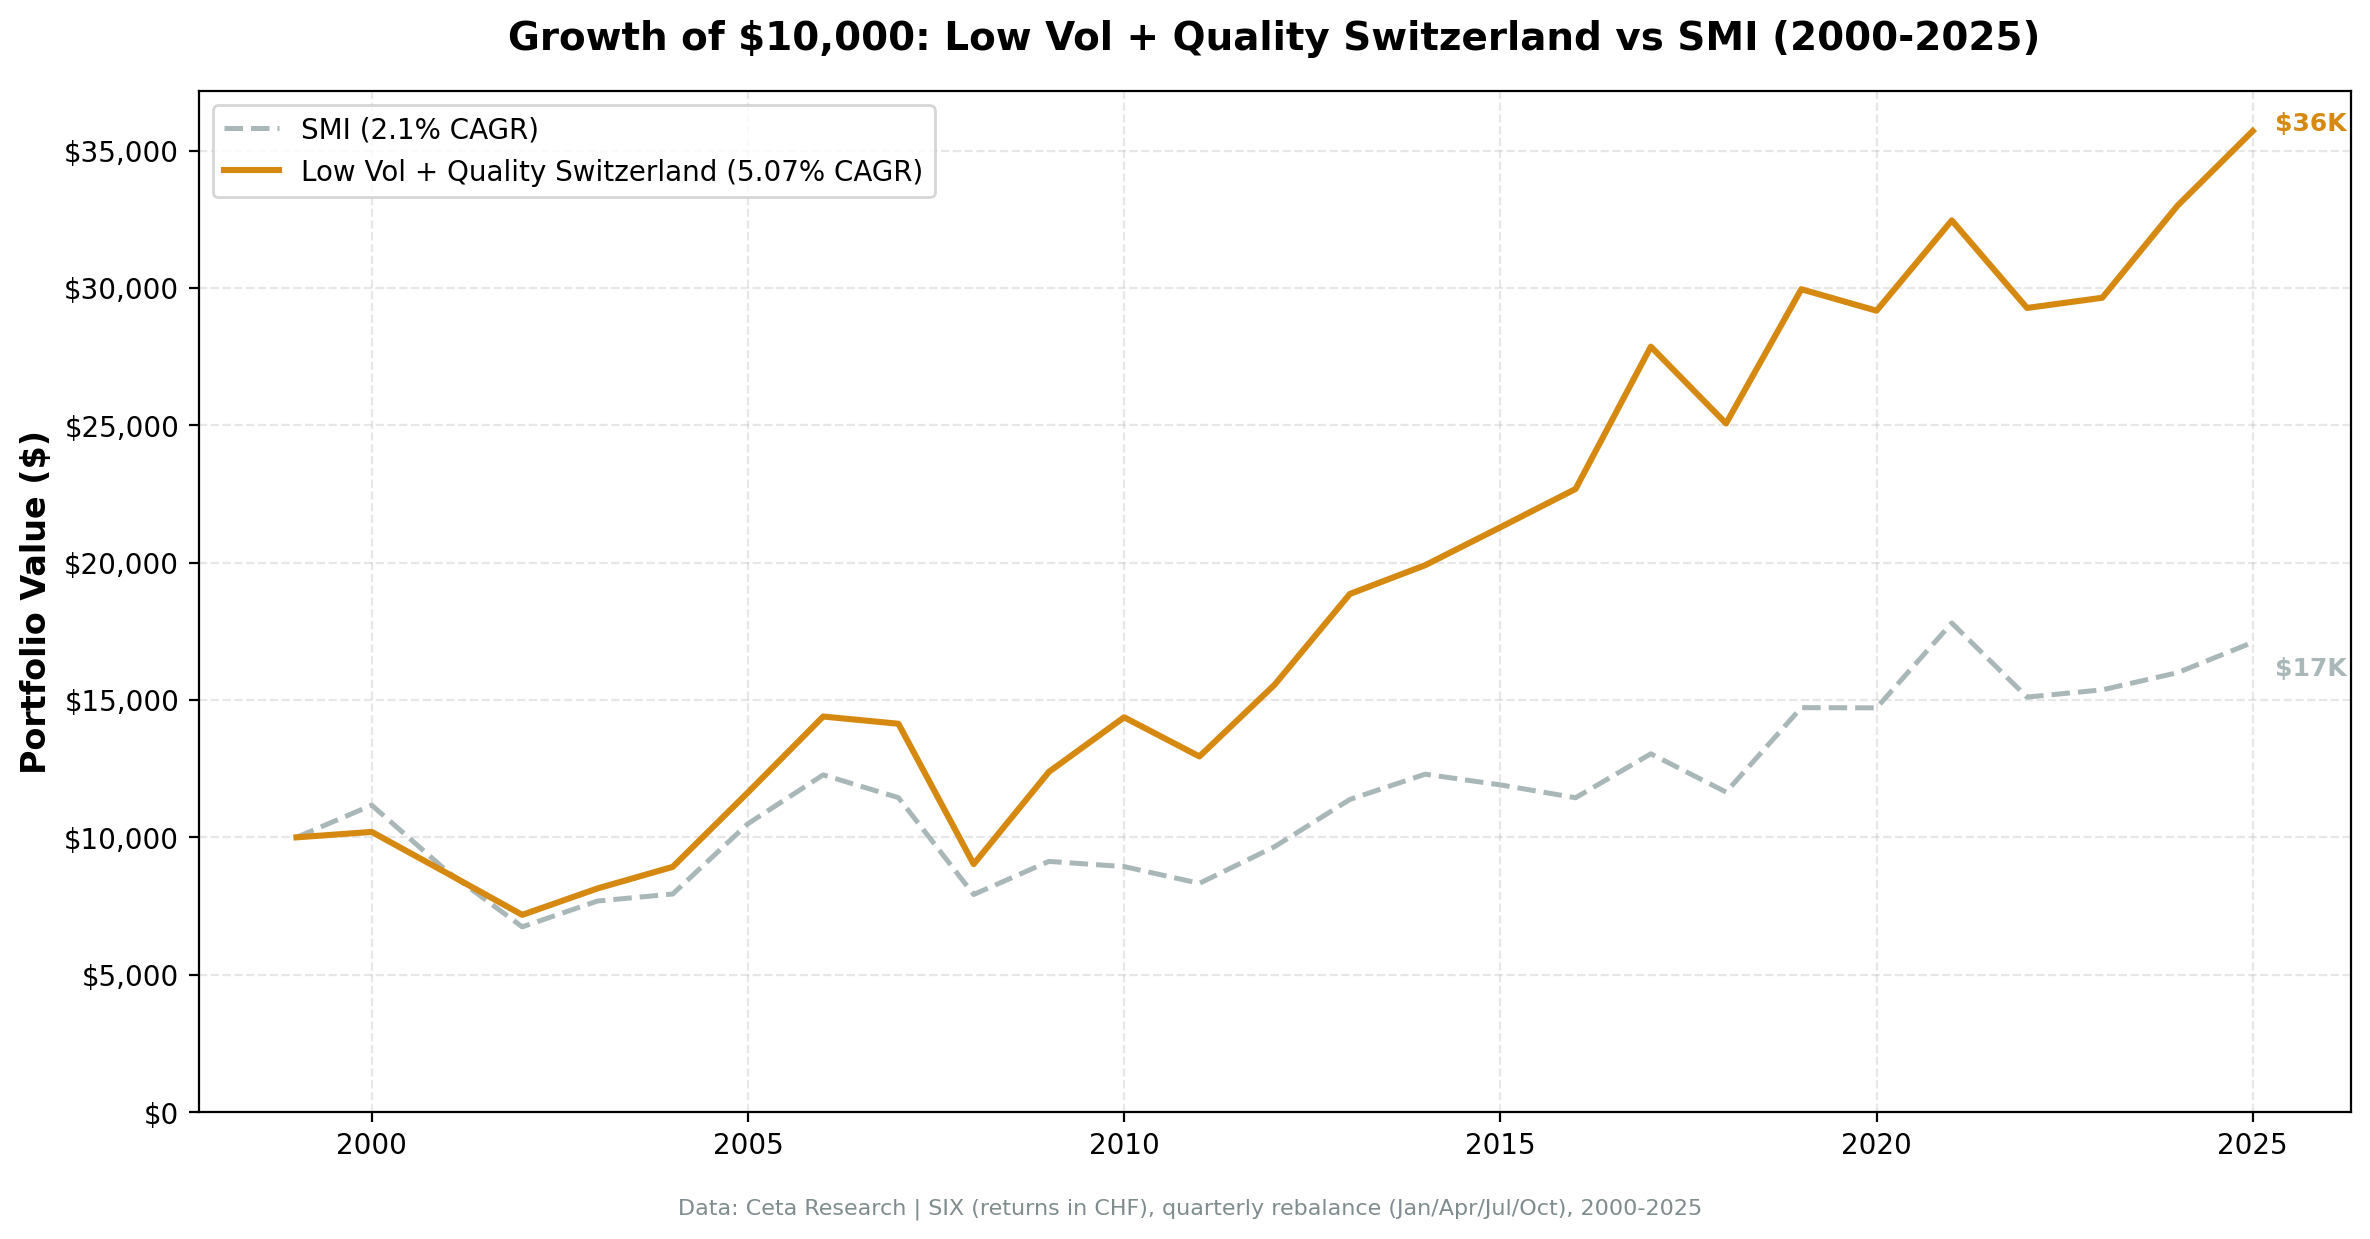
$10,000 invested in 2000 grew to $35,710 in the SIX low-vol quality portfolio. The portfolio beat the SMI by +2.96% annually, with 3.41% alpha and a 55.34% win rate.
The capture ratios tell the story. Up capture of 91.81% means the portfolio participated in nearly all of the SMI's gains. Down capture of 62.00% means it avoids about 38% of the SMI's losses. That asymmetry, persistent across 25 years, compounds into a large performance gap.
Annualized volatility of 13.34% is among the lowest in our 14-exchange study. Switzerland's naturally defensive market keeps portfolio volatility low even before the vol-ranking filter does its work. The VaR (95%) of -10.10% confirms the worst quarterly losses are contained.
Only 6 cash periods out of 103 means the strategy almost always found enough qualifying stocks. That's a contrast with Japan (14% cash) or Korea (28% cash). The Swiss market's high proportion of quality large-caps keeps the pipeline full.
When It Works
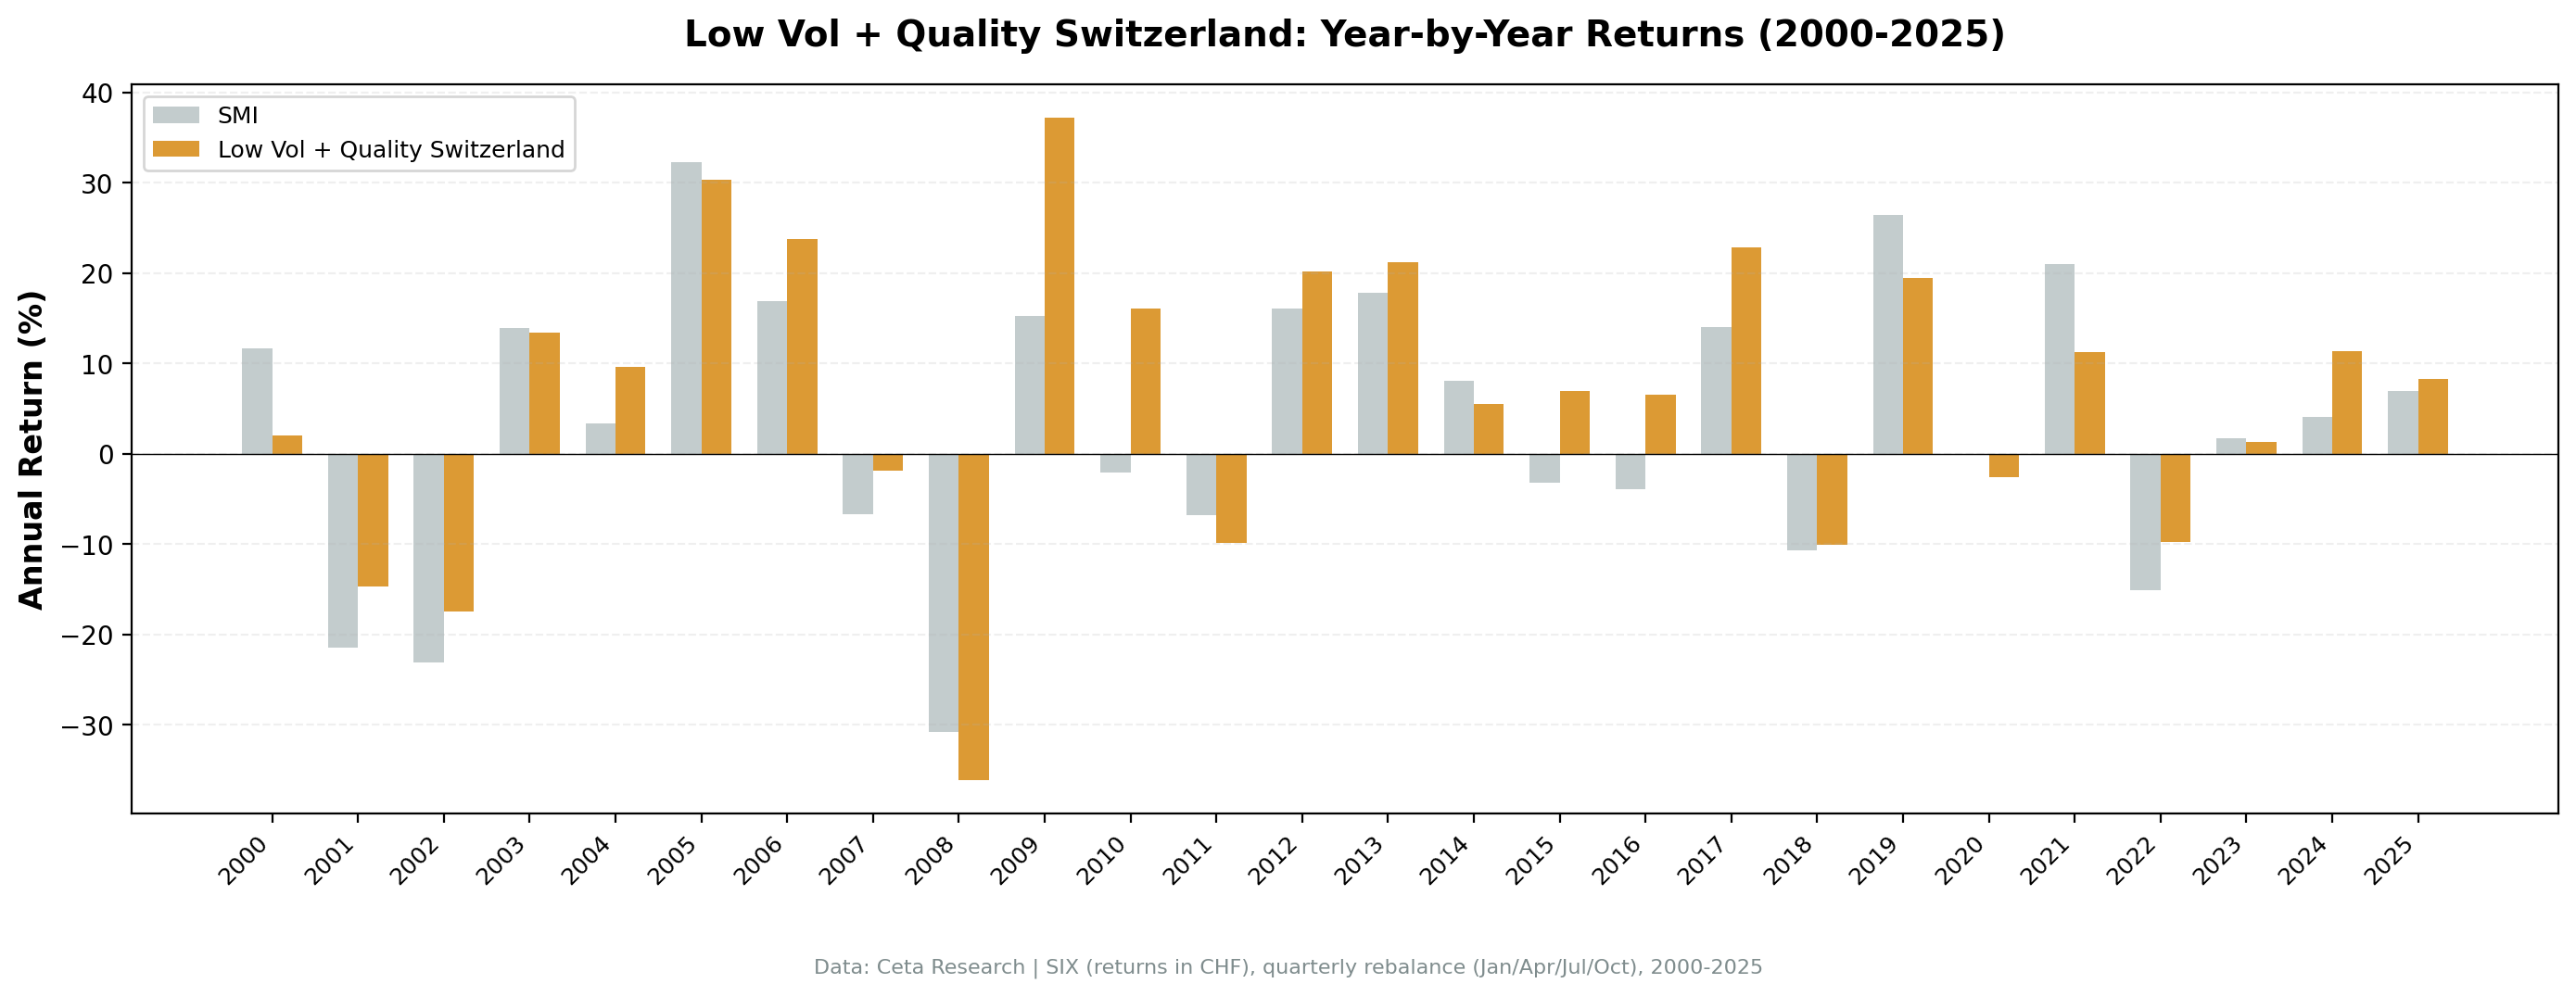
Post-GFC rebound, 2009-2010. Switzerland's best excess returns came out of the financial crisis. In 2009 the portfolio rose +37.2% against the SMI's +15.2%, a +22.0-point gap, as Swiss quality names led the recovery. In 2010 the split was cleaner still: the SMI fell -2.1% while the portfolio gained +16.0%, a +18.1-point spread. When the index drifted, steady high-margin earnings kept compounding.
The portfolio's 55.34% win rate means it beat the SMI in more than half of all quarters. With 91.81% up capture, the portfolio kept pace with the SMI in rising markets. The 62.00% down capture means it shed about 38% of the index's losses in falling markets.
Flat-to-down index years, 2015-2016. The strategy shines when the SMI can't get going. In 2015 the SMI fell -3.2% while the portfolio returned +6.9% (+10.1 excess). In 2016 the SMI fell -3.9% while the portfolio returned +6.6% (+10.5 excess). Swiss pharmaceutical and food companies delivered stable earnings that compounded through a choppy European environment. The SIX's composition is heavily weighted toward these names: Nestle, Novartis, and Roche alone make up a large share of the exchange's market cap. A quality filter on the SIX naturally tilts toward this cluster.
When markets reward fundamental quality over momentum, Switzerland's blue chips shine. The vol-ranking on top of the quality filter picks the steadiest of these already-steady companies. In a market where Nestle has an operating margin consistently above 15% and Roche above 25%, the quality bar isn't hard to clear. The differentiation comes from the volatility ranking, which favors the most stable earnings trajectories within this quality universe.
When It Struggles
Strong-index years and high-beta rotations. When the SMI rallies hard on cyclical or banking names, the low-vol portfolio lags, and the worst relative years all share that shape.
2000 is the clearest case. The SMI rose +11.7% while the portfolio managed only +2.0%, a -9.7-point gap. That was the final leg of the dot-com run, and the index climbed on names the quality-and-vol filter held light. The defensive tilt that pays off in downturns left the portfolio behind a still-rising market. When the crash arrived in 2001-2002, the strategy pulled ahead, beating the SMI by +6.8 and +5.7 points as the index fell -21.5% and -23.1%. 2021 repeated the 2000 pattern almost exactly: the SMI gained +21.0% against the portfolio's +11.3% (-9.7 excess) as the reflation trade lifted cyclicals. In 2019 the SMI's +26.4% beat the portfolio's +19.5% (-6.9 excess).
The portfolio's down capture of 62.00% means it absorbs about 62% of the SMI's losses in bad quarters. That's the weakest down capture in this study, reflecting the fact that the SIX is already a defensive market. Running a low-vol filter on a low-vol exchange produces less differentiation.
The quality filter excludes many financials (thin operating margins), so bank-led rallies leave the portfolio behind. The same pattern plays out during V-shaped recoveries: the sharpest bounce goes to the most beaten-down names, and the low-vol portfolio, already tilted toward steady pharma and food companies, misses the snapback.
The Swiss franc effect. Switzerland's currency is a structural factor. The CHF tends to strengthen during global risk-off events (flight to safety), which amplifies the portfolio's outperformance in bear markets when measured in CHF. Conversely, CHF strength can depress returns in CHF terms during risk-on periods. This currency dynamic is layered on top of the strategy's own performance.
Limitations
Max drawdown still deep. At -46.62%, the drawdown is only barely better than the SMI's worst periods. The 2008 crisis hit the banking sector hard (UBS, Credit Suisse), and contagion spread to the broader market. Quality filters didn't fully insulate the portfolio.
Small universe concentration. Averaging 26.4 stocks (below the 30 target) means the portfolio sometimes holds a concentrated bet. With fewer companies passing all filters, individual stock risk is higher. A profit warning from one of the 26 holdings moves the portfolio more than it would in a 30-stock basket.
Down capture of 62.00%. The weakest in this study. The SIX is already a defensive market, so the low-vol filter can't reduce downside as dramatically as it does on more volatile exchanges like India or Korea.
Switzerland as a "low-vol market." The SIX is already dominated by defensive blue chips. Running a low-vol screen on an already low-vol market produces less differentiation than running it on a high-vol market like India or China. The +2.96% excess is real, but it comes from the quality filter more than the volatility ranking.
Survivorship bias. Exchange membership uses current company profiles. Historical delistings on the SIX during 2000-2025 aren't fully captured.
Part of a Series
This post is part of our Low Volatility + Quality global exchange comparison. We ran the same strategy across 14 exchanges worldwide.
Low Volatility + Quality on US Stocks is the flagship post with full methodology, research context, and the complete 14-exchange comparison table.
Run It Yourself
Live screen:
python3 low-vol-quality/screen.py --preset switzerland
Backtest:
python3 low-vol-quality/backtest.py --preset switzerland --output results/returns_SIX.json --verbose
Code: github.com/ceta-research/backtests/tree/main/low-vol-quality
Takeaway
Against the SMI, the low-vol quality strategy works. The portfolio's 5.07% CAGR beats the index's 2.10% by +2.96% annually, with 3.41% alpha and a 55.34% win rate. Up capture of 91.81% means you keep most of the gains. Down capture of 62.00% means you shed about 38% of the losses. Over 25 years, that asymmetry compounds.
The strategy rarely sits in cash, just 6 periods out of 103, so the SIX consistently produces enough qualifying stocks to stay invested. The Sortino ratio of 0.518 confirms the downside management holds up.
For CHF-denominated investors, the case is straightforward: own the steadiest Swiss blue chips, rebalance quarterly, and beat the SMI by about 3 points annually with lower downside risk. The SIX is already a defensive market, so the volatility ranking adds less differentiation than it would on a high-vol exchange. But the quality filter does the heavy lifting, and the result is a portfolio that reliably outperforms the local benchmark.
References
- Baker, M., Bradley, B. & Wurgler, J. (2011). "Benchmarks as Limits to Arbitrage: Understanding the Low-Volatility Anomaly." Financial Analysts Journal, 67(1), 40-54.
- Ang, A., Hodrick, R., Xing, Y. & Zhang, X. (2006). "The Cross-Section of Volatility and Expected Returns." Journal of Finance, 61(1), 259-299.
- Frazzini, A. & Pedersen, L. (2014). "Betting Against Beta." Journal of Financial Economics, 111(1), 1-25.
- Novy-Marx, R. (2013). "The Other Side of Value: The Gross Profitability Premium." Journal of Financial Economics, 108(1), 1-28.
Data: Ceta Research, 2000-2025. Full methodology: Methodology
Past performance does not guarantee future results. This is educational content, not investment advice.

