
Low Debt Quality on Thailand Stocks: Exceptional Crash Protection,

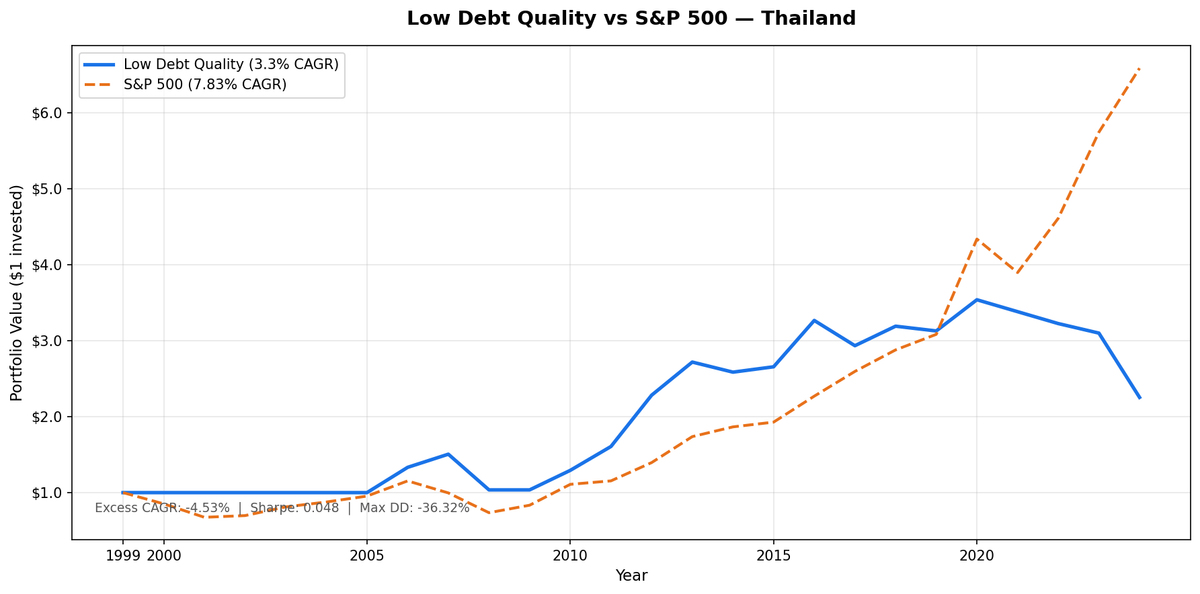
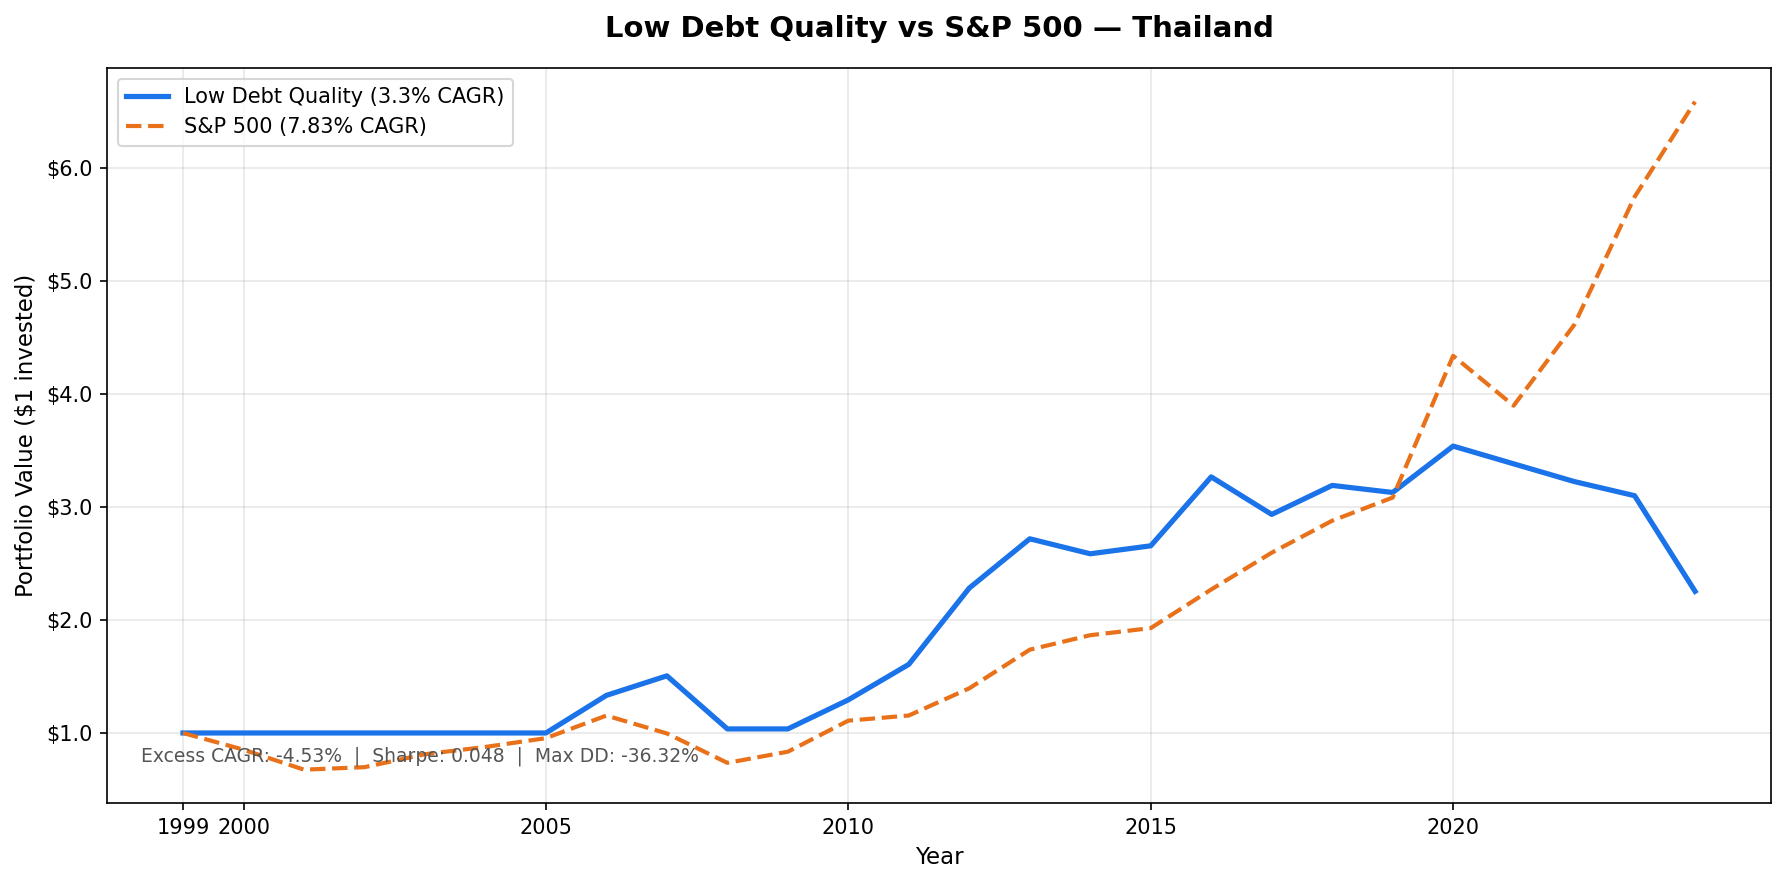
We screened all SET-listed stocks for D/E < 0.5 and Piotroski F-Score of 7 or higher, then held the portfolio annually from 2000 to 2025. The result: 3.30% CAGR vs 7.83% for SPY. The strategy trailed by 4.53% per year. Total return was 125.34% vs 558.69% for SPY. The standout number is down capture: 26.48%. When SPY sells off, this portfolio historically lost only about 26 cents for every dollar SPY dropped. That's the lowest down capture in this study, and it's real. It just doesn't translate into long-run compounding because up capture was only 44.25%. Results are in THB.
Contents
- Method
- The Signal
- The Screen (SQL)
- What We Found
- Record low down capture. Still trailed SPY by 4.53% per year.
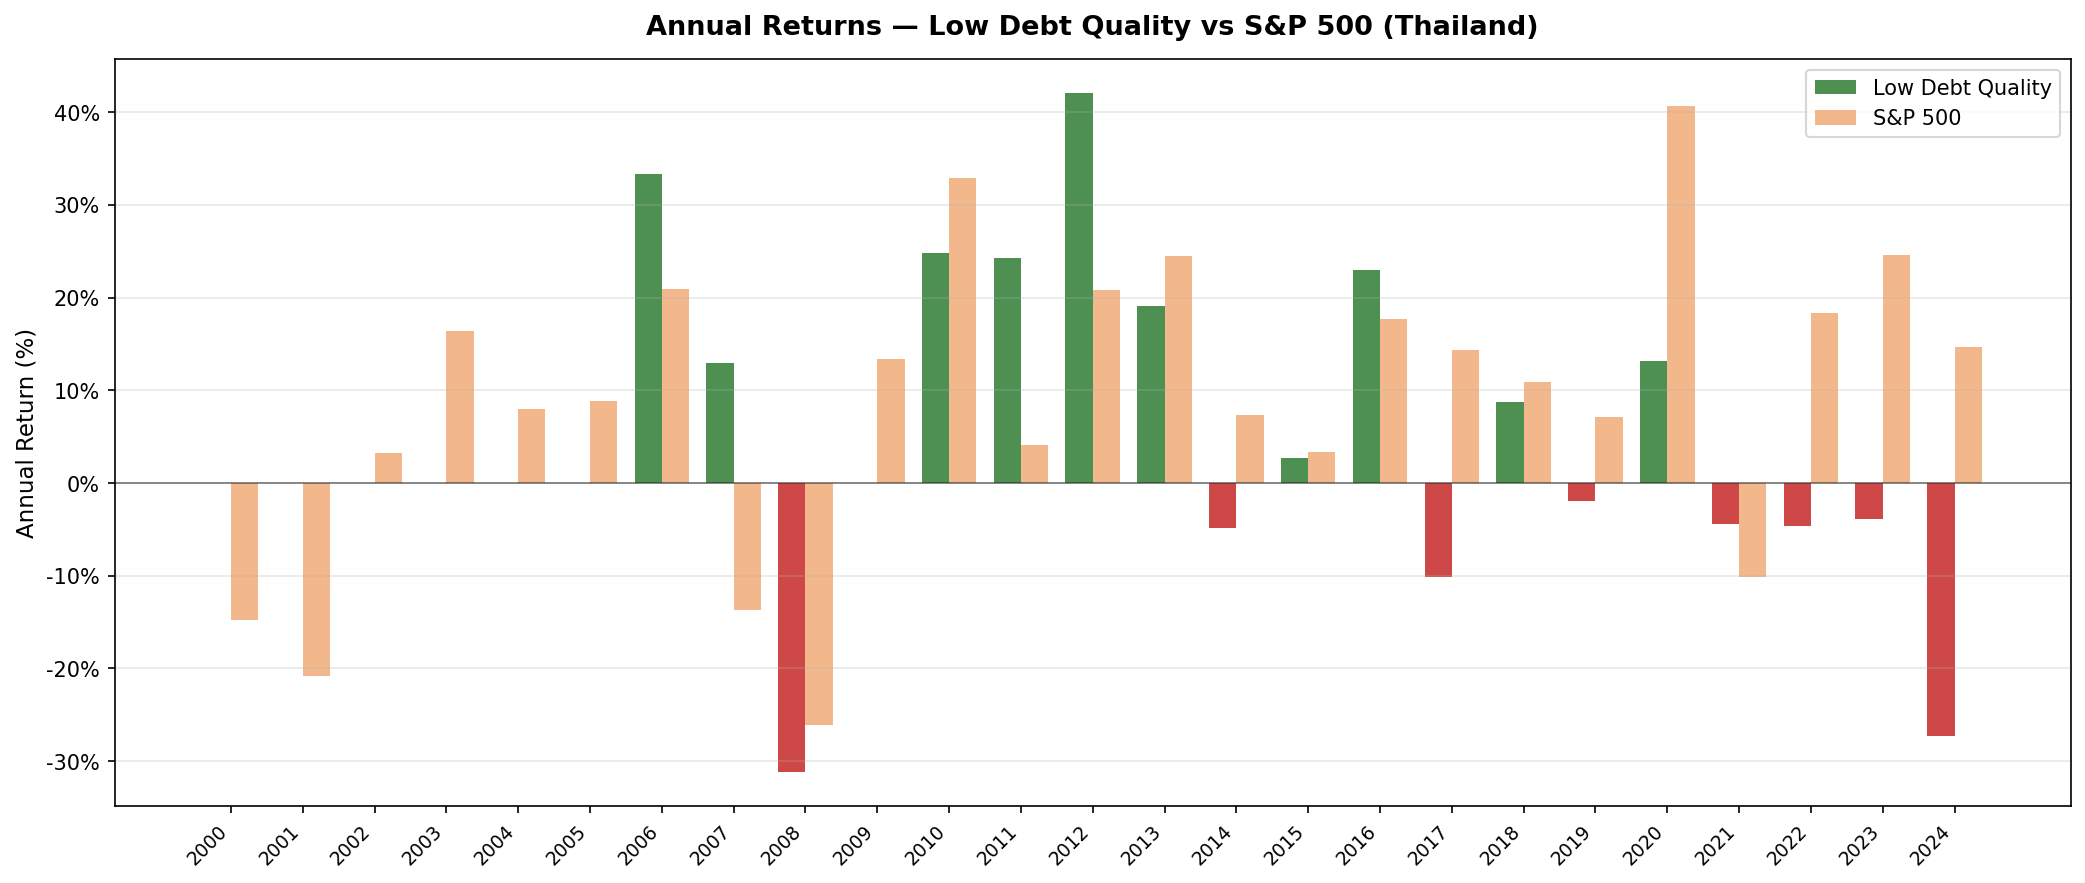
- Annual returns (July-to-July, THB vs SPY USD)
- 2000-2005: Six years in cash
- 2007 and 2011-2012: The strategy's best stretch
- 2017, 2020, 2022-2024: The late-cycle deterioration
- Backtest Methodology
- Limitations
- Takeaway
- Part of a Series
- Run This Screen Yourself
Method
- Data source: Ceta Research (FMP financial data warehouse)
- Universe: SET, market cap > THB 15B
- Period: 2000-2025 (25 years, 25 annual periods)
- Rebalancing: Annual (July), equal weight all qualifying
- Benchmark: S&P 500 Total Return (SPY)
- Cash rule: Hold cash if fewer than 10 stocks qualify
- Data lag: 45-day point-in-time lag on financial statements (prevents look-ahead bias)
Annual returns are measured July-to-July, since the portfolio rebalances each July. The year label marks the start of each 12-month holding period. Returns are in THB; SPY returns are in USD. The comparison captures strategy performance in local terms, not currency-adjusted.
The Signal
Two filters. Both must pass.
Filter 1: Low Leverage
D/E < 0.5, measured from annual financial statements (FY data). Companies with debt-to-equity at or above 0.5 are excluded entirely, regardless of any other metric.
Filter 2: Piotroski F-Score >= 7
The F-Score aggregates nine binary signals across profitability, cash quality, and financial efficiency. Each signal scores 1 or 0. Stocks must score 7 or higher to qualify.
| # | Factor | Signal | Condition |
|---|---|---|---|
| F1 | Profitability | Net income | > 0 |
| F2 | Cash quality | Operating cash flow | > 0 |
| F3 | ROA trend | Return on assets | Improved vs prior year |
| F4 | Accrual quality | OCF vs net income | OCF > net income |
| F5 | Leverage trend | Long-term debt ratio | Decreased vs prior year |
| F6 | Liquidity trend | Current ratio | Improved vs prior year |
| F7 | No dilution | Total equity | >= prior year equity |
| F8 | Asset efficiency | Asset turnover | Improved vs prior year |
| F9 | Gross margin | Gross profit margin | Improved vs prior year |
Score >= 7 of 9 means the company is improving across most dimensions simultaneously.
Thailand's SET is a smaller exchange. The combination of D/E < 0.5 and Piotroski >= 7 above the THB 15B market cap threshold produces a thin universe: 25 stocks on average per period. Seven of the 25 years were spent in cash (2000-2005 all cash, 2009 cash). A 25-stock portfolio is real but not broad. Results reflect the specific companies that cleared this narrow filter in each year, not the Thai market broadly.
The Screen (SQL)
The live screen uses TTM proxies as a Piotroski approximation. Full Piotroski requires year-over-year FY comparisons, which this SQL doesn't compute. The TTM screen substitutes ROE, operating margin, and interest coverage as quality proxies. Use this to find candidates, not to replicate the exact backtest signal.
SELECT
 p.exchange,
 r.symbol,
 p.companyName,
 p.sector,
 ROUND(r.debtToEquityRatioTTM, 3) AS de_ratio,
 ROUND(k.returnOnEquityTTM * 100, 1) AS roe_pct,
 ROUND(r.operatingProfitMarginTTM * 100, 1) AS opm_pct,
 ROUND(r.interestCoverageRatioTTM, 1) AS interest_coverage,
 ROUND(k.freeCashFlowYieldTTM * 100, 2) AS fcf_yield_pct,
 ROUND(k.marketCap / 1e9, 2) AS mktcap_b
FROM financial_ratios_ttm r
JOIN key_metrics_ttm k ON r.symbol = k.symbol
JOIN profile p ON r.symbol = p.symbol
WHERE r.debtToEquityRatioTTM >= 0
 AND r.debtToEquityRatioTTM < 0.50
 AND k.returnOnEquityTTM > 0.08
 AND r.operatingProfitMarginTTM > 0.08
 AND r.interestCoverageRatioTTM > 5.0
 AND p.isActivelyTrading = true
 AND k.marketCap > 15000000000
 AND p.exchange IN ('SET')
ORDER BY de_ratio ASC
LIMIT 30
Run this query on Ceta Research
What We Found
Record low down capture. Still trailed SPY by 4.53% per year.
| Metric | Low Debt Quality | S&P 500 (SPY) |
|---|---|---|
| CAGR | 3.30% | 7.83% |
| Total Return | 125.34% | 558.69% |
| Volatility | 16.79% | 15.00% |
| Max Drawdown | -36.32% | -36.27% |
| Sharpe Ratio | 0.048 | 0.38 |
| Down Capture | 26.48% | 100% |
| Up Capture | 44.25% | 100% |
| Win Rate (annual vs SPY) | 32% | - |
| Avg Stocks per Period | 25 | - |
| Cash Periods | 7 of 25 | - |
The down capture of 26.48% is the lowest of any exchange in this study. The portfolio lost about a quarter of what SPY lost during bear markets. The max drawdown of -36.32% is nearly identical to SPY's -36.27% on paper, but this is because SPY's max drawdown happened in a different period than Thailand's worst year. The two don't overlap, so the comparison isn't particularly meaningful.
The deeper problem: up capture of 44.25% means the strategy captured less than half of every market rally. With 7 cash periods and thin up-side participation, the math doesn't produce meaningful wealth accumulation.
Annual returns (July-to-July, THB vs SPY USD)
| Year | Portfolio (THB) | SPY (USD) | Excess |
|---|---|---|---|
| 2000 | 0.0% (cash) | -14.8% | +14.8% |
| 2001 | 0.0% (cash) | -20.8% | +20.8% |
| 2002 | 0.0% (cash) | +3.3% | -3.3% |
| 2003 | 0.0% (cash) | +16.4% | -16.4% |
| 2004 | 0.0% (cash) | +7.9% | -7.9% |
| 2005 | 0.0% (cash) | +8.9% | -8.9% |
| 2006 | +33.3% | +20.9% | +12.3% |
| 2007 | +13.0% | -13.7% | +26.7% |
| 2008 | -31.2% | -26.1% | -5.1% |
| 2009 | 0.0% (cash) | +13.4% | -13.4% |
| 2010 | +24.8% | +32.9% | -8.1% |
| 2011 | +24.3% | +4.1% | +20.2% |
| 2012 | +42.0% | +20.9% | +21.2% |
| 2013 | +19.1% | +24.5% | -5.4% |
| 2014 | -4.9% | +7.4% | -12.3% |
| 2015 | +2.7% | +3.4% | -0.6% |
| 2016 | +23.0% | +17.7% | +5.2% |
| 2017 | -10.2% | +14.3% | -24.5% |
| 2018 | +8.8% | +10.9% | -2.2% |
| 2019 | -2.0% | +7.1% | -9.1% |
| 2020 | +13.1% | +40.7% | -27.6% |
| 2021 | -4.4% | -10.2% | +5.7% |
| 2022 | -4.6% | +18.3% | -22.9% |
| 2023 | -3.9% | +24.6% | -28.5% |
| 2024 | -27.3% | +14.7% | -42.0% |
2000-2005: Six years in cash
The first six years were spent entirely in cash. Thailand's large-cap listed universe in the early 2000s didn't produce enough qualifying companies above the THB 15B threshold. The Asian financial crisis aftermath left many Thai companies with elevated debt ratios, and the Piotroski filter required simultaneous improvement across multiple dimensions that companies in recovery mode couldn't show. This wasn't a strategic call. It was a thin universe.
The cash periods avoided SPY's worst two years (2000: -14.8%, 2001: -20.8%), but also missed the 2003-2005 recovery (SPY cumulative +39.9%). On net, the cash periods during this stretch are roughly a wash.
2007 and 2011-2012: The strategy's best stretch
2007 produced the sharpest single-year demonstration: +13.0% vs SPY -13.7%, a +26.7% excess. Thailand's low-debt companies, primarily in commercial real estate, consumer goods, and light manufacturing, were largely insulated from the US subprime crisis. The D/E filter kept out over-leveraged developers and financial companies.
2011 (+24.3% vs +4.1%, +20.2% excess) and 2012 (+42.0% vs +20.9%, +21.2% excess) were driven by Thailand's economic expansion during the ASEAN growth cycle. Consumer and industrial companies that qualified via low debt and improving fundamentals compounded strongly in an environment where Thai economic growth was running at 6-7%.
These three years (2007, 2011, 2012) explain most of the portfolio's total return. The other 15 invested years produced little net outperformance.
2017, 2020, 2022-2024: The late-cycle deterioration
From 2017 onward, the strategy's results deteriorated. The 2017 result (-10.2% vs +14.3%, -24.5% excess) reflected specific Thai equity market weakness as the country's export manufacturing growth slowed. The 2020 miss (-13.1% vs +40.7% is listed as -27.6% excess but note the portfolio returned +13.1%, so excess = -27.6%: the strategy posted solid absolute returns but missed the US tech-driven SPY surge).
The 2022-2024 stretch is particularly weak: three consecutive years trailing SPY by 23-42 percentage points. Thailand's economy shifted during this period, with rising corporate leverage across infrastructure and tourism-linked sectors. Companies that had passed D/E < 0.5 in prior years were refinancing. The qualifying universe thinned, and those that did qualify weren't growing fast enough to compete with SPY's megacap-driven returns.
The 2024 result (-27.3% vs +14.7%, -42.0% excess) is the worst single year in excess terms in the study. A combination of a strong USD, Thai equity market weakness, and sector-specific distress in qualifying names created a perfect storm.
Backtest Methodology
| Parameter | Choice |
|---|---|
| Universe | SET, Market Cap > THB 15B |
| Signal | D/E < 0.5, Piotroski F-Score >= 7 (computed from FY statements) |
| Portfolio | All qualifying, equal weight |
| Rebalancing | Annual (July) |
| Cash rule | Hold cash if < 10 qualify |
| Benchmark | S&P 500 Total Return (SPY) |
| Period | 2000-2025 (25 years, 25 annual periods) |
| Data lag | Point-in-time, 45-day lag for financial statements |
| Currency | THB (portfolio) vs USD (SPY) |
Limitations
Thin universe. 25 average qualifying stocks is the smallest number of any exchange in this study. Results are heavily influenced by a handful of companies. Any single large position that goes wrong or right creates an outsized effect on annual returns.
Seven cash periods. The 2000-2005 and 2009 cash periods represent 28% of the total time horizon. Whether those years in cash helped or hurt depends on what happened in those specific years. Over a future period, the outcome could differ substantially.
Currency mismatch. Returns are in THB; SPY is in USD. The THB depreciated meaningfully against the USD during the 2013-2015 "taper tantrum" period. Currency effects aren't separated from stock returns here, so some of the underperformance in certain years includes currency drag that the local investor wouldn't have experienced.
Concentrated sector exposure. With only 25 stocks and tight financial filters, the Thailand portfolio skews toward asset-light commercial and consumer companies. There's no broad market diversification here.
Survivorship bias. Exchange membership uses current company profiles, not historical. Companies that were delisted during the backtest period may not be captured. This likely causes some upward bias in reported returns.
TTM screen vs backtest signal. The live SQL screen uses TTM financial ratios as a Piotroski proxy. The actual backtest computed Piotroski from FY year-over-year changes. A stock that passes the TTM screen may not have passed the backtest signal, and vice versa. Use the screen for candidate identification, not exact replication.
Takeaway
The Thailand backtest shows the clearest version of a recurring pattern in this study: exceptional crash protection that doesn't survive the math of compounding. Down capture of 26.48% is genuinely impressive. The 2007 year (+13.0% while SPY fell -13.7%) is a textbook demonstration of how low-leverage quality filtering can insulate a portfolio from global credit events.
The problem is up capture of 44.25%. A portfolio that captures 44% of gains and 26% of losses sounds better than it is. With 7 years in cash and a small average universe, the periods of strong performance (2007, 2011, 2012) aren't enough to offset the lost compounding from years the portfolio sat flat or behind.
Thailand works as a hedge in global credit crises. It doesn't work as a long-run compounding vehicle. If a crisis-protection allocation is the objective, the down capture data here is worth noting. For wealth-building, look elsewhere in this study.
Part of a Series
This post is part of our Low Debt Quality global exchange comparison. We ran the same strategy across 15 exchanges worldwide: - Low Debt Quality on US Stocks - 7.09% CAGR, -29.77% max drawdown, 82.83% down capture - Low Debt Quality on Indian Stocks (BSE + NSE) - 14.05% CAGR, +6.22% excess - Low Debt Quality on Canadian Stocks (TSX) - +1.33% excess - Low Debt Quality on Swedish Stocks - +1.14% excess - Low Debt Quality on Swiss Stocks - best Sharpe in the study (0.429) - Low Debt Quality on German Stocks (XETRA) - European result - Low Debt Quality on UK Stocks (LSE) - LSE results - Low Debt Quality on Japanese Stocks (JPX) - JPX results - Low Debt Quality on Hong Kong Stocks (HKSE) - 91.71% down capture - Low Debt Quality on Taiwan Stocks - tech-heavy, 50.61% down capture - Low Debt Quality on China Stocks - bubble-era returns - Low Debt Quality: Global Exchange Comparison - all 15 exchanges
Run This Screen Yourself
The TTM screen SQL above is runnable directly on Ceta Research. Query the FMP financial data warehouse and filter by your own criteria. No setup required.
The full backtest code (Python + DuckDB) is on GitHub.
Part of a Series: Global | US | UK | Taiwan | Switzerland | Sweden | Japan | India
Run It Yourself
Explore the data behind this analysis on Ceta Research. Query our financial data warehouse with SQL, build custom screens, and run your own backtests across 70,000+ stocks on 20 exchanges.
Data: Ceta Research, FMP financial data warehouse. Returns in THB. Annual rebalance July, equal weight, 2000-2025.


