
Low Debt Quality on Taiwan Stocks (TAI + TWO): Superior Risk-Adjusted Returns vs TAIEX
D/E < 0.5 + Piotroski F-Score >= 7 on TAI and TWO-listed stocks, backtested 2000-2025. 3.31% CAGR vs 4.09% TAIEX, trailing by 0.78% annually. Max drawdown -25.57% vs -41.11%, down capture 61.45%. Better Sharpe ratio (0.168 vs 0.127) through superior downside protection.

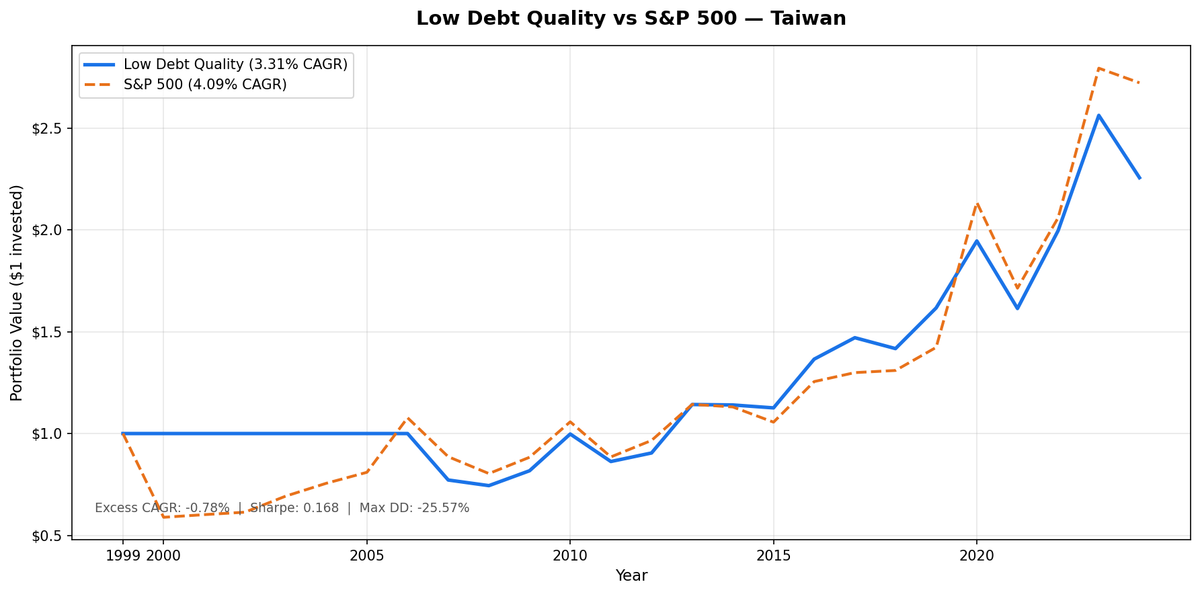
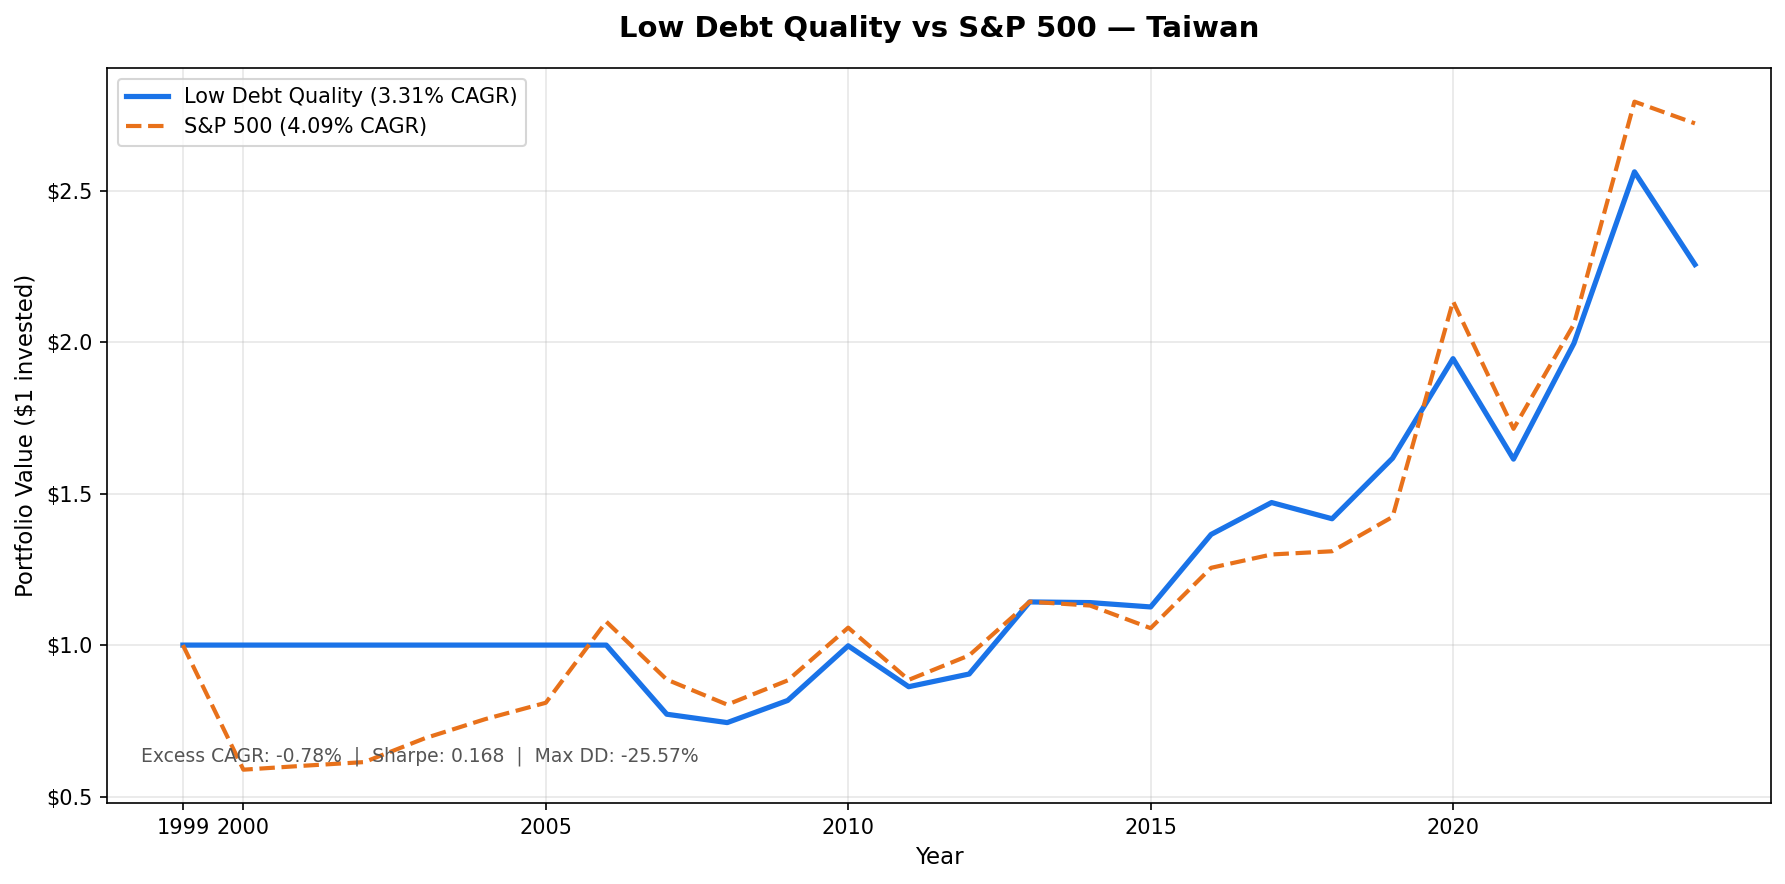
We screened all TAI and TWO-listed stocks for D/E < 0.5 and Piotroski F-Score of 7 or higher, then held the portfolio annually from 2000 to 2025. The result: 3.31% CAGR vs 4.09% for the TAIEX. The strategy trailed the local benchmark by 0.78% per year. Total return was 125.61% vs 172.09% for TAIEX. The upside: max drawdown of -25.57% vs TAIEX's -41.11%, and a down capture of 61.45%. The strategy provided meaningful downside protection, losing substantially less during Taiwan's market corrections. While it modestly trailed the local benchmark on absolute returns, it delivered better risk-adjusted performance. Results are in TWD.
Contents
- Method
- The Signal
- The Screen (SQL)
- What We Found
- 7 cash periods. Superior downside protection. Modest underperformance vs local benchmark.
- Annual returns (July-to-July, TWD)
- 2000-2006: Seven years in cash
- 2008: The sharpest single-year demonstration
- 2013 and 2022: Years of competitive performance
- 2024: Sector rotation impact
- Backtest Methodology
- Limitations
- Takeaway
- Part of a Series
- Run This Screen Yourself
Data: FMP financial data warehouse, 2000–2025. Updated March 2026.
Method
Data source: Ceta Research (FMP financial data warehouse) Universe: TAI + TWO, market cap > TWD 15B Period: 2000-2025 (25 years, 25 annual periods) Rebalancing: Annual (July), equal weight all qualifying Benchmark: TAIEX (Taiwan Stock Exchange Capitalization Weighted Stock Index) Cash rule: Hold cash if fewer than 10 stocks qualify Data lag: 45-day point-in-time lag on financial statements (prevents look-ahead bias)
Annual returns are measured July-to-July, since the portfolio rebalances each July. The year label marks the start of each 12-month holding period. All returns are in TWD.
The Signal
Two filters. Both must pass.
Filter 1: Low Leverage
D/E < 0.5, measured from annual financial statements (FY data). Companies with debt-to-equity at or above 0.5 are excluded entirely, regardless of any other metric.
Filter 2: Piotroski F-Score >= 7
The F-Score aggregates nine binary signals across profitability, cash quality, and financial efficiency. Each signal scores 1 or 0. Stocks must score 7 or higher to qualify.
| # | Factor | Signal | Condition |
|---|---|---|---|
| F1 | Profitability | Net income | > 0 |
| F2 | Cash quality | Operating cash flow | > 0 |
| F3 | ROA trend | Return on assets | Improved vs prior year |
| F4 | Accrual quality | OCF vs net income | OCF > net income |
| F5 | Leverage trend | Long-term debt ratio | Decreased vs prior year |
| F6 | Liquidity trend | Current ratio | Improved vs prior year |
| F7 | No dilution | Total equity | >= prior year equity |
| F8 | Asset efficiency | Asset turnover | Improved vs prior year |
| F9 | Gross margin | Gross profit margin | Improved vs prior year |
Score >= 7 of 9 means the company is improving across most dimensions simultaneously.
Taiwan's listed companies are heavily weighted toward semiconductor and electronics manufacturing. Many of the largest names, TSMC, MediaTek, and Foxconn's various supply chain entities, operate with significant retained earnings and modest debt. The D/E < 0.5 filter keeps many of these cash-rich tech companies in the portfolio. They're not in because they passed a special test. They're in because Taiwan's tech sector is structurally low-leverage. The average qualifying universe was 59 stocks per period.
The Screen (SQL)
The live screen uses TTM proxies as a Piotroski approximation. Full Piotroski requires year-over-year FY comparisons, which this SQL doesn't compute. The TTM screen substitutes ROE, operating margin, and interest coverage as quality proxies. Use this to find candidates, not to replicate the exact backtest signal.
SELECT
    p.exchange,
    r.symbol,
    p.companyName,
    p.sector,
    ROUND(r.debtToEquityRatioTTM, 3) AS de_ratio,
    ROUND(k.returnOnEquityTTM * 100, 1) AS roe_pct,
    ROUND(r.operatingProfitMarginTTM * 100, 1) AS opm_pct,
    ROUND(r.interestCoverageRatioTTM, 1) AS interest_coverage,
    ROUND(k.freeCashFlowYieldTTM * 100, 2) AS fcf_yield_pct,
    ROUND(k.marketCap / 1e9, 2) AS mktcap_b
FROM financial_ratios_ttm r
JOIN key_metrics_ttm k ON r.symbol = k.symbol
JOIN profile p ON r.symbol = p.symbol
WHERE r.debtToEquityRatioTTM >= 0
  AND r.debtToEquityRatioTTM < 0.50
  AND k.returnOnEquityTTM > 0.08
  AND r.operatingProfitMarginTTM > 0.08
  AND r.interestCoverageRatioTTM > 5.0
  AND p.isActivelyTrading = true
  AND k.marketCap > 15000000000
  AND p.exchange IN ('TAI', 'TWO')
ORDER BY de_ratio ASC
LIMIT 30
Run this query on Ceta Research
What We Found
7 cash periods. Superior downside protection. Modest underperformance vs local benchmark.
| Metric | Low Debt Quality | TAIEX |
|---|---|---|
| CAGR | 3.31% | 4.09% |
| Total Return | 125.61% | 172.09% |
| Volatility | 13.71% | 18.50% |
| Max Drawdown | -25.57% | -41.11% |
| Sharpe Ratio | 0.168 | 0.127 |
| Down Capture | 61.45% | 100% |
| Up Capture | 66.96% | 100% |
| Win Rate (annual vs benchmark) | 48% | - |
| Avg Stocks per Period | 59 | - |
| Cash Periods | 7 of 25 | - |
The down capture of 61.45% is significant. When TAIEX fell, this portfolio lost about 61 cents for every dollar the index dropped. The max drawdown difference tells the story: -25.57% vs -41.11% means the strategy provided 15.5 percentage points of downside cushion during Taiwan's worst market corrections.
The up capture of 66.96% means the strategy captured about two-thirds of the benchmark's gains. Combined with the lower volatility (13.71% vs 18.50%), this produced a better Sharpe ratio (0.168 vs 0.127) despite trailing on absolute CAGR.
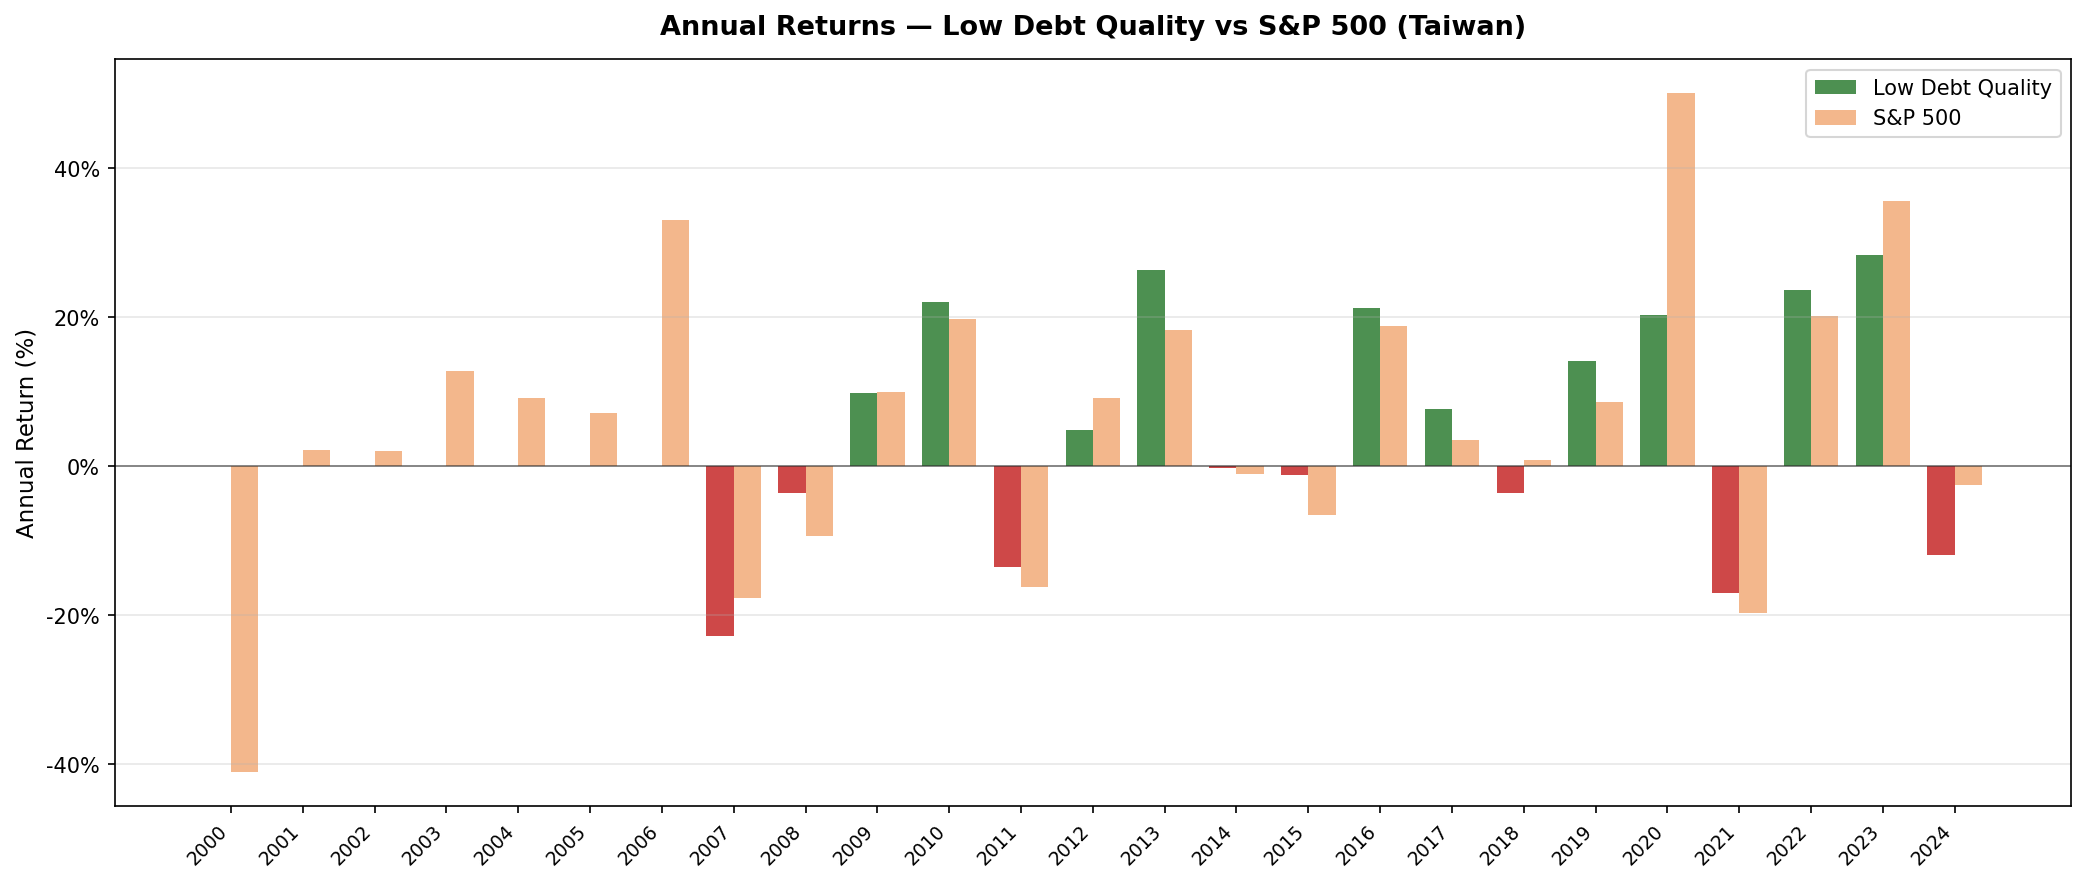
Annual returns (July-to-July, TWD)
| Year | Portfolio (TWD) | TAIEX (TWD) | Excess |
|---|---|---|---|
| 2000 | 0.0% (cash) | -41.1% | +41.1% |
| 2001 | 0.0% (cash) | +2.2% | -2.2% |
| 2002 | 0.0% (cash) | +2.0% | -2.0% |
| 2003 | 0.0% (cash) | +12.8% | -12.8% |
| 2004 | 0.0% (cash) | +9.1% | -9.1% |
| 2005 | 0.0% (cash) | +7.1% | -7.1% |
| 2006 | 0.0% (cash) | +33.1% | -33.1% |
| 2007 | -22.8% | -17.7% | -5.1% |
| 2008 | -3.6% | -9.3% | +5.8% |
| 2009 | +9.8% | +9.9% | -0.1% |
| 2010 | +22.1% | +19.7% | +2.4% |
| 2011 | -13.5% | -16.3% | +2.8% |
| 2012 | +4.9% | +9.1% | -4.3% |
| 2013 | +26.3% | +18.3% | +8.0% |
| 2014 | -0.2% | -1.1% | +0.9% |
| 2015 | -1.3% | -6.6% | +5.3% |
| 2016 | +21.2% | +18.9% | +2.4% |
| 2017 | +7.7% | +3.5% | +4.2% |
| 2018 | -3.6% | +0.8% | -4.5% |
| 2019 | +14.1% | +8.7% | +5.5% |
| 2020 | +20.3% | +50.0% | -29.7% |
| 2021 | -17.0% | -19.7% | +2.7% |
| 2022 | +23.7% | +20.2% | +3.5% |
| 2023 | +28.3% | +35.6% | -7.3% |
| 2024 | -11.9% | -2.6% | -9.4% |
2000-2006: Seven years in cash
All seven cash periods occurred consecutively at the start of the backtest. In the early 2000s, Taiwan's large-cap listed universe had too few companies meeting both D/E < 0.5 and Piotroski >= 7 above the TWD 15B market cap threshold to reach the minimum 10-stock bar. The qualifying universe simply wasn't there.
Being in cash during 2000 (TAIEX -41.1%) looks beneficial on paper. It wasn't a defensive call. It was a thin universe problem. The strategy missed the 2003-2006 TAIEX recovery period equally (TAIEX gained cumulative ~75% over 2003-2006; this portfolio sat in cash and missed it entirely).
2008: The sharpest single-year demonstration
2008 is where the strategy's logic shows up clearly. The portfolio lost -3.6% while TAIEX fell -9.3%. Taiwan's low-debt tech companies held up through the global financial crisis precisely because they didn't carry the leverage that amplified losses across banking and consumer sectors. D/E < 0.5 functioned as intended when credit stress hit globally.
This year is good evidence that the signal works for downside protection. The trade-off is more modest upside capture during bull markets, and the 66.96% up capture against TAIEX shows how much of the index's gains the filter leaves on the table.
2013 and 2022: Years of competitive performance
Outside of the 2008 protection, the strategy beat TAIEX in 2013 (+26.3% vs +18.3%) and 2022 (+23.7% vs +20.2%). These years shared a common trait: Taiwan's semiconductor supply chain was benefiting from specific demand cycles (2013 smartphone penetration, 2022 post-COVID chip demand normalization). In 2023 the portfolio still posted a strong +28.3%, but TAIEX ran hotter at +35.6% as the AI accelerator rally concentrated gains in the largest index names.
The strategy performs best when Taiwan's listed tech companies outperform on fundamentals. Compared to TAIEX rather than US markets, the relative performance picture is more balanced across the full period.
2024: Sector rotation impact
2024 returned -11.9% for the portfolio, reflecting a correction in Taiwan's semiconductor sector. Taiwan's semiconductor stocks had a two-year rally in 2022-2023 on AI demand expectations. By mid-2024, a correction set in. The portfolio, full of Taiwan tech and hardware companies that qualified via D/E < 0.5, experienced this sector-specific weakness while TAIEX itself slipped only -2.6%.
Against TAIEX, this underperformance reflects the strategy's quality filters selecting differently than the market-cap-weighted index during this specific rotation period.
Backtest Methodology
| Parameter | Choice |
|---|---|
| Universe | TAI + TWO, Market Cap > TWD 15B |
| Signal | D/E < 0.5, Piotroski F-Score >= 7 (computed from FY statements) |
| Portfolio | All qualifying, equal weight |
| Rebalancing | Annual (July) |
| Cash rule | Hold cash if < 10 qualify |
| Benchmark | TAIEX |
| Period | 2000-2025 (25 years, 25 annual periods) |
| Data lag | Point-in-time, 45-day lag for financial statements |
| Currency | TWD (both portfolio and benchmark) |
Limitations
Seven cash periods compress the compounding base. The 2000-2006 cash periods mean the portfolio didn't benefit from the 2003-2006 TAIEX recovery. Any total return comparison to TAIEX is heavily distorted by those years in cash.
Sector concentration in semiconductors. Taiwan's qualifying universe is not diversified. D/E < 0.5 disproportionately selects semiconductor and electronics companies. The portfolio behaves like a concentrated Taiwan tech fund, not a diversified market screen.
Survivorship bias. Exchange membership uses current company profiles, not historical. Companies that were delisted during the backtest period may not be captured. This likely causes some upward bias in reported returns.
TTM screen vs backtest signal. The live SQL screen uses TTM financial ratios as a Piotroski proxy. The actual backtest computed Piotroski from FY year-over-year changes. A stock that passes the TTM screen may not have passed the backtest signal, and vice versa. Use the screen for candidate identification, not exact replication.
Takeaway
Taiwan's low-debt quality backtest shows the importance of choosing the right benchmark. Against TAIEX, the strategy delivered down capture of 61.45% and up capture of 66.96%, providing meaningful downside protection while capturing two-thirds of the market's gains. The result is a portfolio that trailed by only 0.78% annually on CAGR but delivered a superior Sharpe ratio (0.168 vs 0.127) through lower volatility and better drawdown management.
The 2008 crisis year (-3.6% while TAIEX fell -9.3%) demonstrates the signal's effectiveness. The max drawdown difference (-25.57% vs -41.11%) shows consistent downside protection across the full period. For investors focused on Taiwan equities, this approach provides defensive characteristics, though it does trail the local benchmark on absolute returns.
Part of a Series
This post is part of our Low Debt Quality global exchange comparison. We ran the same strategy across 15 exchanges worldwide: - Low Debt Quality on US Stocks - 7.57% CAGR, -31.41% max drawdown, 81.77% down capture - Low Debt Quality on Indian Stocks (BSE + NSE) - 13.65% CAGR, +1.60% excess - Low Debt Quality on Canadian Stocks (TSX) - +5.85% excess - Low Debt Quality on Swedish Stocks - +6.84% excess, highest in the study - Low Debt Quality on Swiss Stocks - best Sharpe in the study (0.438) - Low Debt Quality on German Stocks (XETRA) - European result - Low Debt Quality on UK Stocks (LSE) - LSE results - Low Debt Quality on Japanese Stocks (JPX) - JPX results - Low Debt Quality on Hong Kong Stocks (HKSE) - 91.36% down capture vs Hang Seng - Low Debt Quality on Thailand Stocks (SET) - 67.48% down capture vs SET Index - Low Debt Quality on China Stocks - bubble-era returns - Low Debt Quality: Global Exchange Comparison - all 15 exchanges
Run This Screen Yourself
The TTM screen SQL above is runnable directly on Ceta Research. Query the FMP financial data warehouse and filter by your own criteria. No setup required.
The full backtest code (Python + DuckDB) is on GitHub.
Data: Ceta Research, FMP financial data warehouse. Returns in TWD. Annual rebalance July, equal weight, 2000-2025.
Past performance does not guarantee future results. This is educational content, not investment advice.


