Low Debt Quality on Hong Kong (HKSE): Underperformance With a Cushion

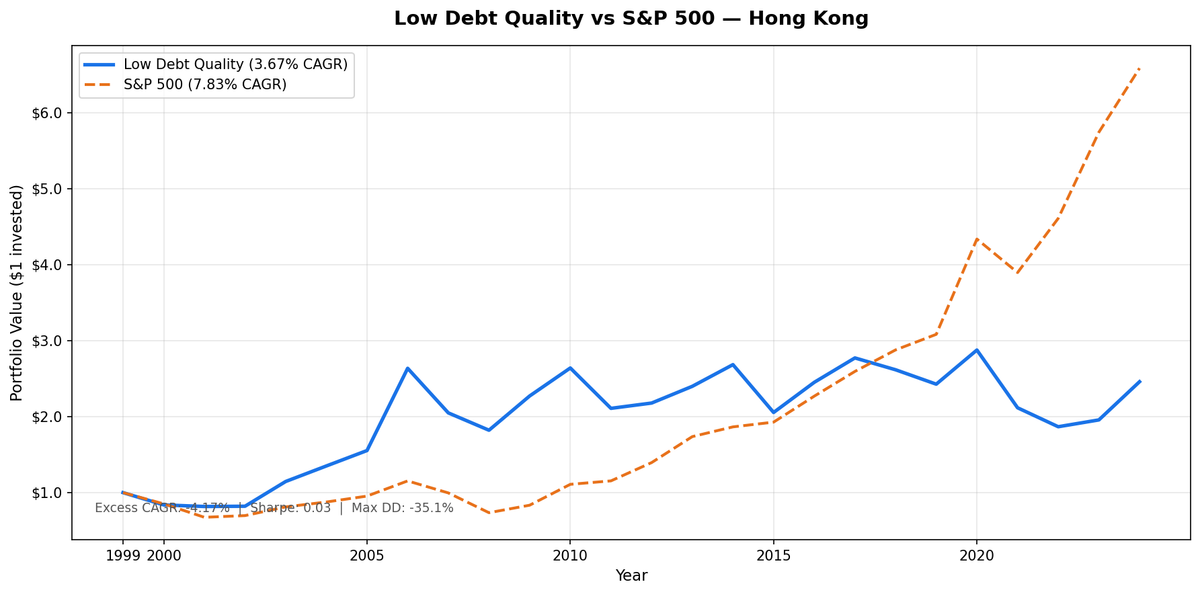
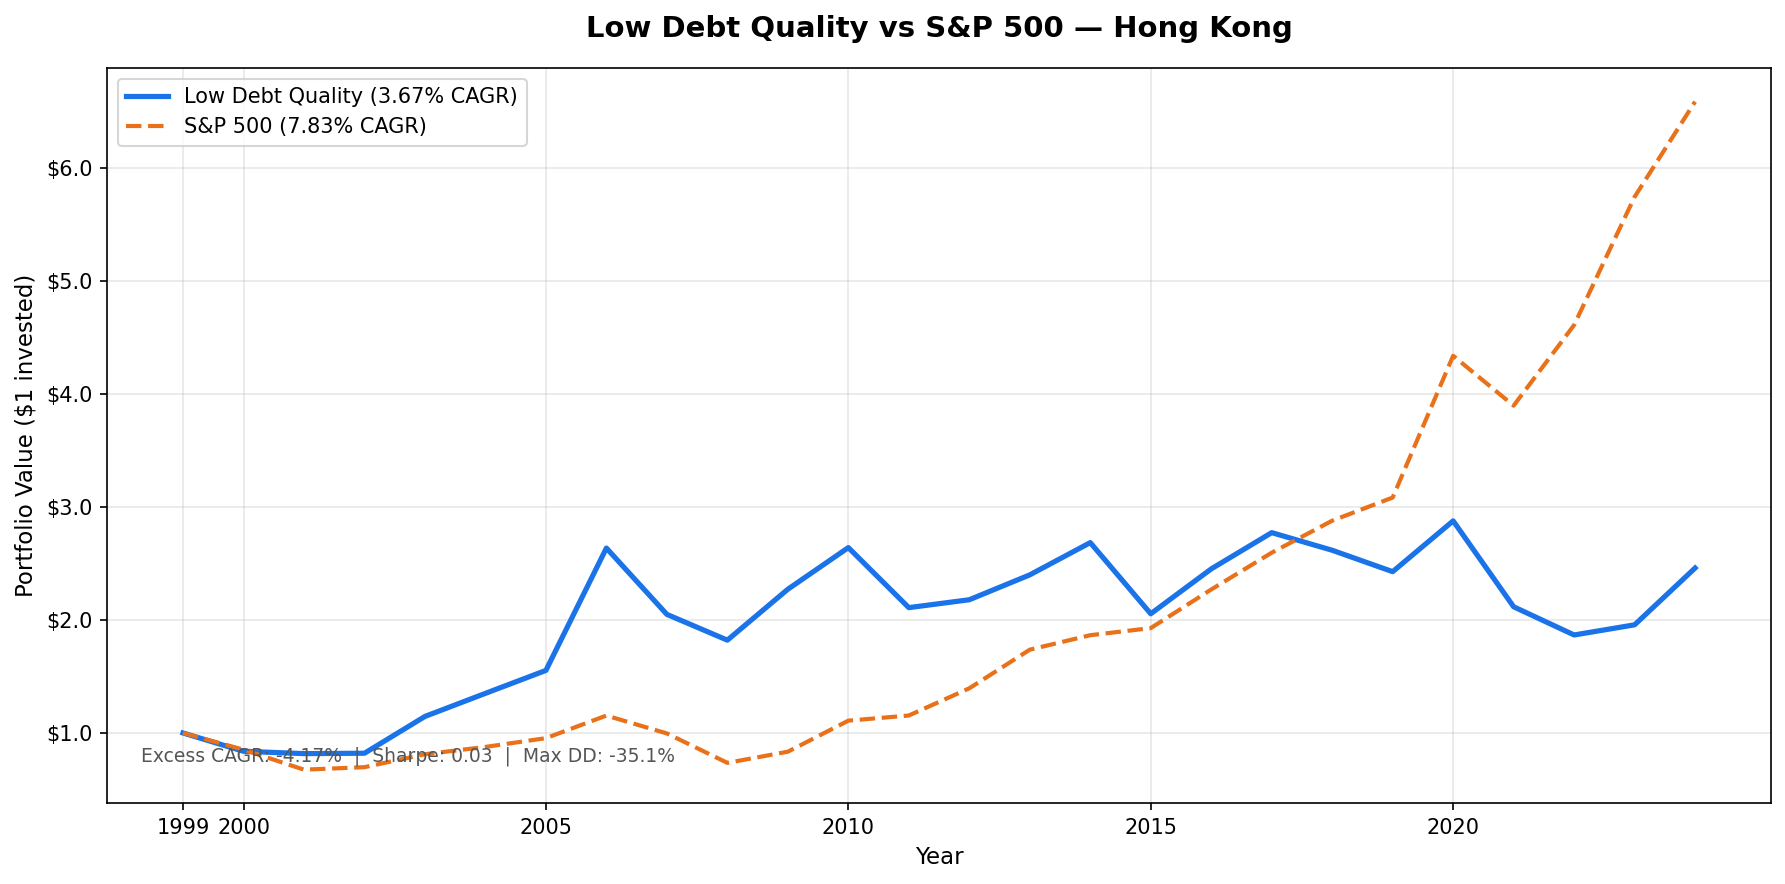
We screened all HKSE-listed stocks for D/E < 0.5 and Piotroski F-Score of 7 or higher, then held the portfolio annually from 2000 to 2025. The result: 3.67% CAGR vs 7.83% for SPY. The strategy trailed by 4.17% per year. Total return was 146.01% vs 558.69% for SPY. That's the honest headline. The other side: max drawdown of -35.10% vs SPY's -36.27%, and a down capture of 91.71%. The portfolio nearly matched SPY's worst losses while delivering less than a third of the long-run return. Results are in HKD.
Contents
- Method
- The Signal
- The Screen (SQL)
- What We Found
- 25 years. Consistently behind SPY. Drawdown nearly identical.
- Annual returns (July-to-July, HKD vs SPY USD)
- 2006: The China boom exception
- 2001-2009: The only sustained stretch that worked
- 2010 onward: Consistent deterioration
- 2024: The only recent bright spot
- Backtest Methodology
- Limitations
- Takeaway
- Part of a Series
- Run This Screen Yourself
Method
- Data source: Ceta Research (FMP financial data warehouse)
- Universe: HKSE, market cap > HKD 4B
- Period: 2000-2025 (25 years, 25 annual periods)
- Rebalancing: Annual (July), equal weight all qualifying
- Benchmark: S&P 500 Total Return (SPY)
- Cash rule: Hold cash if fewer than 10 stocks qualify
- Data lag: 45-day point-in-time lag on financial statements (prevents look-ahead bias)
Annual returns are measured July-to-July, since the portfolio rebalances each July. The year label marks the start of each 12-month holding period. Returns are in HKD; SPY returns are in USD. The comparison captures strategy performance in local terms, not currency-adjusted.
The Signal
Two filters. Both must pass.
Filter 1: Low Leverage
D/E < 0.5, measured from annual financial statements (FY data). Companies with debt-to-equity at or above 0.5 are excluded entirely, regardless of any other metric.
Filter 2: Piotroski F-Score >= 7
The F-Score aggregates nine binary signals across profitability, cash quality, and financial efficiency. Each signal scores 1 or 0. Stocks must score 7 or higher to qualify.
| # | Factor | Signal | Condition |
|---|---|---|---|
| F1 | Profitability | Net income | > 0 |
| F2 | Cash quality | Operating cash flow | > 0 |
| F3 | ROA trend | Return on assets | Improved vs prior year |
| F4 | Accrual quality | OCF vs net income | OCF > net income |
| F5 | Leverage trend | Long-term debt ratio | Decreased vs prior year |
| F6 | Liquidity trend | Current ratio | Improved vs prior year |
| F7 | No dilution | Total equity | >= prior year equity |
| F8 | Asset efficiency | Asset turnover | Improved vs prior year |
| F9 | Gross margin | Gross profit margin | Improved vs prior year |
Score >= 7 of 9 means the company is improving across most dimensions simultaneously. Companies in financial distress or deteriorating fundamentals rarely score this high.
The combination selects companies that are both conservatively financed and operationally improving. The average qualifying universe in Hong Kong was 62 stocks per period, so this is a reasonably populated filter on the HKSE.
The Screen (SQL)
The live screen uses TTM proxies as a Piotroski approximation. Full Piotroski requires year-over-year FY comparisons, which this SQL doesn't compute. The TTM screen substitutes ROE, operating margin, and interest coverage as quality proxies. Use this to find candidates, not to replicate the exact backtest signal.
SELECT
    p.exchange,
    r.symbol,
    p.companyName,
    p.sector,
    ROUND(r.debtToEquityRatioTTM, 3) AS de_ratio,
    ROUND(k.returnOnEquityTTM * 100, 1) AS roe_pct,
    ROUND(r.operatingProfitMarginTTM * 100, 1) AS opm_pct,
    ROUND(r.interestCoverageRatioTTM, 1) AS interest_coverage,
    ROUND(k.freeCashFlowYieldTTM * 100, 2) AS fcf_yield_pct,
    ROUND(k.marketCap / 1e9, 2) AS mktcap_b
FROM financial_ratios_ttm r
JOIN key_metrics_ttm k ON r.symbol = k.symbol
JOIN profile p ON r.symbol = p.symbol
WHERE r.debtToEquityRatioTTM >= 0
  AND r.debtToEquityRatioTTM < 0.50
  AND k.returnOnEquityTTM > 0.08
  AND r.operatingProfitMarginTTM > 0.08
  AND r.interestCoverageRatioTTM > 5.0
  AND p.isActivelyTrading = true
  AND k.marketCap > 4000000000
  AND p.exchange IN ('HKSE')
ORDER BY de_ratio ASC
LIMIT 30
Run this query on Ceta Research
What We Found
25 years. Consistently behind SPY. Drawdown nearly identical.
| Metric | Low Debt Quality | S&P 500 (SPY) |
|---|---|---|
| CAGR | 3.67% | 7.83% |
| Total Return | 146.01% | 558.69% |
| Volatility | 22.0% | 15.00% |
| Max Drawdown | -35.10% | -36.27% |
| Sharpe Ratio | 0.030 | 0.38 |
| Down Capture | 91.71% | 100% |
| Up Capture | 71.1% | 100% |
| Win Rate (annual vs SPY) | 40% | - |
| Avg Stocks per Period | 62 | - |
| Cash Periods | 0 of 25 | - |
The portfolio was fully invested every year. 62 stocks on average at each rebalance. The win rate of 40% means it beat SPY in only 10 of 25 annual periods. The up capture of 71.1% is the structural problem: the strategy captures only 71 cents of every dollar the market gains, but 92 cents of every dollar it loses. That's a poor risk-return tradeoff.
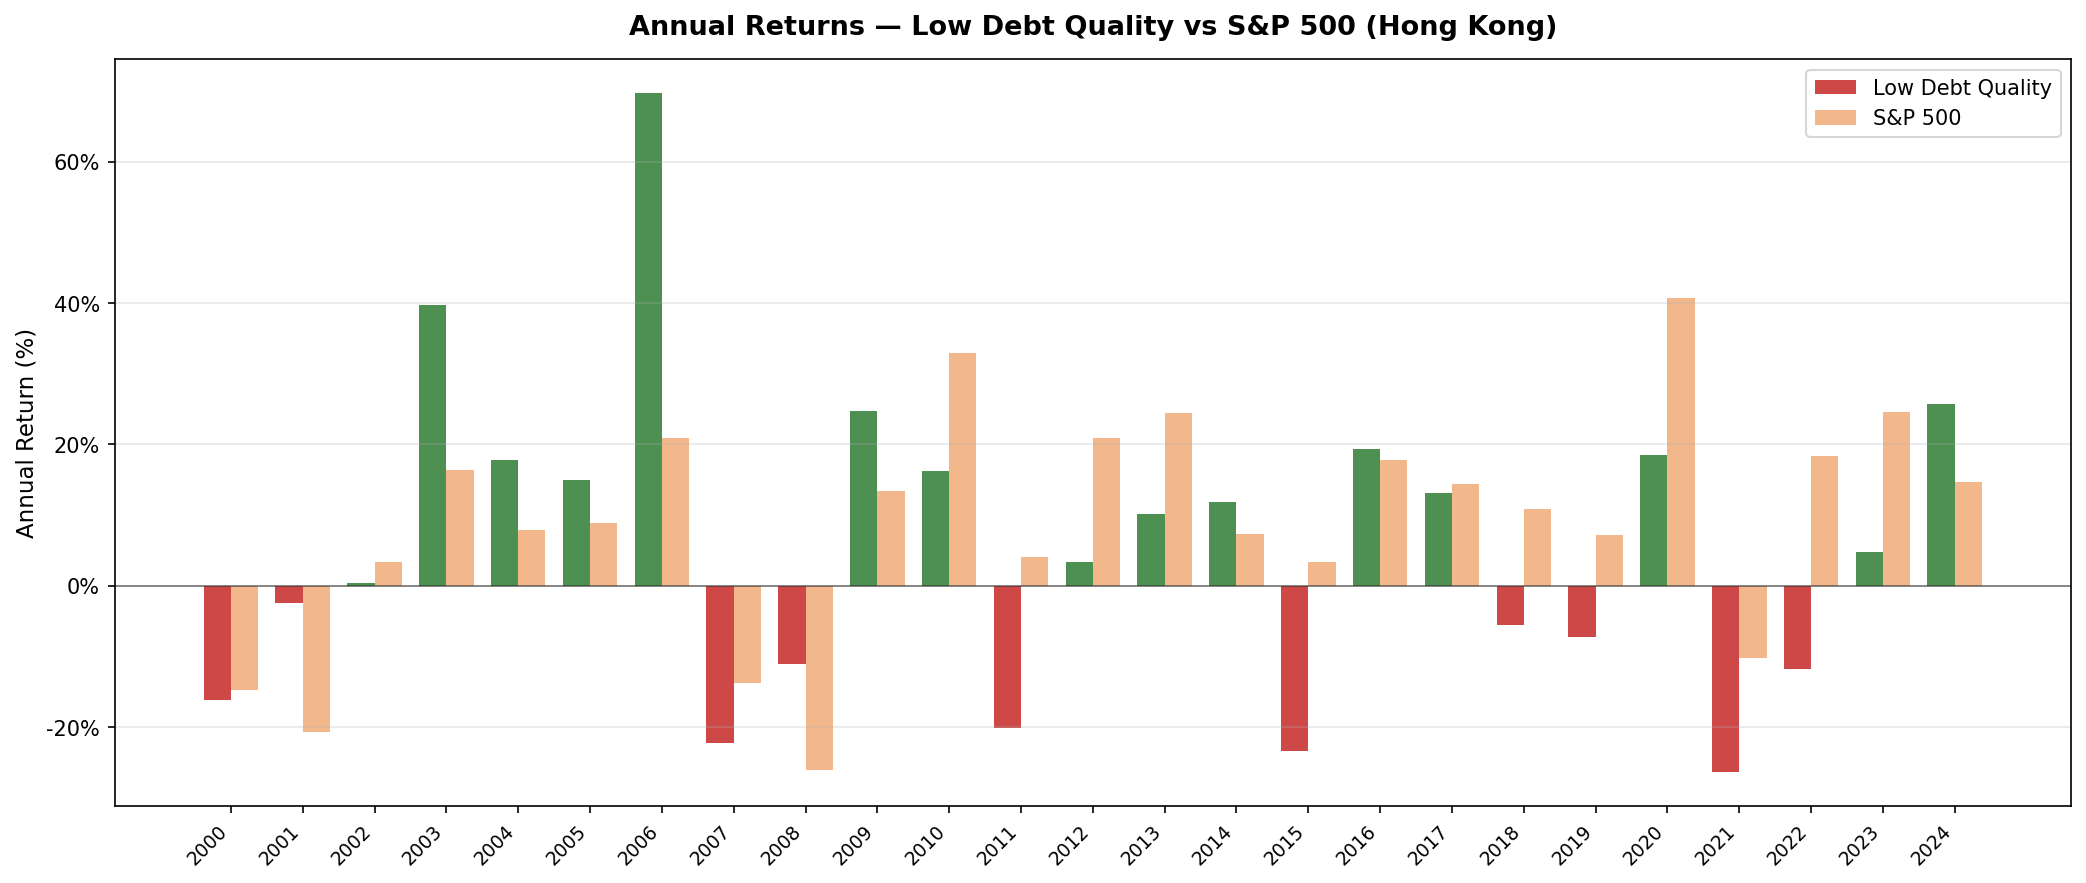
Annual returns (July-to-July, HKD vs SPY USD)
| Year | Portfolio (HKD) | SPY (USD) | Excess |
|---|---|---|---|
| 2000 | -16.2% | -14.8% | -1.4% |
| 2001 | -2.5% | -20.8% | +18.3% |
| 2002 | +0.4% | +3.3% | -2.9% |
| 2003 | +39.7% | +16.4% | +23.2% |
| 2004 | +17.8% | +7.9% | +9.9% |
| 2005 | +15.0% | +8.9% | +6.2% |
| 2006 | +69.7% | +20.9% | +48.7% |
| 2007 | -22.3% | -13.7% | -8.6% |
| 2008 | -11.1% | -26.1% | +15.0% |
| 2009 | +24.7% | +13.4% | +11.3% |
| 2010 | +16.2% | +32.9% | -16.7% |
| 2011 | -20.1% | +4.1% | -24.2% |
| 2012 | +3.3% | +20.9% | -17.5% |
| 2013 | +10.1% | +24.5% | -14.4% |
| 2014 | +11.9% | +7.4% | +4.5% |
| 2015 | -23.4% | +3.4% | -26.8% |
| 2016 | +19.3% | +17.7% | +1.6% |
| 2017 | +13.1% | +14.3% | -1.2% |
| 2018 | -5.6% | +10.9% | -16.5% |
| 2019 | -7.2% | +7.1% | -14.4% |
| 2020 | +18.5% | +40.7% | -22.2% |
| 2021 | -26.4% | -10.2% | -16.2% |
| 2022 | -11.8% | +18.3% | -30.1% |
| 2023 | +4.8% | +24.6% | -19.8% |
| 2024 | +25.7% | +14.7% | +11.0% |
2006: The China boom exception
The one year that distorts the picture is 2006. The portfolio returned +69.7% in HKD, beating SPY by 48.7 percentage points. This wasn't the strategy finding alpha. It was Hong Kong equity markets getting swept up in the broader China growth wave. The Shanghai Composite was rising over 100% that same year. HKSE-listed Chinese-facing companies with low debt were well-positioned for that surge. Don't read 2006 as evidence the strategy works in Hong Kong. It's a single commodity boom year.
2001-2009: The only sustained stretch that worked
The strategy's best case was the first decade. From 2001 through 2009, the portfolio outperformed SPY in 6 of 9 years. The 2001 excess of +18.3% came from HK-listed companies being insulated from the dot-com bust that hit US names hardest. The 2003 surge (+39.7%) was post-SARS recovery in Asian markets. The 2008 protection was genuine: -11.1% vs SPY's -26.1%, a 15-point gap.
But this period included the 2006 outlier. Strip that year out and the picture is more modest.
2010 onward: Consistent deterioration
From 2010 to 2023, the strategy underperformed SPY in 11 of 14 years. The 2015 result (-23.4% vs +3.4%) captures the year Hong Kong markets fell hard on China growth slowdown fears. The 2021 collapse (-26.4% vs -10.2%) reflected Beijing's regulatory crackdown on tech platforms and property developers. The 2022 result (-11.8% vs +18.3%, a -30.1% gap) was one of the worst single years in the study.
The D/E < 0.5 filter can't protect against macro and regulatory tail risks. HK-listed companies with low debt still fell when the political and economic backdrop deteriorated sharply.
2024: The only recent bright spot
The strategy returned +25.7% in 2024 vs SPY +14.7%, an +11.0% excess. Expectations for a China stimulus recovery drove a partial rebound in HK-listed equities. Whether this persists is unknown, but it's the first meaningful outperformance year since 2014.
Backtest Methodology
| Parameter | Choice |
|---|---|
| Universe | HKSE, Market Cap > HKD 4B |
| Signal | D/E < 0.5, Piotroski F-Score >= 7 (computed from FY statements) |
| Portfolio | All qualifying, equal weight |
| Rebalancing | Annual (July) |
| Cash rule | Hold cash if < 10 qualify |
| Benchmark | S&P 500 Total Return (SPY) |
| Period | 2000-2025 (25 years, 25 annual periods) |
| Data lag | Point-in-time, 45-day lag for financial statements |
| Currency | HKD (portfolio) vs USD (SPY) |
Limitations
Currency mismatch. The portfolio returns are in HKD; SPY returns are in USD. The HKD is pegged to the USD at approximately 7.75-7.85, so the currency mismatch is small historically. But it isn't zero, and it isn't accounted for in the excess return figures.
The 2006 outlier. A single year (+69.7%) contributes disproportionately to the total return figure. Excluding 2006, the compounding picture is substantially worse. Any interpretation of the Hong Kong results should hold 2006 separately.
Macro and geopolitical risk. The post-2019 deterioration in Hong Kong's economic and political environment created persistent headwinds that a quantitative screen can't anticipate or hedge. The 2019-2023 stretch was uniquely bad for HK equities broadly, and this strategy captured that downside.
Survivorship bias. Exchange membership uses current company profiles, not historical. Companies that were delisted during the backtest period may not be captured. This likely causes some upward bias in reported returns.
TTM screen vs backtest signal. The live SQL screen uses TTM financial ratios as a Piotroski proxy. The actual backtest computed Piotroski from FY year-over-year changes. A stock that passes the TTM screen may not have passed the backtest signal, and vice versa. Use the screen for candidate identification, not exact replication.
Takeaway
The Hong Kong backtest is a case study in how macro and political context can overwhelm a well-constructed signal. D/E < 0.5 plus Piotroski >= 7 finds real quality companies. Those companies still lost to SPY by 4.17% annually over 25 years, for a total return of 146% vs 559%.
The draw-down protection was minimal. The portfolio's -35.10% max drawdown barely improved on SPY's -36.27%. If you're running a low-debt quality screen specifically for downside protection, Hong Kong didn't deliver that in the critical 2015 and 2021 sell-offs.
The 2024 rebound (+25.7%) is the most recent data point, and it's the most positive in years. But a single year of recovery after a decade of underperformance isn't a reason to change the conclusion. Hong Kong isn't where this strategy earns its keep.
Part of a Series
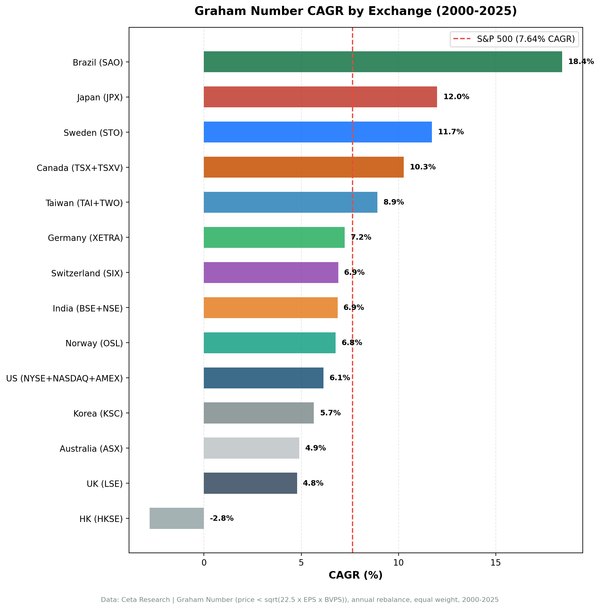
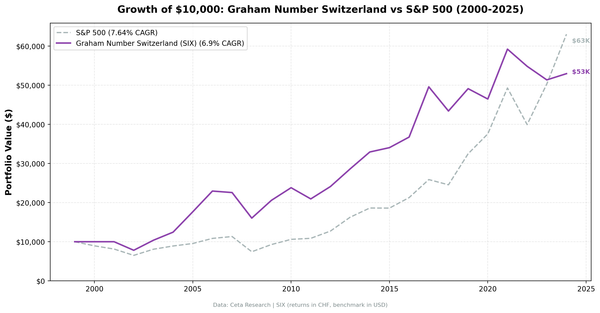
This post is part of our Low Debt Quality global exchange comparison. We ran the same strategy across 15 exchanges worldwide: - Low Debt Quality on US Stocks - 7.09% CAGR, -29.77% max drawdown, 82.83% down capture - Low Debt Quality on Indian Stocks (BSE + NSE) - 14.05% CAGR, +6.22% excess - Low Debt Quality on Canadian Stocks (TSX) - +1.33% excess - Low Debt Quality on Swedish Stocks - +1.14% excess - Low Debt Quality on Swiss Stocks - best Sharpe in the study (0.429) - Low Debt Quality on German Stocks (XETRA) - European result - Low Debt Quality on UK Stocks (LSE) - LSE results - Low Debt Quality on Japanese Stocks (JPX) - JPX results - Low Debt Quality on Taiwan Stocks - tech-heavy universe - Low Debt Quality on Thailand Stocks (SET) - 26.48% down capture - Low Debt Quality on China Stocks - bubble-era returns - Low Debt Quality: Global Exchange Comparison - all 15 exchanges
Run This Screen Yourself
The TTM screen SQL above is runnable directly on Ceta Research. Query the FMP financial data warehouse and filter by your own criteria. No setup required.
The full backtest code (Python + DuckDB) is on GitHub.
Part of a Series: Global | US | UK | Thailand | Taiwan | Switzerland | Sweden | Japan
Run It Yourself
Explore the data behind this analysis on Ceta Research. Query our financial data warehouse with SQL, build custom screens, and run your own backtests across 70,000+ stocks on 20 exchanges.
Data: Ceta Research, FMP financial data warehouse. Returns in HKD. Annual rebalance July, equal weight, 2000-2025.