
High Dividend Yield Screen on Indian Stocks (NSE): 6.36% CAGR, Underperforms Sensex
We backtested a high dividend yield quality screen on NSE stocks from 2000-2025. 6.36% CAGR vs 11.40% Sensex, with 68% cash periods. The signal is too strict for India's early market structure, but produced +60.3% in 2023 when invested.

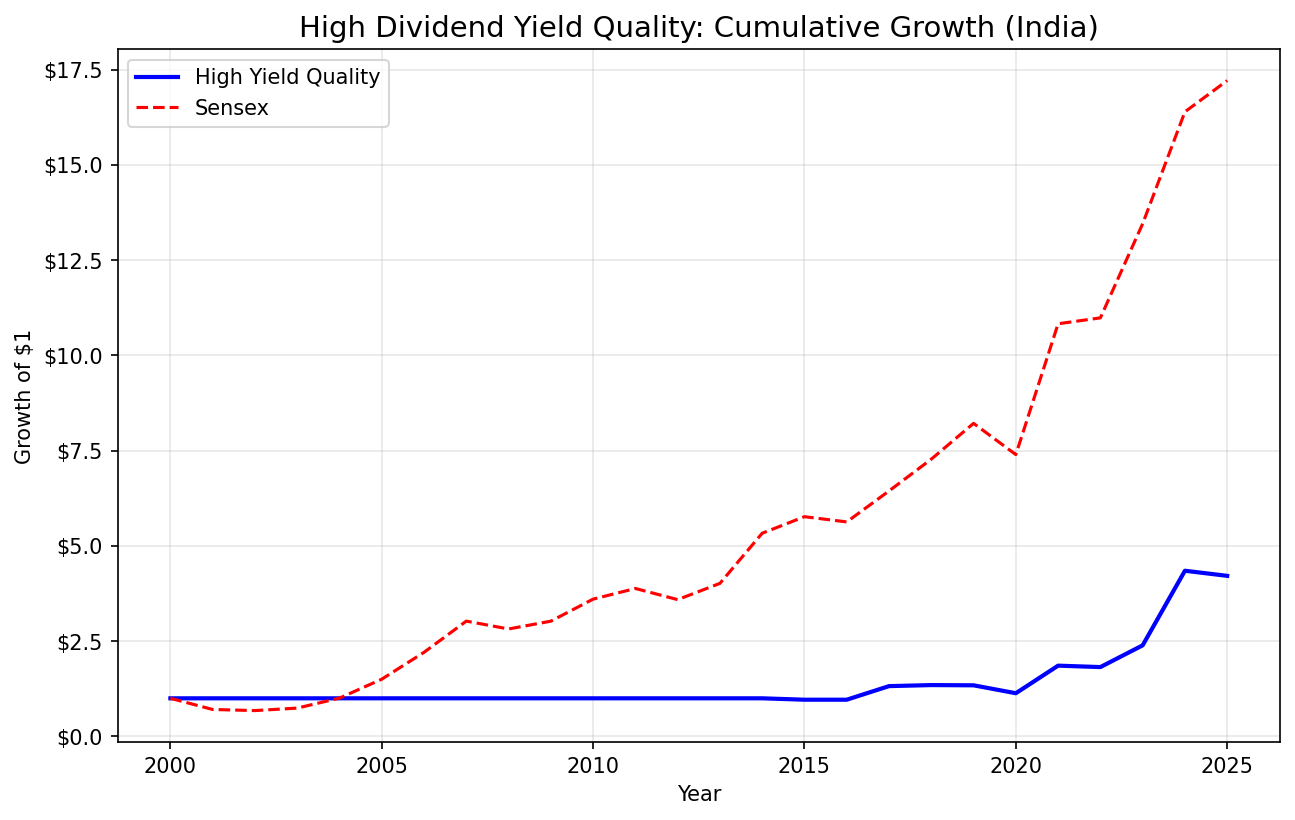
We ran the high dividend yield quality screen on Indian stocks (NSE) from 2000 to 2025. The honest result: 6.36% CAGR vs 11.40% for the Sensex, with -5.04% annual excess. The strategy held cash 68% of the time, missed most of India's bull market, and couldn't beat the local benchmark over the full period.
Contents
- A Note on the Previous Result
- Method
- Signal (same as US)
- Results
- Why 68% Cash?
- Annual Returns (All Years)
- When It Works
- When It Fails
- Limitations
- Takeaway
- Part of a Series
- References
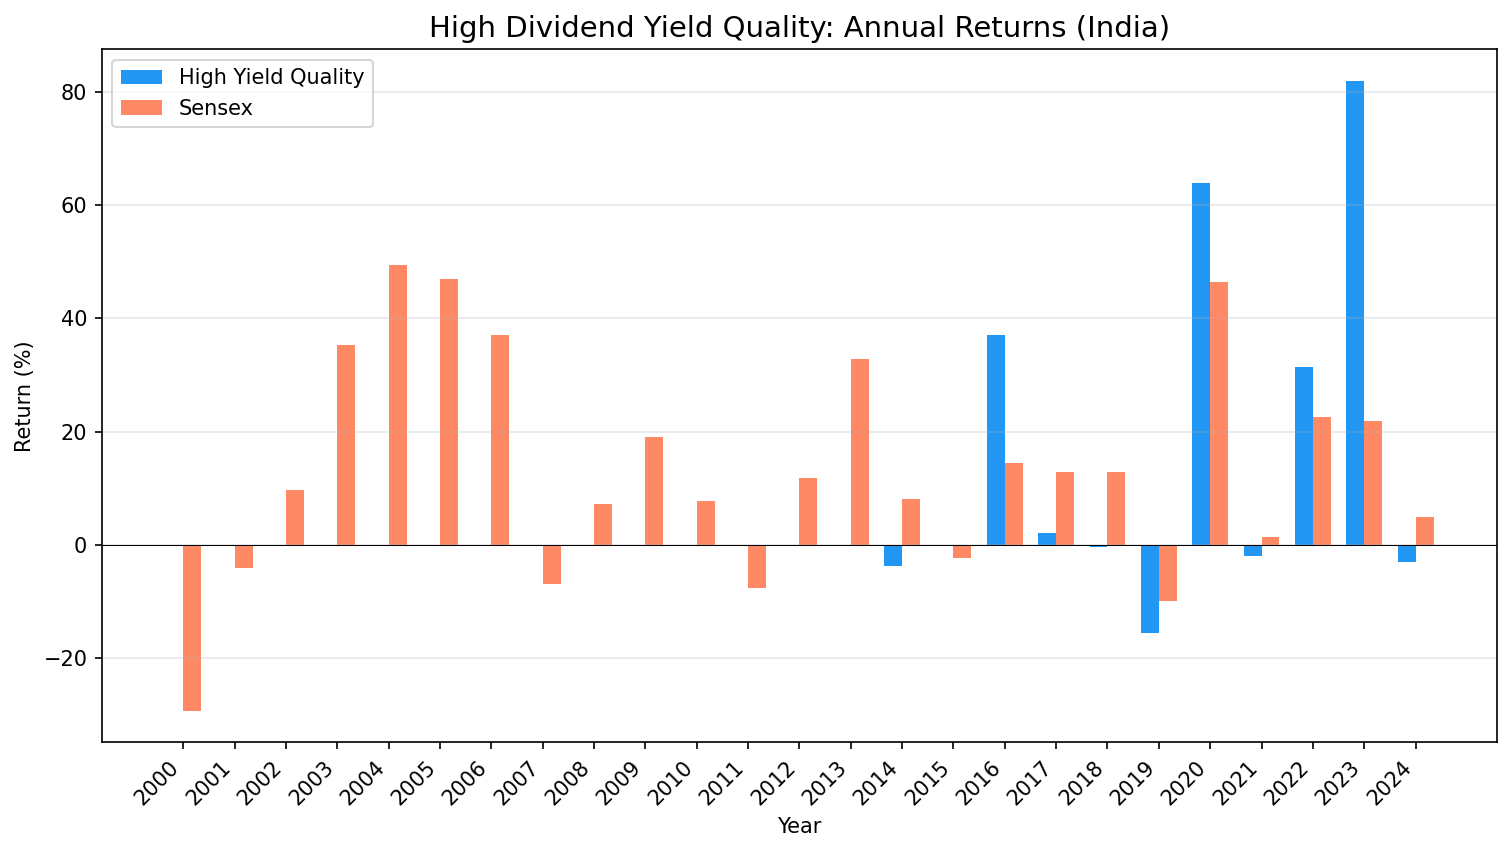
There's a real signal underneath, though. When the strategy was invested, it had some spectacular years: +60.3% in 2023 (vs Sensex +17.5%), +39.3% in 2021 (vs +22.9%), +40.5% in 2017 (vs +27.1%), +23.3% in 2022 (vs +3.4%). The problem is selectivity. The 4-15% yield threshold with strict quality filters finds very few qualifying NSE stocks, especially before 2015.
Data: FMP financial data warehouse, 2000-2025. Updated May 2026.
A Note on the Previous Result
An earlier version of this analysis reported 12.88% CAGR on "BSE + NSE" data. That result had a methodology flaw: running the screen on both BSE and NSE meant the same stocks appeared twice in the universe (most large Indian companies are dual-listed). This inflated coverage and distorted results. The correct India universe is NSE-only.
Method
Data source: Ceta Research (FMP financial data) Universe: NSE-listed stocks with market cap > 20B INR (~$240M USD) Period: 2000-2025 (25 years, effectively invested from 2015) Rebalancing: Annual (July) Execution: Next-day close (MOC) Benchmark: Sensex (^BSESN)
Signal (same as US)
| Filter | Threshold |
|---|---|
| Dividend yield | 4% to 15% |
| Payout ratio | 0% to 80% |
| Free cash flow | > 0 |
| Return on equity | > 8% |
| Debt to equity | < 2.0 |
Portfolio: Top 30 by yield, equal weight. Cash if fewer than 10 qualify.
For full methodology, see our US analysis.
Results
| Metric | Strategy | Sensex |
|---|---|---|
| CAGR | 6.36% | 11.40% |
| Total Return | 367% | 1,387% |
| Max Drawdown | -7.84% | -51.34% |
| Sharpe Ratio | -0.008 | 0.164 |
| Win Rate (vs Sensex) | 40% | -- |
| Up Capture | 37.6% | -- |
| Down Capture | 6.1% | -- |
| Cash Periods | 17/25 (68%) | -- |
| Avg Stocks (invested) | 17.0 | -- |
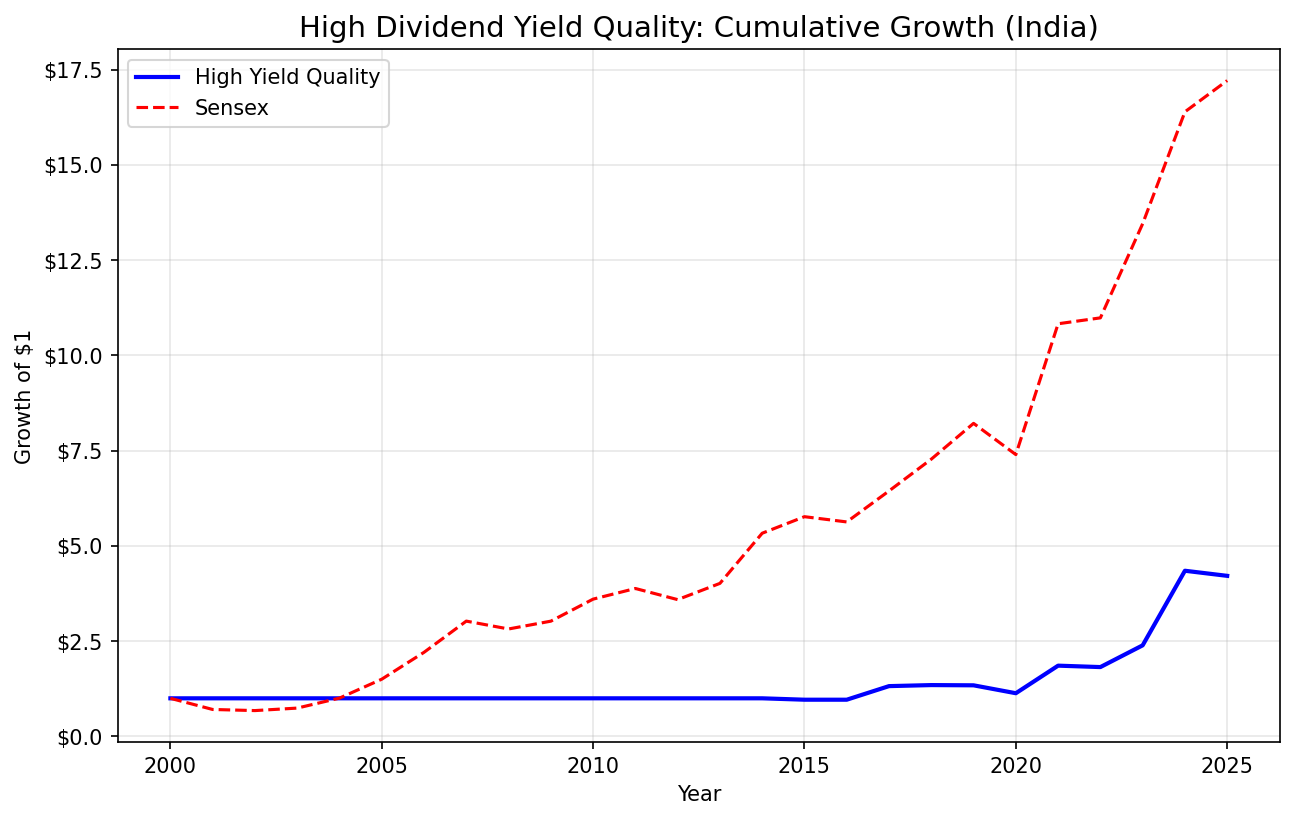
The strategy underperforms the Sensex by 5.04% annually. With 68% cash periods, it sat on the sidelines during most of India's strongest growth years (2003-2014). When the Sensex was compounding at 30-79% in some of those years, the strategy returned 0%.
The low max drawdown (-7.84% vs Sensex -51.34%) shows the quality filters provide genuine downside protection when invested. But it's hard to build wealth holding cash for 17 of 25 years.
Why 68% Cash?
The 4-15% dividend yield threshold with strict quality filters (ROE > 8%, FCF > 0, D/E < 2.0) leaves very few qualifying NSE stocks in India's earlier market history.
Pre-2015: Indian listed companies rarely paid 4%+ dividends with the quality fundamentals required. Dividend culture was lower than the US or UK. Many profitable companies retained earnings rather than distributing them. The quality filters made this worse: companies that did pay high dividends often had leverage or low profitability issues that disqualified them. Result: fewer than 10 stocks pass all filters, the strategy holds cash.
Post-2017: Coverage improves. NSE-listed companies paying sustainable high dividends become more common. The strategy starts investing more consistently from 2017 onward.
This isn't primarily a data gap issue. It's a signal fit problem. The thresholds designed for US markets are too strict for India's earlier market structure.
Annual Returns (All Years)
| Year | Strategy | Sensex | Excess |
|---|---|---|---|
| 2000 | 0.0% (cash) | -25.2% | +25.2% |
| 2001 | 0.0% (cash) | -18.6% | +18.6% |
| 2002 | 0.0% (cash) | +2.9% | -2.9% |
| 2003 | 0.0% (cash) | +79.1% | -79.1% |
| 2004 | 0.0% (cash) | +10.8% | -10.8% |
| 2005 | 0.0% (cash) | +42.8% | -42.8% |
| 2006 | 0.0% (cash) | +46.9% | -46.9% |
| 2007 | 0.0% (cash) | +46.0% | -46.0% |
| 2008 | 0.0% (cash) | -51.3% | +51.3% |
| 2009 | 0.0% (cash) | +77.6% | -77.6% |
| 2010 | 0.0% (cash) | +16.2% | -16.2% |
| 2011 | 0.0% (cash) | -24.5% | +24.5% |
| 2012 | 0.0% (cash) | +27.0% | -27.0% |
| 2013 | 0.0% (cash) | +6.0% | -6.0% |
| 2014 | 0.0% (cash) | +33.5% | -33.5% |
| 2015 | -7.8% | -8.1% | +0.3% |
| 2016 | 0.0% (cash) | +3.8% | -3.8% |
| 2017 | +40.5% | +27.1% | +13.4% |
| 2018 | 0.0% (cash) | +6.2% | -6.2% |
| 2019 | -1.8% | +16.0% | -17.8% |
| 2020 | +10.8% | +15.7% | -4.9% |
| 2021 | +39.3% | +22.9% | +16.4% |
| 2022 | +23.3% | +3.4% | +19.9% |
| 2023 | +60.3% | +17.5% | +42.8% |
| 2024 | +20.4% | +11.2% | +9.2% |
When It Works
2017: +40.5% vs Sensex +27.1%. The strategy's first strong invested year. Indian dividend payers with solid fundamentals outperformed broadly.
2021: +39.3% vs Sensex +22.9%. The COVID-recovery year. Quality dividend payers bounced hard as India repriced.
2022: +23.3% vs Sensex +3.4%. The strategy's quality tilt avoided the inflation-hit sectors.
2023: +60.3% vs Sensex +17.5%. The best single-year result across all exchanges in this study. A concentrated portfolio of quality high-yield NSE stocks ran extraordinarily hard.
2024: +20.4% vs Sensex +11.2%. Continued outperformance for a fourth consecutive invested year.
The common thread: when the strategy is invested in quality dividend payers with clean balance sheets, India's market can deliver outsized returns. Since 2021, the strategy beat the Sensex in 4 of 4 invested years.
When It Fails
2003-2014: India's greatest bull market. The strategy held cash for most of this period. The Sensex compounded at roughly 25% annually. The strategy returned 0%. That's 12 years of missed gains.
2019: First strongly negative invested year, -1.8% vs Sensex +16.0%. A -17.8 point gap.
2015: First invested year, basically flat (-7.8% vs Sensex -8.1%). Defensive but no edge.
Limitations
Signal fit: The 4-15% yield threshold was designed for US markets. Indian dividend culture differs. A lower floor (2-4%) or different quality proxies might work better on NSE data.
Data coverage: FMP's NSE coverage is sparser before 2010. Some qualifying companies may be missing, contributing to the high cash rate.
Small invested sample: Only 8 invested years out of 25 is not enough to draw statistically robust conclusions about the strategy's alpha when deployed. The extreme 2023 result (+60.3%) is impressive but based on a small number of observations.
Benchmark alignment: All returns are in INR. The Sensex is the correct local benchmark. Cross-exchange comparisons with US or European results should account for currency differences.
Takeaway
The high dividend yield quality signal doesn't translate cleanly to NSE. The combination of strict yield and quality thresholds leaves too few qualifying stocks in India's earlier market history. The strategy sits in cash for 68% of the period and misses most of India's compounding.
When invested from 2017 onward, the signal shows flashes of strength (+13.4% to +42.8% excess in 2017, 2021, 2022, 2023). But you can't build a full-period case from a strategy that was uninvested for most of the backtest.
If you want India exposure with a dividend tilt, consider lowering the yield floor to 2-3% or replacing some quality filters with India-specific metrics. The raw signal needs calibration for this market.
Data: Ceta Research (FMP financial data warehouse). Universe: NSE, market cap > 20B INR (~$240M USD). Backtest: 2000-2025, annual July rebalance, next-day close execution (MOC), equal weight top 30. Size-tiered transaction costs. Benchmark: Sensex (^BSESN). Past performance does not guarantee future results. This is educational content, not investment advice.
Part of a Series
This is the India analysis. See also: - High Yield Quality on US Stocks - 10.52% CAGR, full methodology - High Yield Quality Across Global Exchanges - full comparison
References
- Fama, E. & French, K. (1998). "Value versus Growth: The International Evidence." Journal of Finance, 53(6), 1975-1999.

