
EV/EBITDA Sector-Relative Value Across 15 Global Markets: Most Beat Their Local Index
We ran sector-relative EV/EBITDA on 15 global exchange sets (2000-2025) against each market's own local benchmark. 10 of the 13 with a usable record show positive excess. India, Japan and Thailand underperform. UK leads at +8.63%, US is the cleanest at +3.24%.

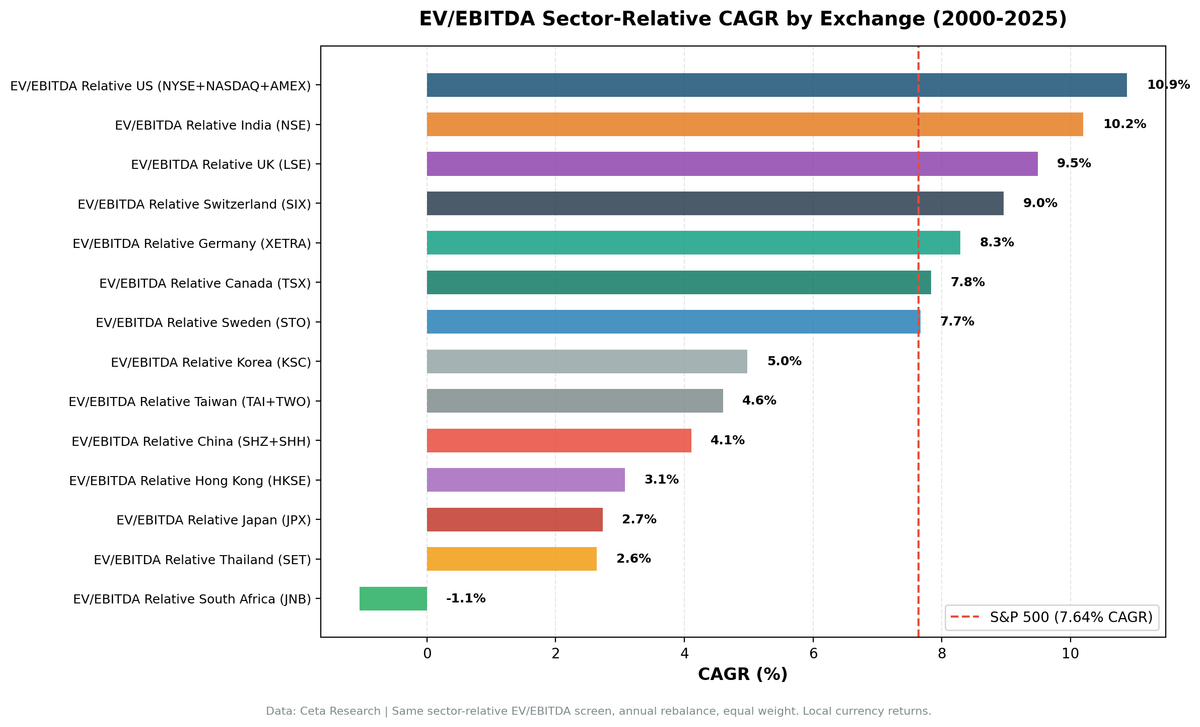
We ran the same sector-relative EV/EBITDA screen across 15 global exchange sets from 2000 to 2025. Buy when a quality stock's EV/EBITDA falls 30% or more below its sector median. Hold the top 30 deepest discounts, rebalance annually. Measured against each market's own local index, 10 of the 13 markets with a usable track record beat their benchmark. The three that don't are India (-1.20% vs the Sensex), Japan (-0.22% vs the Nikkei 225) and Thailand (-1.51% vs the SET Index). Norway never fires and South Africa fires in 2 years out of 25. The old "West works, East doesn't" narrative doesn't survive the switch to local benchmarks, but neither does the idea that the screen works nearly everywhere.
Contents
- Method
- Full Results: 15 Exchange Sets vs Local Benchmarks
- The Corrected Picture: Positive Almost Everywhere, Decisive in Few Places
- US: Best absolute result
- UK: Highest excess vs local benchmark
- Switzerland: Best downside profile, second-best Sharpe
- Germany: Reliably beats the DAX
- Canada: Beats TSX, but barely
- Sweden, Hong Kong, Korea, Taiwan, China: positive vs local, mostly inside the noise
- India and Japan: the honest exceptions among large markets
- Thailand: The clearest underperformer
- The Benchmark Question
- Down-Capture: Where Protection Is Real
- Norway and South Africa: Structural Incompatibilities
- Limitations
- Conclusion
Data: FMP financial data warehouse, 2000–2025. Updated August 2026.
Method
| Parameter | Detail |
|---|---|
| Data source | Ceta Research (FMP financial data warehouse) |
| Signal | Stock EV/EBITDA < 70% of sector median, EV/EBITDA 0.5-25x |
| Quality filters | ROE > 8%, D/E < 2.0 |
| Portfolio | Top 30 by discount depth, equal weight, annual rebalance (January) |
| Cash rule | Hold cash if fewer than 10 qualify |
| Execution | Next-day close after rebalance signal (MOC execution) |
| Period | 2000-2025 (25 years) |
| Benchmark | Local currency index per exchange. South Africa has no local index in the data and uses the S&P 500 |
| Transaction costs | Size-tiered one-way: 0.1% above $10B, 0.3% $2-10B, 0.5% below $2B |
Market cap thresholds vary by exchange to reflect local liquidity: US $1B, UK £500M, India ₹20B, Germany €500M, Switzerland CHF 500M, Canada CAD $500M, China ¥2B, Hong Kong HKD 2B, Japan ¥100B, and equivalent thresholds for Korea, Taiwan, Sweden, Thailand.
Explore the current global sector discount screen: cetaresearch.com/data-explorer?q=dXxxvAEkfL
Full Results: 15 Exchange Sets vs Local Benchmarks
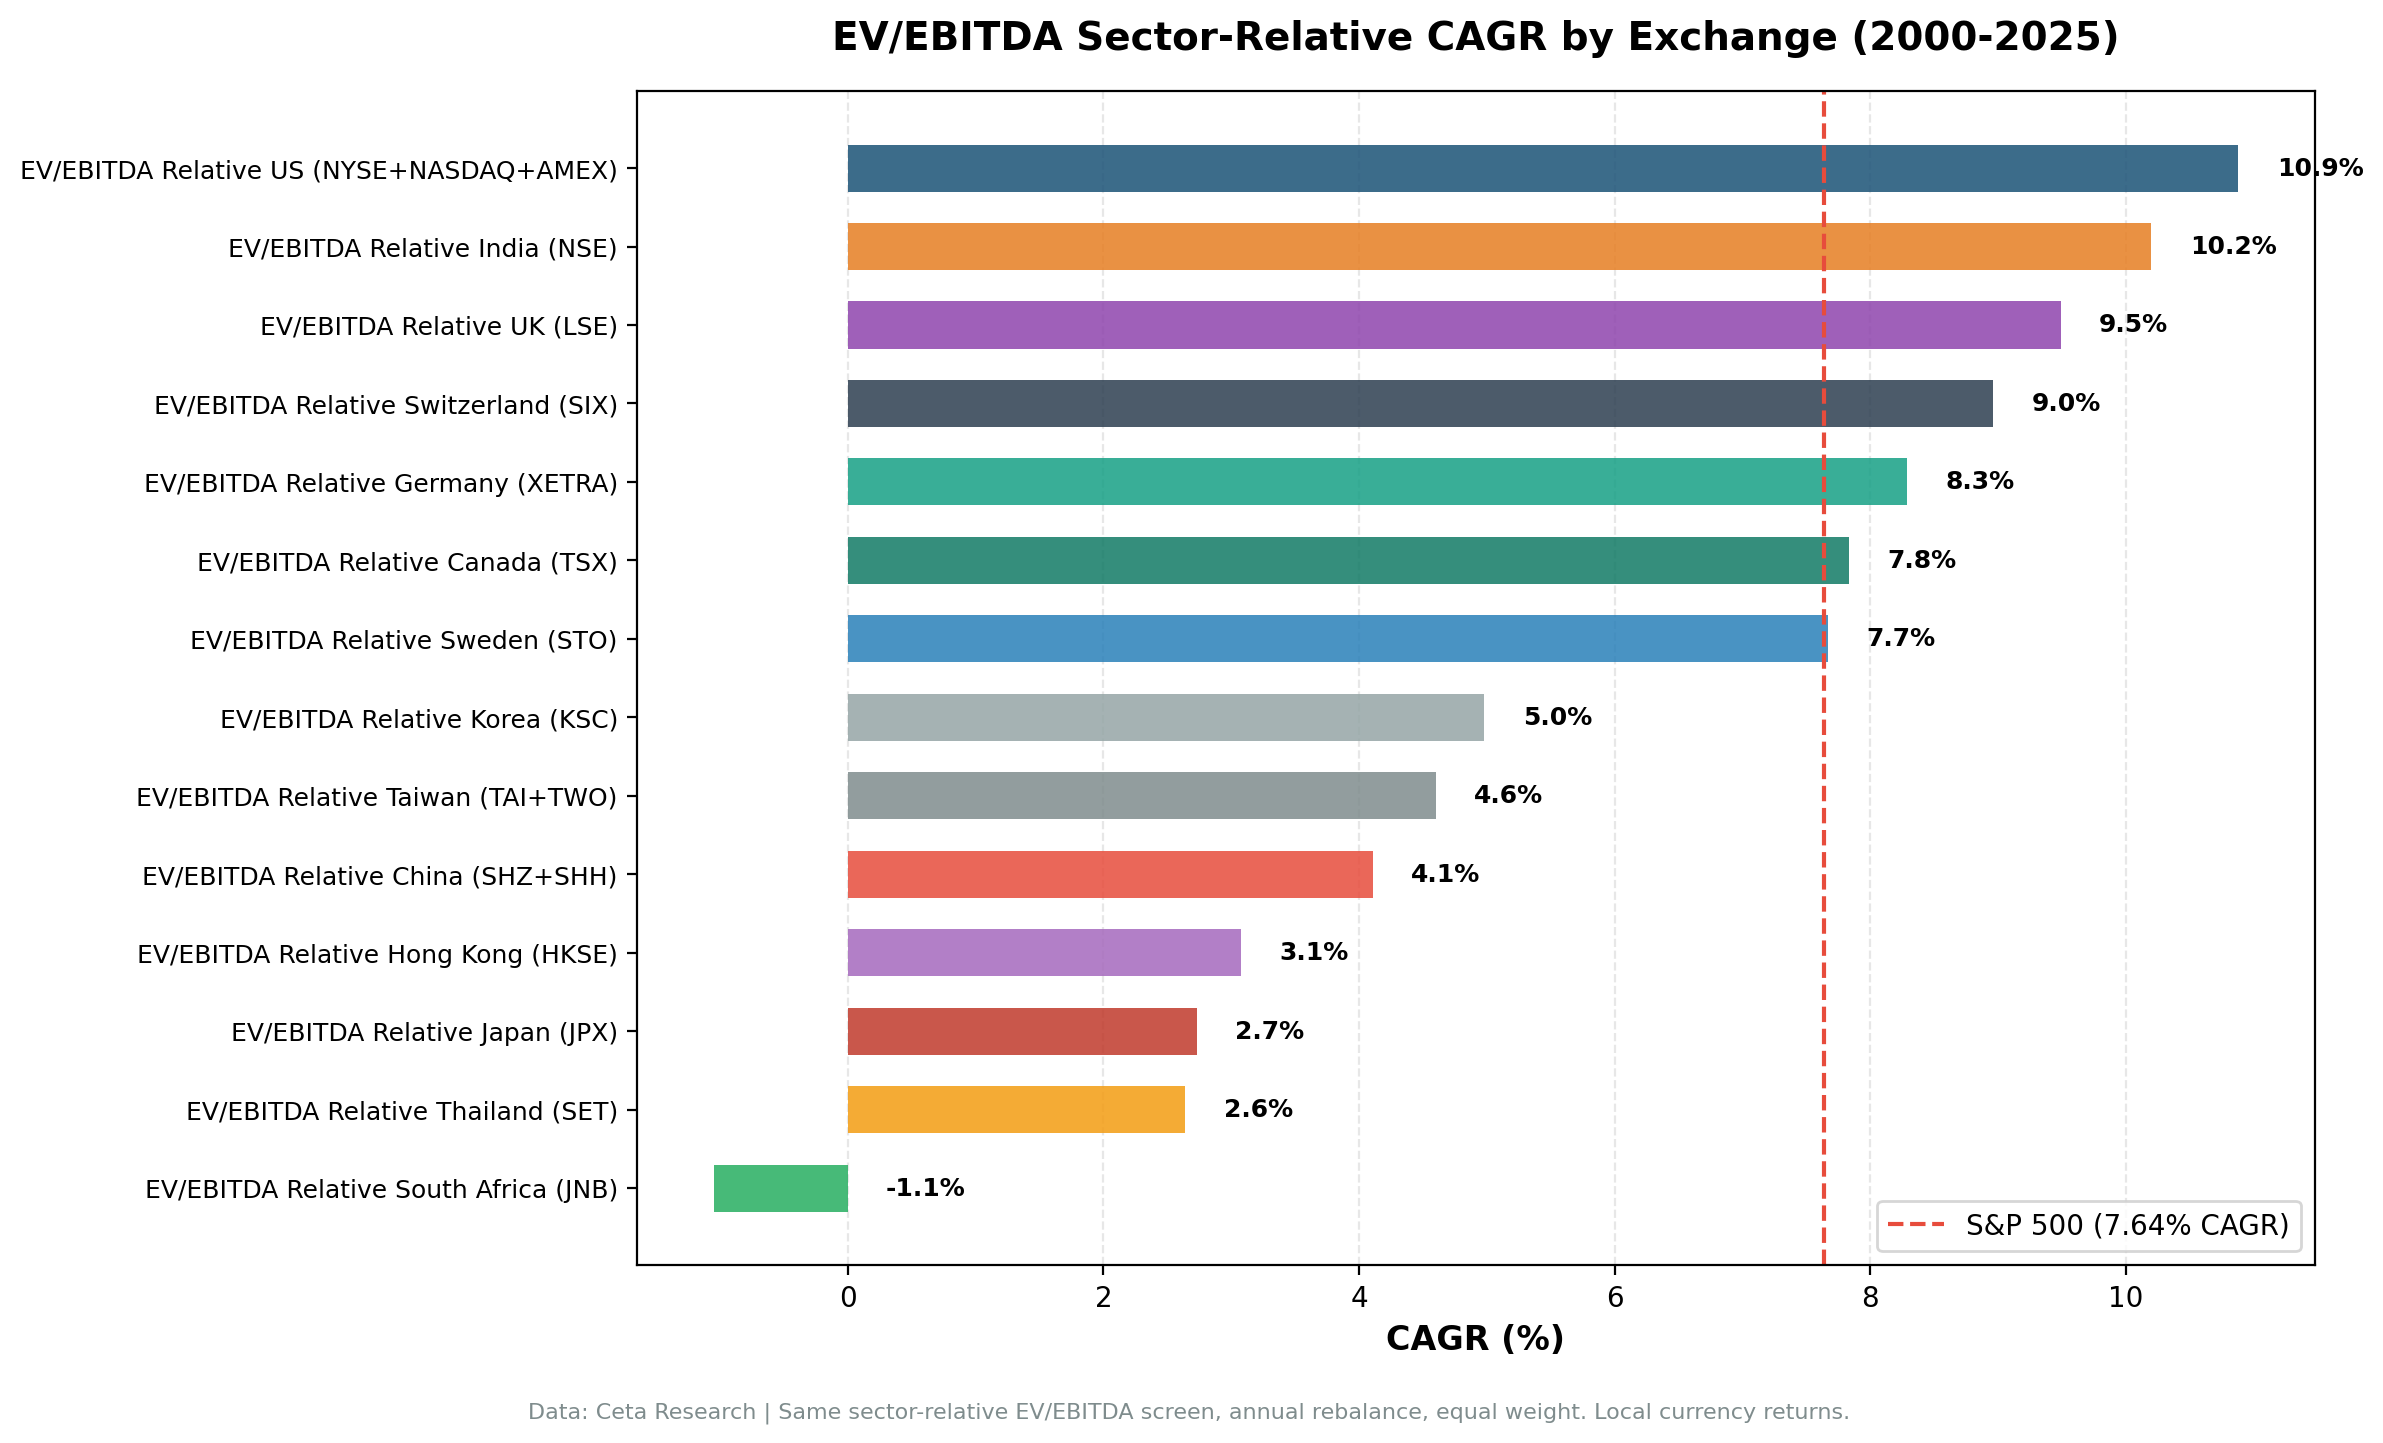
| Exchange | CAGR | Local Benchmark | Benchmark CAGR | Excess | Sharpe | MaxDD | Cash% |
|---|---|---|---|---|---|---|---|
| NYSE+NASDAQ+AMEX (US) | 10.88% | S&P 500 | 7.64% | +3.24% | 0.396 | -39.31% | 0% |
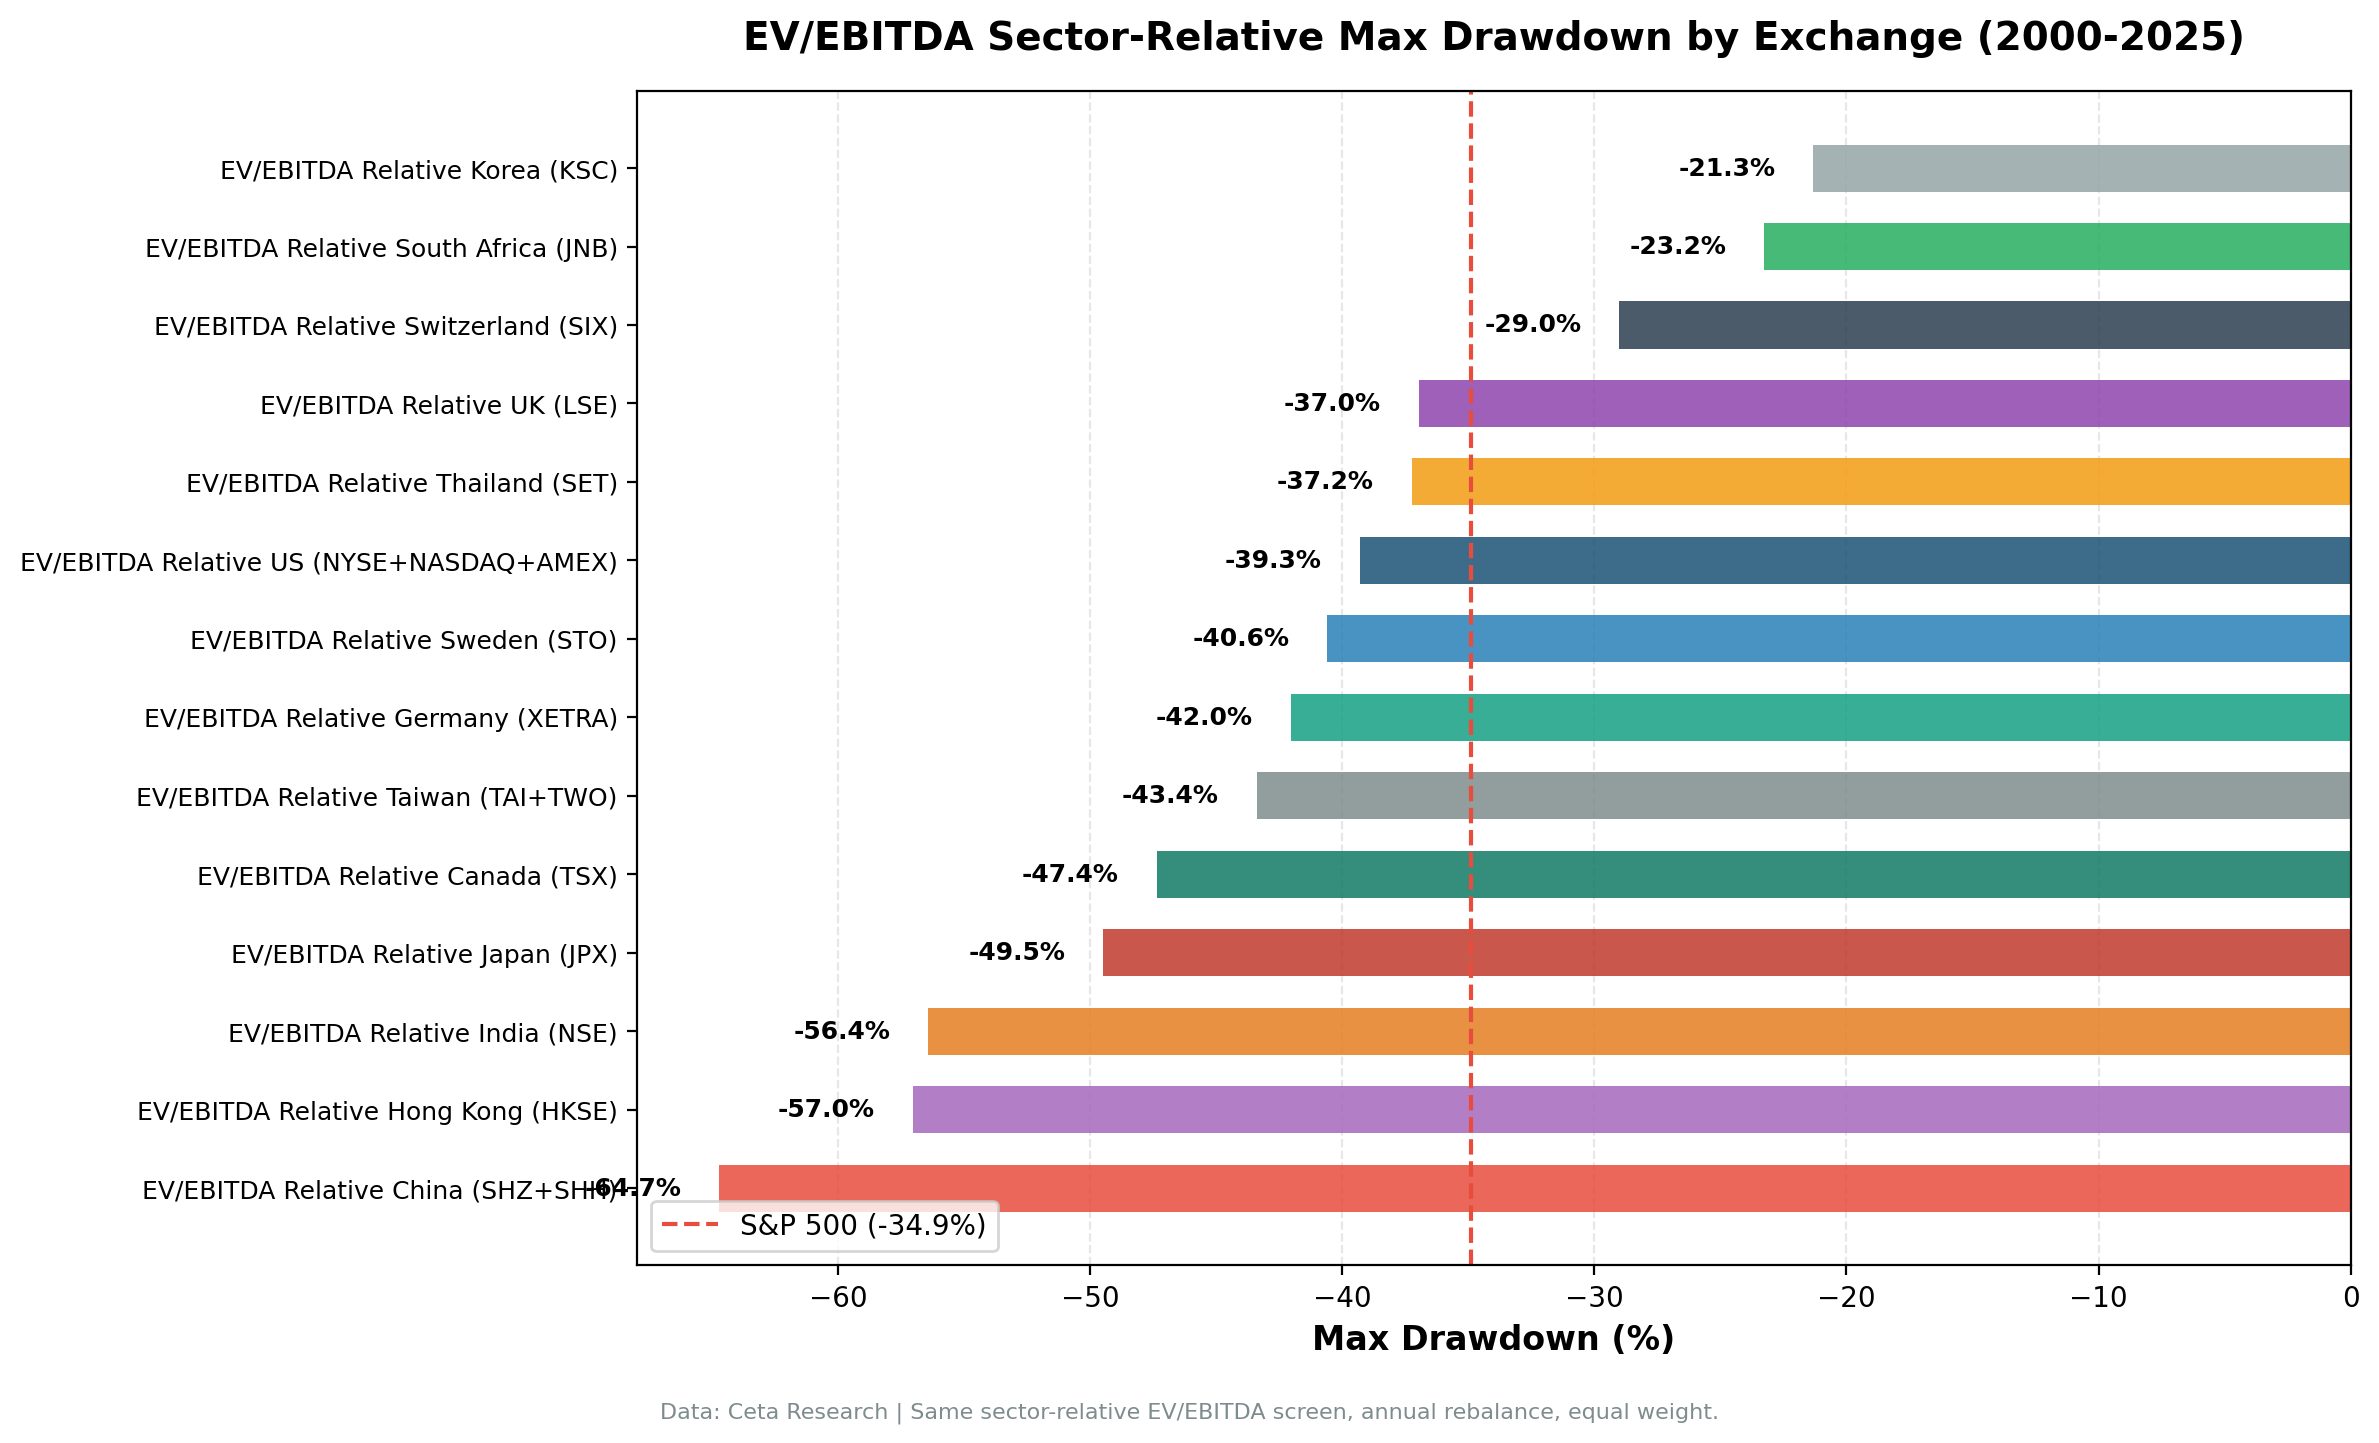
| NSE (India) | 10.20% | Sensex | 11.40% | -1.20% | 0.116 | -56.42% | 24% |
| LSE (UK) | 9.49% | FTSE 100 | 0.86% | +8.63% | 0.268 | -36.97% | 0% |
| SIX (Switzerland) | 8.96% | SMI | 1.90% | +7.07% | 0.359 | -29.00% | 8% |
| XETRA (Germany) | 8.29% | DAX | 4.45% | +3.85% | 0.312 | -42.04% | 0% |
| TSX (Canada) | 7.83% | TSX Composite | 4.44% | +3.40% | 0.256 | -47.36% | 4% |
| STO (Sweden) | 7.67% | OMX Stockholm 30 | 2.95% | +4.71% | 0.220 | -40.60% | 44% |
| KSC (Korea) | 4.98% | KOSPI | 3.32% | +1.66% | 0.112 | -21.31% | 36% |
| TAI+TWO (Taiwan) | 4.60% | TAIEX | 3.91% | +0.69% | 0.143 | -43.39% | 32% |
| SHZ+SHH (China) | 4.11% | SSE Composite | 3.54% | +0.57% | 0.039 | -64.72% | 0% |
| HKSE (Hong Kong) | 3.08% | Hang Seng | 0.49% | +2.59% | 0.003 | -57.04% | 12% |
| JPX (Japan) | 2.73% | Nikkei 225 | 2.95% | -0.22% | 0.143 | -49.47% | 24% |
| SET (Thailand) | 2.64% | SET Index | 4.16% | -1.51% | 0.010 | -37.24% | 44% |
| OSL (Norway) | — | Oslo All Share* | 9.84% | — | — | — | 100% |
| JNB (South Africa) | -1.05% | S&P 500 (no local index) | 7.64% | -8.70% | -2.439 | -23.25% | 92% |
Note on UK and Switzerland. FTSE 100 and SMI are price return indices, while the strategy's returns include dividends via adjClose. This makes the UK and Swiss excess appear larger than it would against a total return benchmark. Dividend yields on the FTSE 100 historically run 3-4%, so true total-return excess for the UK is roughly +5% rather than +8.63%. The direction is still strongly positive.
Note on Germany and Switzerland: listed is not domiciled. Both screens select every company listed on the exchange, which in Frankfurt and Zurich means a lot of foreign secondary listings. Restricting the universe to domestically domiciled companies cuts Germany from +3.85% to +0.37%, and turns Switzerland's +7.07% into -0.86%. Both also fall into cash far more often on the domiciled universe (Germany 6 years instead of 0, Switzerland 10 instead of 2). These two rows are properties of a listing venue rather than of a national economy, and they are the two rows in this table you should trust least. India, Japan, Canada, Hong Kong, Sweden and the US are measured clean.
Note on China. The universe spans Shenzhen and Shanghai but the SSE Composite covers Shanghai only, because FMP has no usable price history for the Shenzhen Component index. The +0.57% is not a strict like-for-like comparison.
Note on thin margins. Excess returns under roughly 2 points are inside the range that FMP data revisions move on their own between runs. China (+0.57%), Taiwan (+0.69%), Korea (+1.66%), Japan (-0.22%) and Thailand (-1.51%) should all be read as "indistinguishable from the benchmark" rather than as ranked results.
* The Oslo All Share series in this dataset starts in 2014, so its 9.84% covers 11 years rather than 25 and is not comparable to the other benchmark rows. The strategy never traded there, so no excess is computed either way.
S&P 500 cross-reference (for global comparison): 7.64% CAGR, -34.90% MaxDD.
The Corrected Picture: Positive Almost Everywhere, Decisive in Few Places
The most important finding from switching to local benchmarks: the strategy generates positive excess return in 10 of the 13 markets with a usable record. The previous SPY-benchmarked comparison showed most markets underperforming because those markets' local indices returned less than the S&P 500 over 25 years, not because the strategy failed.
That's still the headline, but two qualifications matter. Three of those ten wins are under 2 points and inside the noise band, and a fourth, Hong Kong, is three cash years rather than stock selection. Two of the largest, Germany and Switzerland, mostly disappear when the universe is restricted to domestic companies.
US: Best absolute result
The US leads at 10.88% CAGR, +3.24% annual excess, with zero cash periods. The American market is deep enough to always find quality stocks at sector discounts. It's also the cleanest measurement in the study: a domestic universe, a total-return benchmark, and no cash years. Read the full US backtest for details.
UK: Highest excess vs local benchmark
LSE returns 9.49% CAGR with +8.63% excess vs the FTSE 100. This looks spectacular, but context matters: the FTSE 100 price index returned only 0.86% CAGR over 25 years. UK blue chips paid significant dividends (3-4% annually) that the price index ignores. On a total return basis the FTSE 100 would be closer to 4-5%, and the strategy's true excess would be roughly +5%. Zero cash periods help the case. Two things hurt it: the max drawdown is -36.97%, deeper than the index's, and the portfolio averages only 10.9 names, the most concentrated in the study.
Switzerland: Best downside profile, second-best Sharpe
SIX produces 8.96% CAGR with Sharpe 0.359 and down capture of just 17.41%. When the SMI falls 10%, this strategy falls roughly 1.7%. The US edges it on Sharpe, 0.396 to 0.359. MaxDD of -29.0% is the shallowest of any market here that stayed close to fully invested; Korea's -21.31% is lower but comes with 9 cash years. Switzerland's listed multinationals appear particularly defensive during market stress.
The caveat is severe. On a Swiss-domiciled universe the excess is -0.86%, so the +7.07% belongs to companies that list in Zurich rather than to Swiss business. The defensive risk profile survives that caveat. The alpha doesn't.
Germany: Reliably beats the DAX
XETRA delivers 8.29% CAGR (+3.85% vs the DAX). Zero cash periods, and a 72% win rate. The DAX includes dividend reinvestment, so the benchmark comparison is the cleanest in the study.
The universe is not clean. On a German-domiciled universe the excess falls to +0.37% and the screen sits in cash 6 years out of 25. Frankfurt's listed breadth, not German corporate breadth, is what makes the sector median signal fire every year.
Canada: Beats TSX, but barely
TSX delivers 7.83% CAGR (+3.40% vs the TSX Composite). MaxDD of -47.36% is notable, well beyond the index's -33.7%, and down capture is 104.3%, meaning the portfolio falls slightly harder than the market it beats. All of Canada's excess comes from up capture of 149.1%. Canada's sector concentration in energy, materials, and financials creates a specific problem: cheap stocks within a beaten-down energy sector during a commodity downcycle aren't temporary anomalies. They're structural. This is a higher-beta way to own Canada rather than a better one.
Sweden, Hong Kong, Korea, Taiwan, China: positive vs local, mostly inside the noise
- Sweden (OMX Stockholm 30): +4.71% excess, the third-largest in the study and the biggest mover in this rerun. The 44% cash rate is the binding constraint: the signal barely fires in Sweden's concentrated market, but when it does it works. Sweden is measured clean on domicile.
- Hong Kong (Hang Seng): +2.59% excess, and the number is misleading. Three cash years at the start avoided a 46% fall in the index and account for nearly all of it. Over the 22 invested years the screen beat the Hang Seng by 0.09 points a year. Sharpe is 0.003.
- Korea (KOSPI): +1.66% excess with the lowest drawdown in the study (-21.31%) and a remarkable 8.8% down capture, though a 36% cash rate is doing much of that work. Korea's chaebol discounts have partially closed as governance pressure increased.
- Taiwan (TAIEX): +0.69% excess. TSMC's premium distorts sector medians for tech, creating noise in the signal's biggest sector.
- China (SSE Composite): +0.57% excess. Zero cash, huge volatility (MaxDD -64.72%). The signal fires every year and adds nothing measurable. Policy-driven pricing cycles dominate Chinese equities.
Three of these five are under 2 points, which is within the range that data revisions move between runs. Treat them as ties, not wins. Hong Kong's +2.59% clears that bar on the headline, but only because of three cash years: over the years it was invested the margin is +0.09%.
India and Japan: the honest exceptions among large markets
India (NSE) trails the Sensex by 1.20% annually. The six cash periods from 2000 to 2005, when the Sensex compounded 74.7% cumulatively, set a deficit the invested years never recovered. The sector-relative signal works in India in specific environments (value recovery years like 2022 and 2023) but doesn't beat the local market over the full period.
Japan (JPX) now trails the Nikkei 225 by 0.22%, and by 1.11 points a year over the 19 years it was actually invested. Its cash years helped rather than hurt, since the Nikkei fell 13.9% cumulatively across them. The most striking detail: in 2013, the Abenomics year that value investors remember fondly, the Nikkei returned +48.9% and the screen returned +39.8%. Broad stimulus lifts the index more than it lifts the discount.
Thailand: The clearest underperformer
SET trails the SET Index by 1.51% with a Sharpe of 0.010. Thailand's exchange lacks the sector diversity for stable medians. When the signal fires, it often points to single-sector concentrations. 44% cash further limits the strategy's usefulness here.
The Benchmark Question
The old SPY-benchmarked comparison produced a clean "West works, East doesn't" narrative. That narrative was partly an artifact of comparing local-currency returns to a USD benchmark. US equities compounded at 7.64% in USD over 25 years. Most other markets didn't compound as fast in their own currencies. The strategy looked bad in Asian markets not because it failed, but because those markets underperformed the S&P 500 overall.
With local benchmarks, the picture shifts: - Every Western market beats its local benchmark, though Germany and Switzerland do so on a listed rather than a domiciled universe - Most Asian markets also beat their local benchmarks, by margins too small to distinguish from noise - The underperformers are India, Japan and Thailand, not "all of Asia" - Norway and South Africa remain special cases (insufficient sector diversity and data coverage)
The signal, buy companies at a 30%+ discount to sector peers with quality filters, generates positive excess return in most markets when compared to the correct local benchmark. The size of that excess varies enormously, from +8.63% (UK, inflated by a price-only benchmark) to +0.57% (China, indistinguishable from zero). The risk-adjusted picture varies more: Switzerland and the US have the strongest Sharpe ratios. China and Hong Kong have essentially none.
Down-Capture: Where Protection Is Real
Drawdown is the other half of the risk picture, and it doesn't line up with the return ranking. Switzerland and Korea sit at the shallow end, while China, Hong Kong and India all drew down more than 55%.
| Exchange | Down Capture vs Local Bench | Up Capture | Character |
|---|---|---|---|
| Korea (KSC) | 8.8% | 50.4% | Unusually low, but 36% cash skews it |
| Switzerland (SIX) | 17.4% | 150.7% | Exceptional protection |
| Thailand (SET) | 19.6% | 31.6% | Low, but the strategy barely participates at all |
| Japan (JPX) | 52.4% | 66.1% | Moderate, and gives back more than it saves |
| Sweden (STO) | 54.0% | 120.5% | Good |
| UK (LSE) | 58.3% | 229.4% | Good, with the highest up capture in the study |
| Taiwan (TAI+TWO) | 62.4% | 82.0% | Moderate |
| Germany (XETRA) | 68.2% | 116.1% | Moderate |
| Hong Kong (HKSE) | 69.1% | 107.2% | Moderate |
| India (NSE) | 71.0% | 90.3% | Weak, and lags on the upside too |
| US (NYSE/NASDAQ/AMEX) | 73.0% | 122.7% | Moderate |
| China (SHZ+SHH) | 86.5% | 97.9% | Weak |
| Canada (TSX) | 104.3% | 149.1% | None: falls harder than the index it beats |
Switzerland stands out: 17% down capture means the portfolio falls roughly 1.7% when the SMI falls 10%. That's a highly defensive profile for a mostly-invested equity strategy. The UK at 58% pairs good protection with the highest up capture in the study, which is the most attractive combination on the table.
Read the low numbers carefully. Korea's 8.8% and Thailand's 19.6% come with 36% and 44% cash rates, so much of that "protection" is simply not being in the market. Canada is the clear failure: 104.3% down capture means the portfolio falls slightly harder than the index, and every point of its excess comes from up capture instead.
Norway and South Africa: Structural Incompatibilities
Norway (OSL): 100% cash across all 25 years. The usual shorthand is that Oslo is all energy, and the data doesn't support it: on the current universe the largest qualifying sector is industrials, with energy second. The real constraint is size. After the quality and market cap filters only three sectors reach the five-stock minimum needed to compute a median, and once the 30% discount test runs, fewer than ten names survive. On current data it finds four. A sector-relative signal needs enough companies per sector for the median to mean anything, and Oslo doesn't supply them.
South Africa (JNB): 23 of 25 years in cash. The JNB exchange has enough sectors on paper, but FMP's coverage of qualifying large-cap companies meeting all filters is too thin to reach the 10-stock minimum in most years. This reflects data coverage, not exchange structure.
Limitations
Price vs total return indices. Several local benchmarks (FTSE 100, SMI, Sensex, Hang Seng) are price return indices. The strategy's portfolio returns include dividend reinvestment via adjClose. In high-dividend markets (UK, Switzerland), this comparison overstates the excess. In lower-dividend markets (India, HK), the effect is smaller. The DAX is a total-return index, so Germany is the one clean benchmark comparison here.
Listed universes, not domiciled ones. Every screen selects companies by listing venue. Outside the US that often means a large share of foreign secondary listings. We measured this on the two markets where it bites hardest: Germany's excess falls from +3.85% to +0.37% and Switzerland's +7.07% becomes -0.86% on a domiciled universe. India, Japan, Canada, Hong Kong, Sweden and the US are measured clean.
Vintage sensitivity. These are point-in-time backtests over a vendor dataset that gets restated. Reruns of identical code months apart move excess returns by 1-2 points in either direction. Any margin under about 2 points in the table above should be treated as a tie.
Currency effects. All returns are in local currency. Cross-market comparisons carry implicit FX assumptions. A USD investor in UK or Germany carries GBP/EUR exposure not reflected in local-currency results.
Survivorship bias. Current exchange profiles are used for historical screening. Delistings aren't fully tracked.
Data completeness. FMP coverage varies significantly by market and era. India, Japan, and several Asian markets have thinner coverage pre-2006.
Financials are in the universe. Enterprise value doesn't describe a bank, whose liabilities are part of the operating business, and EBITDA skips net interest income entirely. Banks and insurers sat in the screening universe on every exchange, ranked on a multiple that doesn't fit them. This affects every row in the table and bites hardest where financials are a large share of the listed market, which includes Canada, Hong Kong and India.
Conclusion
Sector-relative EV/EBITDA generates positive excess return against local benchmarks in 10 of the 13 markets with a usable record. The previous conclusion, "West works, East doesn't", was partly an artifact of using the S&P 500 as a universal benchmark. The signal adapts to sector valuations and extracts real alpha in several markets where sector medians are meaningful.
The cases where it clearly fails: India (a strong local market ran faster than the discount portfolio), Japan (broad stimulus lifts the index more than the discount), Thailand (the signal fires into single-sector concentrations), Norway and South Africa (structural data gaps).
The cases where it genuinely excels: the US (+3.24%, on a clean domestic universe and a total-return benchmark) and the UK (roughly +5% true excess after the dividend adjustment, though on a 10-stock portfolio). Sweden's +4.71% is the strongest result we can't fully explain, and it fires in only 56% of years.
Germany and Switzerland post the kind of numbers that would headline this study, and they are the two we trust least: strip out foreign secondary listings and +3.85% becomes +0.37%, +7.07% becomes -0.86%. Five more markets land inside the noise band. What's left is a signal that works reliably in one market, works well in another on a very concentrated book, and elsewhere is either a tie or a loss.
The strategic takeaway isn't "use this everywhere." It's "check whether your local benchmark supports the mechanism." When sector discounts close on market logic, the signal works. Where they persist structurally or where the data is thin, the excess is marginal or negative.
Data: Ceta Research (FMP financial data warehouse). All returns in local currency vs local benchmark index, except South Africa which has no local index available and uses the S&P 500. Execution at the next-day close after the January signal. UK and Swiss excess inflated vs price return indices (dividend-adjusted total return would lower excess by approximately 3-4 percentage points for both the UK and Switzerland). Germany and Switzerland measured on listed rather than domiciled universes; see the note above the results table. Past performance does not guarantee future results. Full methodology: github.com/ceta-research/backtests
Past performance does not guarantee future results. This is educational content, not investment advice.

