
EV/EBITDA Sector-Relative Value on German Stocks: 8.29% CAGR Across All 25 Years
We backtested sector-relative EV/EBITDA on 25 years of German stocks (XETRA). 8.29% CAGR vs 4.45% DAX (total return), +3.85% excess, zero cash periods, 72% win rate. Big caveat: on a German-domiciled universe the excess falls to +0.37%, so the edge belongs to XETRA listings.

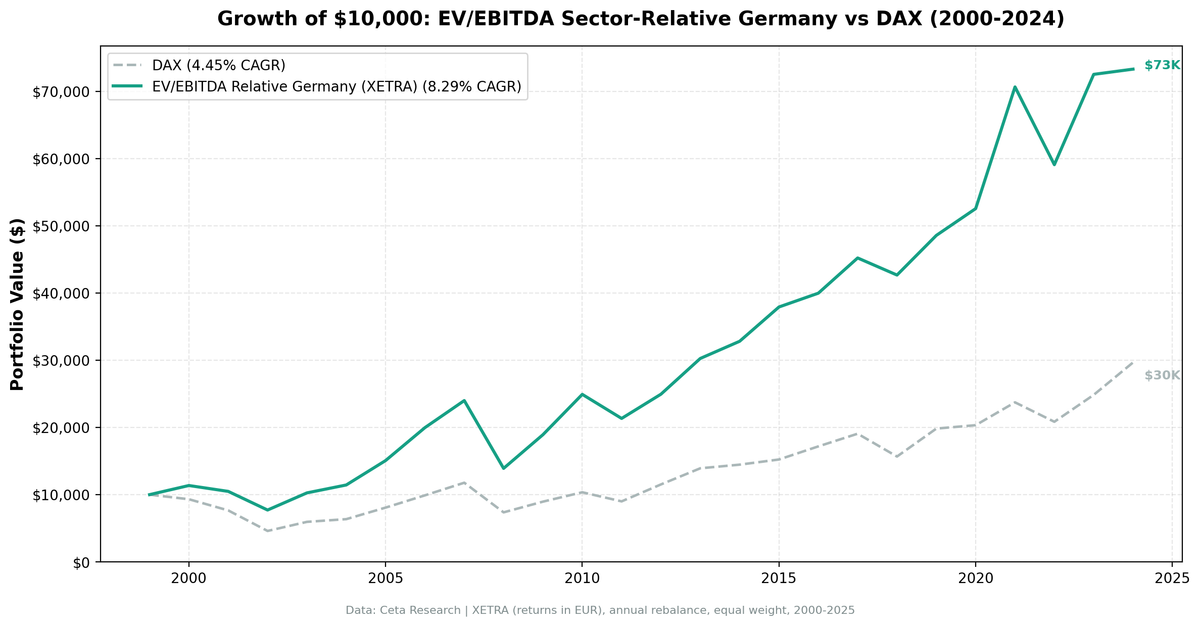
We ran a sector-relative EV/EBITDA screen on 25 years of German stock data from XETRA. The signal: buy when a stock's EV/EBITDA falls below 70% of its sector median, filtered for quality (ROE > 8%, D/E < 2.0, MCap > €500M). The strategy returned 8.29% annually vs 4.45% for the DAX, with zero cash periods across all 25 years and a 72% win rate. A key note: unlike most other indices in this study, the DAX is a total-return performance index that includes dividends, so the +3.85% excess is apples-to-apples rather than inflated by a price-only benchmark. One large caveat sits underneath that number, and it's in the next section: the universe is everything listed on XETRA, not everything German.
Contents
- Method
- The Screen
- Sector-Relative EV/EBITDA Screen for XETRA (SQL)
- What We Found
- 25 years. Zero cash. 72% win rate. +3.85% annual alpha vs the DAX.
- A 72% win rate, and where it comes from
- Year-by-year returns
- 2000: +20% excess while the dot-com bubble burst
- 2002: Germany's own crash
- 2005, 2006, 2007: three years of clean outperformance
- 2008: the deep drawdown
- 2016-2020: the growth-regime drag
- 2021-2024: one strong year, then a reversal
- Backtest Methodology
- Limitations
- Conclusion
Data: FMP financial data warehouse, 2000–2025. Updated August 2026.
Universe caveat. This screen selects every company listed on XETRA, which includes a large number of foreign companies' secondary listings. Restricting the universe to companies actually domiciled in Germany cuts the excess from +3.85% to +0.37% a year, and the screen falls below its 10-stock minimum, so it sits in cash, in 6 of the 25 years. Frankfurt's listed universe is doing most of the work here. Read every number below as a property of the XETRA listing, not of German corporate Germany.
Method
| Parameter | Detail |
|---|---|
| Data source | Ceta Research (FMP financial data warehouse) |
| Universe | XETRA listings, MCap > €500M (includes foreign secondary listings) |
| Signal | Stock EV/EBITDA < 70% of sector median (30%+ discount to peers) |
| EV/EBITDA range | 0.5-25x |
| Quality filters | ROE > 8%, D/E < 2.0 |
| Portfolio | Top 30 by deepest discount, equal weight |
| Rebalancing | Annual (January) |
| Cash rule | Hold cash if fewer than 10 stocks qualify |
| Period | 2000-2025 (25 years, 0 cash periods) |
| Benchmark | DAX (total return performance index, EUR) |
| Execution | Next-day close after the January signal (market-on-close) |
| Transaction costs | Size-tiered one-way: 0.1% above $10B, 0.3% $2-10B, 0.5% below $2B |
Financial data sourced from key_metrics_ttm for EV/EBITDA and market cap, financial_ratios_ttm for debt metrics, profile for sector classification. 45-day lag on all financial statements to prevent look-ahead bias.
The Screen
Sector-Relative EV/EBITDA Screen for XETRA (SQL)
WITH universe AS (
    SELECT k.symbol, p.companyName, p.exchange, p.sector,
           k.evToEBITDATTM AS ev_ebitda, k.returnOnEquityTTM AS roe,
           fr.debtToEquityRatioTTM AS de, p.marketCap
    FROM key_metrics_ttm k
    JOIN financial_ratios_ttm fr ON k.symbol = fr.symbol
    JOIN profile p ON k.symbol = p.symbol
    WHERE k.evToEBITDATTM BETWEEN 0.5 AND 25
      AND k.returnOnEquityTTM > 0.08
      AND (fr.debtToEquityRatioTTM IS NULL OR (fr.debtToEquityRatioTTM >= 0 AND fr.debtToEquityRatioTTM < 2.0))
      AND p.marketCap > 500000000
      AND p.sector IS NOT NULL
      AND p.exchange IN ('XETRA')
      AND p.isFund = false
      AND p.isEtf = false
      AND p.isActivelyTrading = true
    QUALIFY ROW_NUMBER() OVER (PARTITION BY COALESCE(p.cik, p.companyName)
                               ORDER BY p.averageVolume DESC) = 1
),
sector_medians AS (
    SELECT sector,
           PERCENTILE_CONT(0.5) WITHIN GROUP (ORDER BY ev_ebitda) AS median_ev_ebitda,
           COUNT(*) AS n_sector_stocks
    FROM universe GROUP BY sector HAVING COUNT(*) >= 5
)
SELECT u.symbol, u.companyName, u.exchange, u.sector,
       ROUND(u.ev_ebitda, 2) AS ev_ebitda_ttm,
       ROUND(sm.median_ev_ebitda, 2) AS sector_median_ev_ebitda,
       ROUND(u.ev_ebitda / sm.median_ev_ebitda, 3) AS ev_ratio_to_sector,
       ROUND((1 - u.ev_ebitda / sm.median_ev_ebitda) * 100, 1) AS discount_pct,
       ROUND(u.roe * 100, 1) AS roe_pct,
       ROUND(u.de, 2) AS debt_to_equity,
       ROUND(u.marketCap / 1e9, 2) AS mktcap_b
FROM universe u JOIN sector_medians sm ON u.sector = sm.sector
WHERE u.ev_ebitda / sm.median_ev_ebitda < 0.70
ORDER BY u.ev_ebitda / sm.median_ev_ebitda ASC LIMIT 30
Run this screen on Ceta Research
What We Found
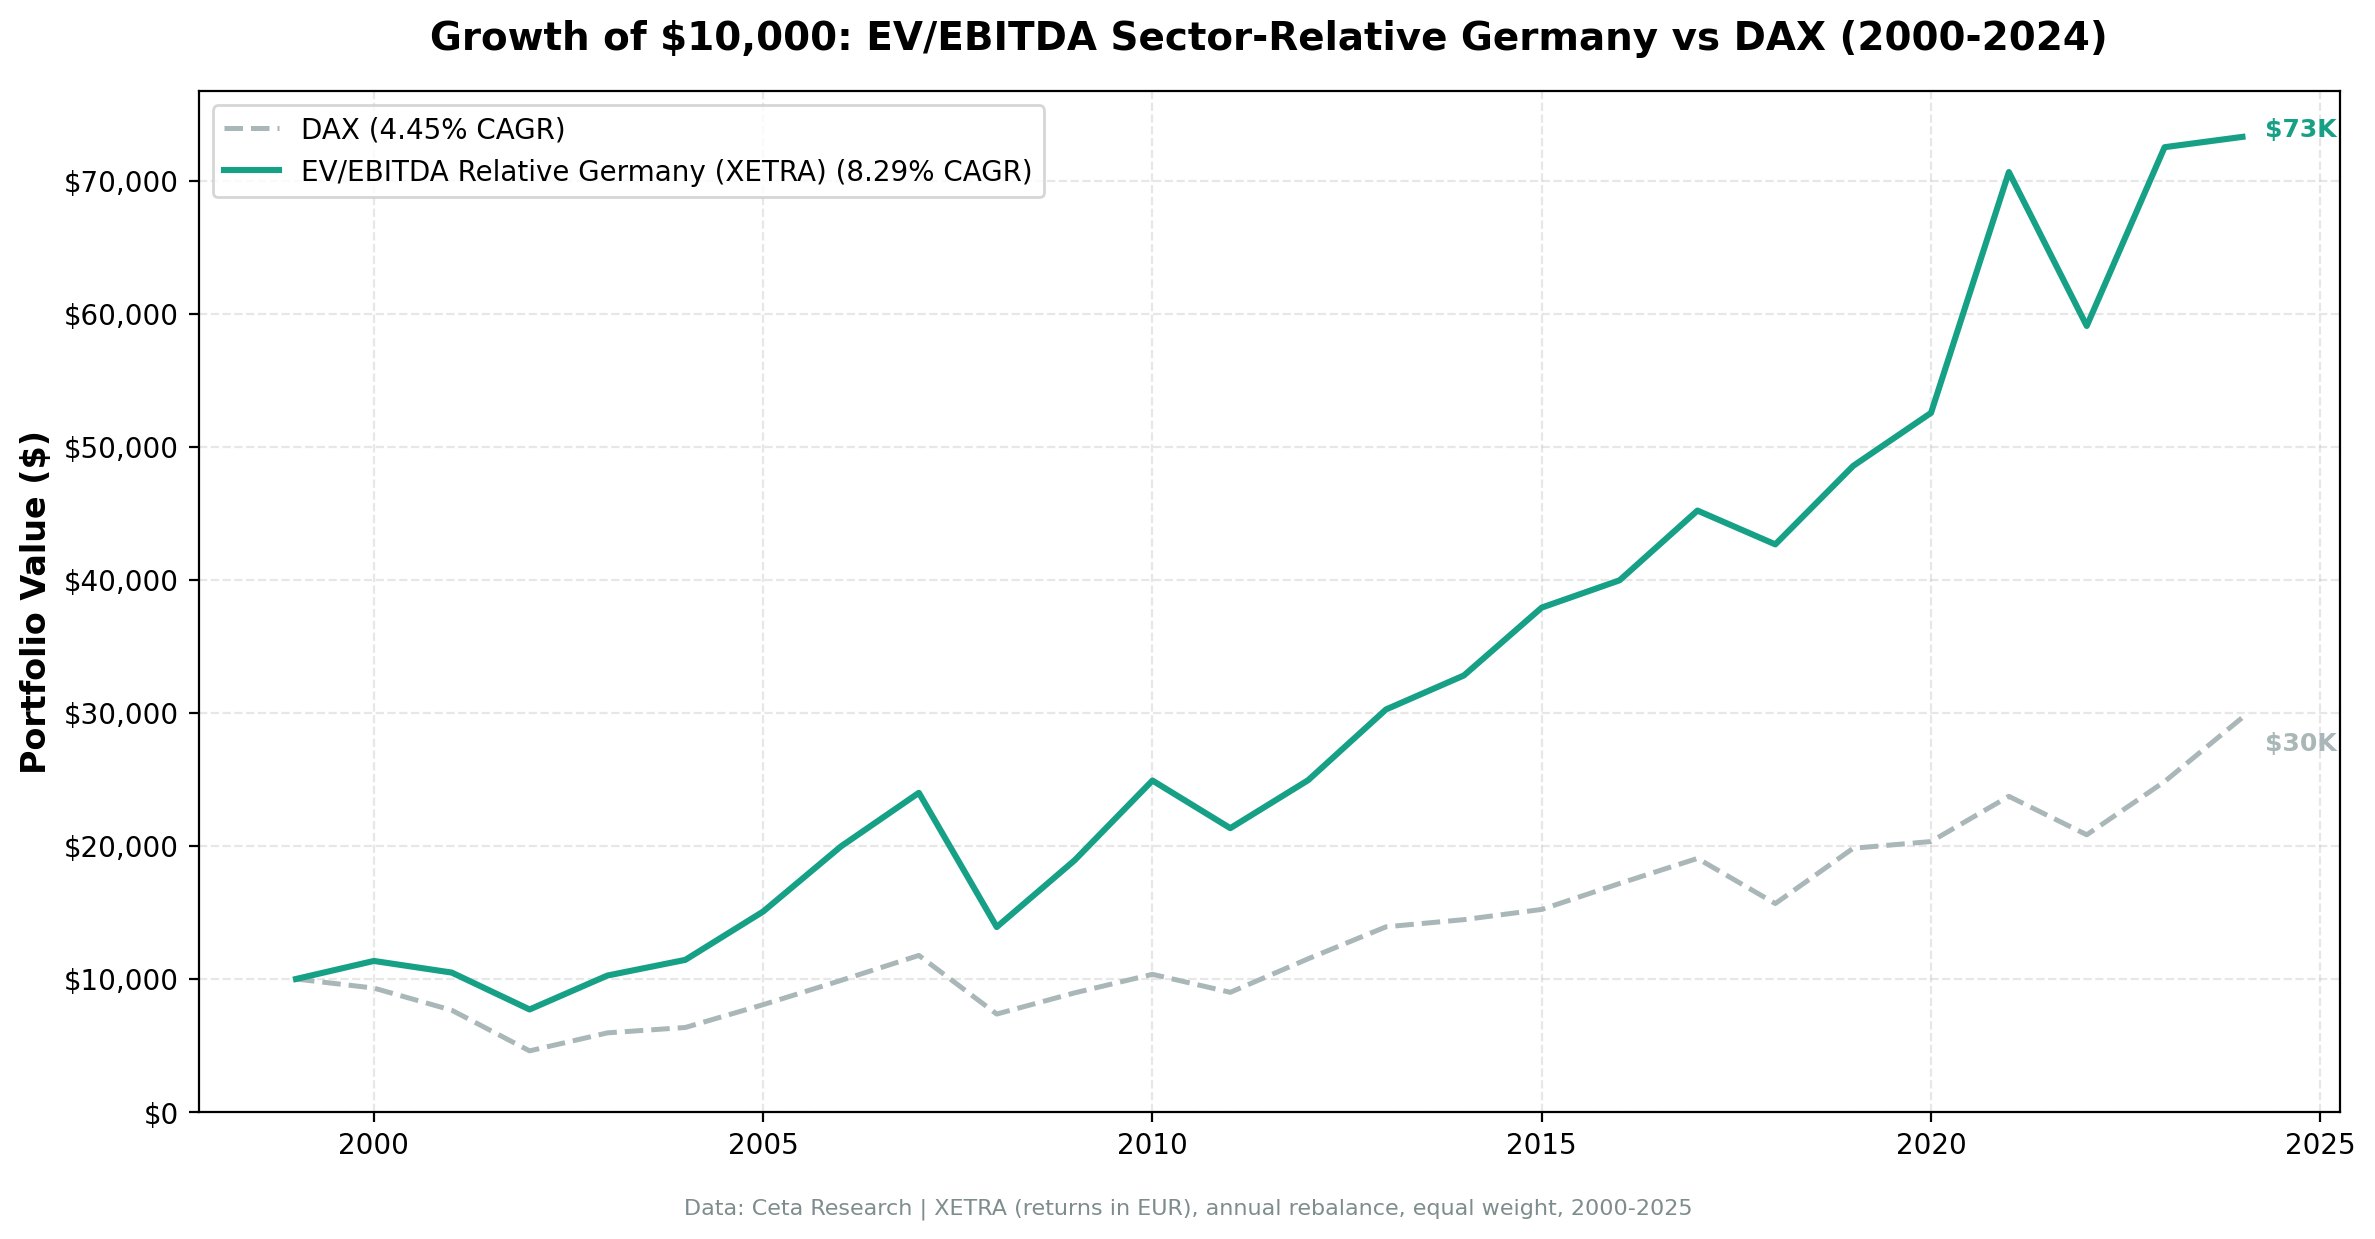
25 years. Zero cash. 72% win rate. +3.85% annual alpha vs the DAX.
| Metric | EV/EBITDA Sector-Relative (Germany) | DAX |
|---|---|---|
| CAGR | 8.29% | 4.45% (total return) |
| Excess return | +3.85% | — |
| Excess, German-domiciled universe only | +0.37% | — |
| Total Return | 632.87% | 196.63% |
| Sharpe Ratio | 0.312 | — |
| Max Drawdown | -42.04% | -54.0% |
| Up Capture | 116.07% | 100% |
| Down Capture | 68.22% | 100% |
| Win Rate | 72% | — |
| Avg Stocks per Year | 17.0 | — |
| Cash Periods | 0 of 25 | — |
The DAX is a total-return performance index that reinvests dividends, so this is a clean benchmark comparison. The +3.85% annual excess isn't an artifact of using a price-only index, which is what inflates the UK and Swiss numbers in this study.
The XETRA universe consistently produced qualifying stocks every single year from 2000 to 2025. That's the part the domicile test complicates: it found enough targets every year because it could draw on foreign secondary listings. Restricted to German-domiciled companies, the same screen falls below its 10-stock minimum in 6 of 25 years.
The numbers don't look as clean as Switzerland. Sharpe 0.312, MaxDD -42.0%. But the CAGR beats the DAX by a meaningful margin with full participation across all 25 years.
A 72% win rate, and where it comes from
The strategy beat the DAX in 18 of 25 years. The wins are frequent rather than spectacular, which is a different profile from the US version of this screen.
The largest positive years:
- 2000: +20.4% excess
- 2021: +17.7% excess
- 2010: +16.1% excess
- 2009: +14.4% excess
The largest misses were 2024 (-18.3%), 2019 (-12.7%) and 2012 (-11.1%). The pattern is a steady drip of small wins punctuated by occasional sharp losses when German large caps re-rate faster than the discount names, which is the mirror image of how this screen behaves in the US.
Year-by-year returns
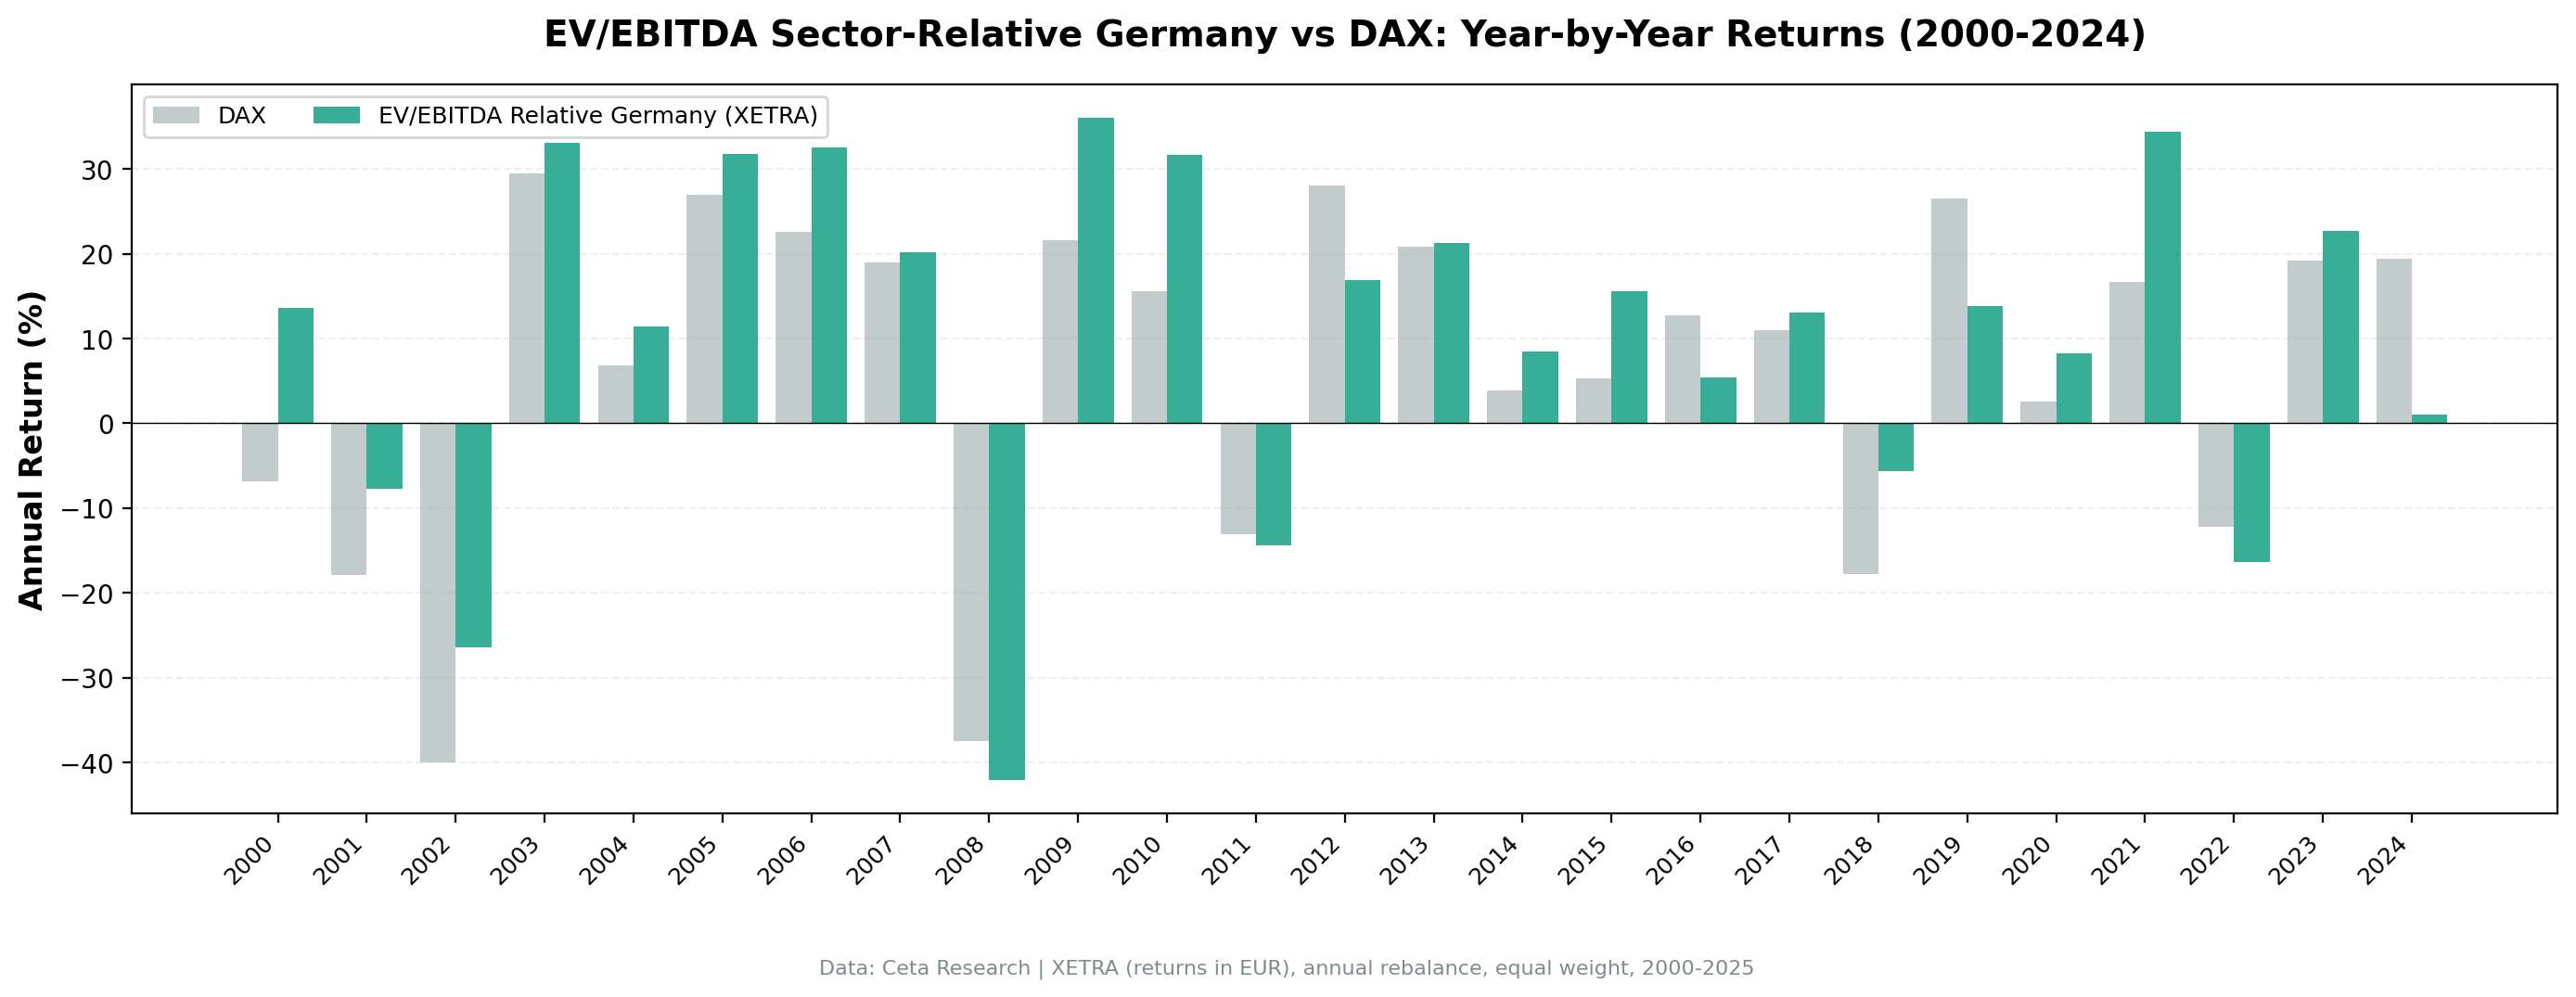
| Year | Strategy | DAX | Excess |
|---|---|---|---|
| 2000 | +13.6% | -6.8% | +20.4% |
| 2001 | -7.7% | -17.8% | +10.1% |
| 2002 | -26.4% | -39.9% | +13.5% |
| 2003 | +33.1% | +29.4% | +3.6% |
| 2004 | +11.5% | +6.8% | +4.7% |
| 2005 | +31.8% | +27.0% | +4.8% |
| 2006 | +32.5% | +22.6% | +9.9% |
| 2007 | +20.2% | +19.0% | +1.2% |
| 2008 | -42.0% | -37.4% | -4.6% |
| 2009 | +36.0% | +21.6% | +14.4% |
| 2010 | +31.7% | +15.6% | +16.1% |
| 2011 | -14.4% | -13.1% | -1.3% |
| 2012 | +16.9% | +28.0% | -11.1% |
| 2013 | +21.3% | +20.8% | +0.5% |
| 2014 | +8.4% | +3.9% | +4.6% |
| 2015 | +15.6% | +5.3% | +10.2% |
| 2016 | +5.4% | +12.8% | -7.4% |
| 2017 | +13.1% | +11.0% | +2.1% |
| 2018 | -5.6% | -17.8% | +12.2% |
| 2019 | +13.8% | +26.5% | -12.7% |
| 2020 | +8.2% | +2.5% | +5.7% |
| 2021 | +34.4% | +16.7% | +17.7% |
| 2022 | -16.4% | -12.2% | -4.2% |
| 2023 | +22.7% | +19.2% | +3.5% |
| 2024 | +1.1% | +19.4% | -18.3% |
2000: +20% excess while the dot-com bubble burst
The best relative year in this 25-year record. German industrials, chemicals, and financial sector names at EV/EBITDA discounts had nothing to do with the US tech bubble. While the DAX dropped -6.8%, these companies returned +13.6%. The sector-relative signal ensured we were in names cheap relative to their German peers, not compared to global growth stocks with inflated multiples.
That lead, extended by 2001 and 2002, is what the strategy broadly maintained for over a decade.
2002: Germany's own crash
The Neuer Markt bubble collapse hit Germany specifically. While the US had already digested much of the dot-com damage, German small-cap tech and media names imploded in 2002. The strategy returned -26.4%, a brutal year in absolute terms, but the DAX fell -39.9%, so this was the fifth-best relative year in the record at +13.5%. The quality filters (ROE > 8%, D/E < 2.0) kept out the most speculative names.
2005, 2006, 2007: three years of clean outperformance
The pre-crisis European expansion drove German exporters and industrials to strong earnings. Sector discounts closed as fundamentals improved. The strategy beat the DAX in all three years, though by a modest 4.8%, 9.9% and 1.2%, and the lead built here was smaller than the 2000-2002 bear market had already delivered.
2008: the deep drawdown
The max drawdown of -42.0% traces almost entirely to 2008, when the portfolio fell -42.0% against the DAX's -37.4%. German industrials and financials were directly exposed to the global credit crisis. No quality filter fully protects a value-tilted portfolio when credit markets freeze and global trade collapses simultaneously.
The down capture of 68.2% (average across all years) reflects the reality that Germany's export-heavy economy amplifies global cycles. Switzerland's 17% down capture shows what a defensive, less-cyclical market looks like by comparison.
2016-2020: the growth-regime drag
Two of these five years produced negative excess returns, with 2019 (-12.7%) the most painful, and the stretch as a whole added almost nothing. Global capital was repricing toward US tech assets, and European value stocks, even cheap ones, were not the destination. German industrial and automotive sectors faced structural headwinds from China slowdown and trade policy uncertainty.
2021-2024: one strong year, then a reversal
2021 was the second-best relative year in the record: +34.4% against the DAX's +16.7%, a +17.7% excess, as the value rotation ran. What followed didn't hold. 2022 fell -16.4% against the DAX's -12.2%, losing 4.2 points in a down year. 2023 recovered a modest +3.6% of excess. Then 2024 was the worst relative year in the entire history: +1.1% against the DAX's +19.4%, a gap of -18.3%, as Germany entered recession and the index's large caps re-rated without the discount names.
Backtest Methodology
Full methodology: backtests/METHODOLOGY.md
| Parameter | Choice |
|---|---|
| Universe | XETRA, MCap > €500M |
| Signal | EV/EBITDA < 70% of sector median, range 0.5-25x |
| Quality | ROE > 8%, D/E < 2.0 |
| Portfolio | Top 30 by deepest discount, equal weight |
| Rebalancing | Annual (January) |
| Cash rule | Hold cash if < 10 qualify |
| Benchmark | DAX (total return performance index, EUR) |
| Period | 2000-2025 (25 years) |
| Data | Point-in-time (45-day lag on FY financial statements) |
| Transaction costs | Size-tiered one-way: 0.1% above $10B, 0.3% $2-10B, 0.5% below $2B |
Limitations
MaxDD -42.0%. Germany's industrial and export-heavy composition means downturns can be severe. The single worst year (2008) drove essentially the entire max drawdown.
The excess belongs to the listing, not the country. Restricting the universe to German-domiciled companies drops the excess from +3.85% to +0.37% a year and pushes the screen into cash in 6 of 25 years. XETRA's foreign secondary listings are carrying this result. If you intend to buy German companies specifically, this backtest does not describe what you would have earned.
Win rate 72%. The strategy beat the DAX in 18 of 25 years. The losses, when they come, are sharp: -18.3% in 2024 and -12.7% in 2019.
Currency effects. Returns are in EUR. The DAX is also in EUR, so currency effects don't distort this comparison. USD-based investors carry EUR/USD exposure, which adds noise for international investors.
Sector concentration risk. XETRA is overweight industrials and chemicals relative to a global benchmark. Without a sector cap, the portfolio can cluster in these sectors. Cyclical sector concentration amplifies exposure to global trade and manufacturing cycles.
2024 recession sensitivity. Germany's structural challenges (automotive transition, energy costs, China competition) created a difficult environment for industrial value stocks in 2024. Results reflect both a German-specific problem and a global value-vs-growth rotation in that period.
Conclusion
Sector-relative EV/EBITDA on XETRA delivered 8.29% CAGR over 25 years, with zero cash periods, a 72% win rate and +3.85% annual excess vs the DAX total return index. Unlike the UK and Switzerland comparisons, the benchmark is clean: the DAX reinvests dividends.
The universe is not clean. Restrict it to German-domiciled companies and the excess falls to +0.37%. The honest reading is that a screen run over everything listed in Frankfurt beat the DAX, and that most of the edge came from companies that happen to list there rather than from German industry.
Germany is a cyclical, export-driven market. The signal works when global trade expands and sector discounts close on the back of improving earnings. It doesn't work when capital floods into US tech or when German industry faces structural headwinds. Both regimes appeared in this 25-year window.
The early record (2000-2015) is strong. The recent record (2016-2024) is mixed, and 2024 was the worst relative year in the entire history at -18.3%. The questions for any investor considering this strategy are whether Germany's structural challenges are cyclical or permanent, and whether they want a portfolio that is German only by listing venue.
Data: Ceta Research (FMP financial data warehouse). Returns in EUR (local currency). Benchmark: DAX (^GDAXI, total return) in EUR. Past performance does not guarantee future results. See full methodology at github.com/ceta-research/backtests.
Past performance does not guarantee future results. This is educational content, not investment advice.

