
EV/EBITDA Sector-Relative Value on China A-Shares: When the Signal Can't Help You
We backtested sector-relative EV/EBITDA on 25 years of China A-share data (SHZ+SHH). 4.11% CAGR vs 3.54% SSE Composite, +0.57% excess. But Sharpe 0.039 and a -64.72% max drawdown tell the real story: the signal barely beats a market that barely returns anything. Discounts follow policy, not value.

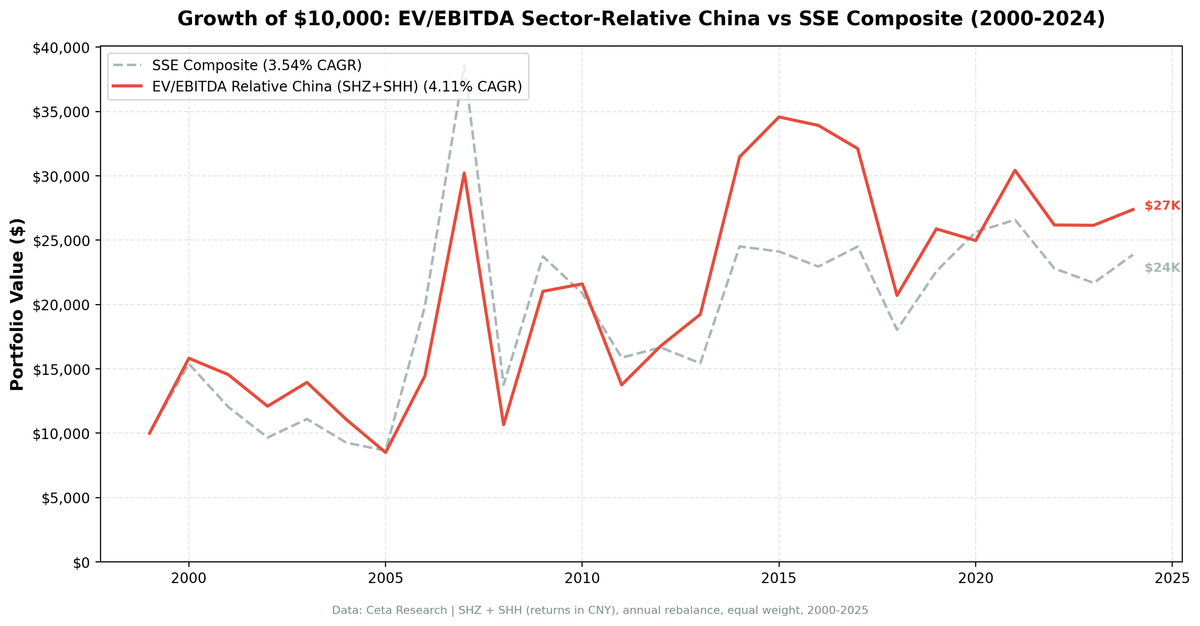
We ran a sector-relative EV/EBITDA screen on 25 years of China A-share data across SHZ and SHH. The signal always fires, with zero cash periods and 22.6 average stocks per year, but 4.11% CAGR vs 3.54% for the SSE Composite (000001.SS), a thin +0.57% excess, and a max drawdown of -64.72% tell the story. China is the clearest example in this study of a market where sector-relative discounts exist consistently but don't predict returns in any useful way. The signal is measuring something real. It's just not the thing that drives Chinese stock prices.
Contents
- Method
- The Screen
- Sector-Relative EV/EBITDA Screen for China A-Shares (SQL)
- What We Found
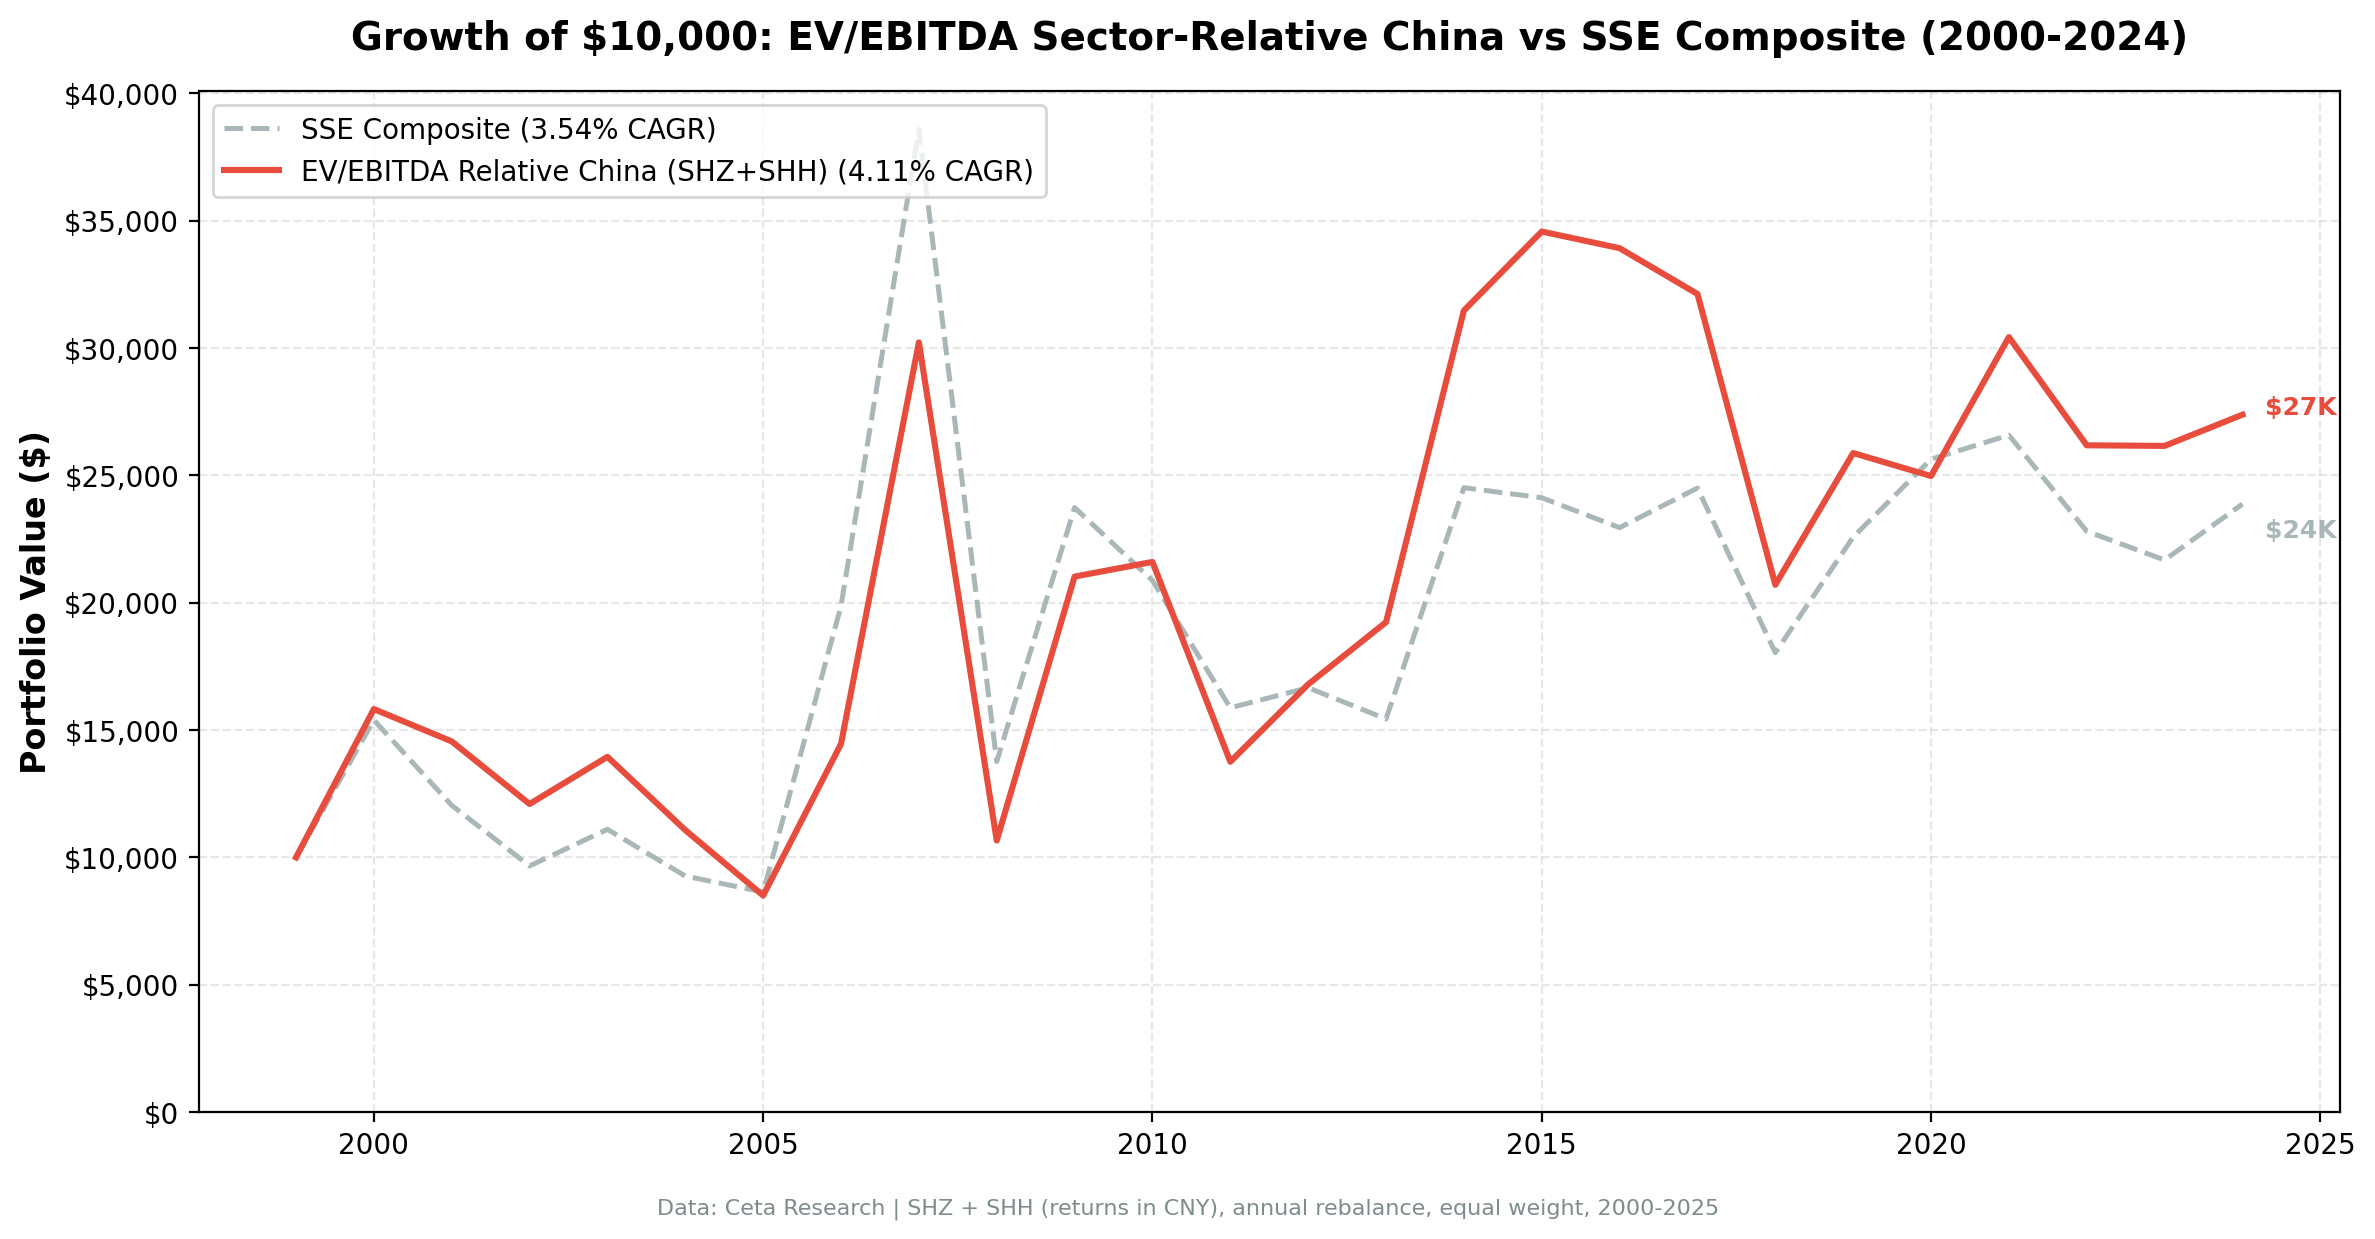
- 25 years. Never in cash. +0.57% annual excess vs the SSE Composite. Sharpe 0.039.
- The bubble years explain everything
- Year-by-year returns
- Why the signal can't help you in China
- 2011 and 2018: the painful down years
- The recent years (2016-2024): going nowhere together
- Backtest Methodology
- Limitations
- Conclusion
Data: FMP financial data warehouse, 2000–2025. Updated August 2026.
Benchmark caveat. The portfolio is drawn from two venues, Shenzhen and Shanghai, but the SSE Composite covers Shanghai only. FMP has no usable price history for the Shenzhen Component index, so a single-venue benchmark is the best available comparison. Shenzhen skews smaller and more growth-oriented than Shanghai, so this comparison is not strictly like-for-like and the thin excess below should be read with that in mind.
Method
| Parameter | Detail |
|---|---|
| Data source | Ceta Research (FMP financial data warehouse) |
| Universe | SHZ + SHH (China A-shares: Shenzhen + Shanghai), MCap > ¥2B |
| Signal | Stock EV/EBITDA < 70% of sector median (30%+ discount to peers) |
| EV/EBITDA range | 0.5-25x |
| Quality filters | ROE > 8%, D/E < 2.0 |
| Portfolio | Top 30 by deepest discount, equal weight |
| Rebalancing | Annual (January) |
| Cash rule | Hold cash if fewer than 10 stocks qualify |
| Period | 2000-2025 (25 years, 0 cash periods) |
| Benchmark | SSE Composite (000001.SS, Shanghai only) |
| Execution | Next-day close after the January signal (market-on-close) |
Financial data sourced from key_metrics_ttm for EV/EBITDA and market cap, financial_ratios_ttm for debt metrics, profile for sector classification. 45-day lag on all financial statements to prevent look-ahead bias.
The Screen
Sector-Relative EV/EBITDA Screen for China A-Shares (SQL)
WITH universe AS (
    SELECT k.symbol, p.companyName, p.exchange, p.sector,
           k.evToEBITDATTM AS ev_ebitda, k.returnOnEquityTTM AS roe,
           fr.debtToEquityRatioTTM AS de, p.marketCap
    FROM key_metrics_ttm k
    JOIN financial_ratios_ttm fr ON k.symbol = fr.symbol
    JOIN profile p ON k.symbol = p.symbol
    WHERE k.evToEBITDATTM BETWEEN 0.5 AND 25
      AND k.returnOnEquityTTM > 0.08
      AND (fr.debtToEquityRatioTTM IS NULL OR (fr.debtToEquityRatioTTM >= 0 AND fr.debtToEquityRatioTTM < 2.0))
      AND p.marketCap > 2000000000
      AND p.sector IS NOT NULL
      AND p.exchange IN ('SHZ', 'SHH')
      AND p.isFund = false
      AND p.isEtf = false
      AND p.isActivelyTrading = true
    QUALIFY ROW_NUMBER() OVER (PARTITION BY COALESCE(p.cik, p.companyName)
                               ORDER BY p.averageVolume DESC) = 1
),
sector_medians AS (
    SELECT sector,
           PERCENTILE_CONT(0.5) WITHIN GROUP (ORDER BY ev_ebitda) AS median_ev_ebitda,
           COUNT(*) AS n_sector_stocks
    FROM universe GROUP BY sector HAVING COUNT(*) >= 5
)
SELECT u.symbol, u.companyName, u.exchange, u.sector,
       ROUND(u.ev_ebitda, 2) AS ev_ebitda_ttm,
       ROUND(sm.median_ev_ebitda, 2) AS sector_median_ev_ebitda,
       ROUND(u.ev_ebitda / sm.median_ev_ebitda, 3) AS ev_ratio_to_sector,
       ROUND((1 - u.ev_ebitda / sm.median_ev_ebitda) * 100, 1) AS discount_pct,
       ROUND(u.roe * 100, 1) AS roe_pct,
       ROUND(u.de, 2) AS debt_to_equity,
       ROUND(u.marketCap / 1e9, 2) AS mktcap_b
FROM universe u JOIN sector_medians sm ON u.sector = sm.sector
WHERE u.ev_ebitda / sm.median_ev_ebitda < 0.70
ORDER BY u.ev_ebitda / sm.median_ev_ebitda ASC LIMIT 30
Run this screen on Ceta Research
What We Found
25 years. Never in cash. +0.57% annual excess vs the SSE Composite. Sharpe 0.039.
| Metric | EV/EBITDA Sector-Relative (China) | SSE Composite |
|---|---|---|
| CAGR | 4.11% | 3.54% |
| Excess return | +0.57% | — |
| Total Return | 173.91% | 138.74% |
| Sharpe Ratio | 0.039 | — |
| Max Drawdown | -64.72% | -64.33% |
| Up Capture | 97.91% | 100% |
| Down Capture | 86.47% | 100% |
| Win Rate | 60% | — |
| Avg Stocks per Year | 22.6 | — |
| Cash Periods | 0 of 25 | — |
A Sharpe ratio of 0.039 means the strategy barely earned anything above the risk-free rate per unit of volatility over 25 years. The max drawdown of -64.72% is the worst of any exchange tested. The +0.57% annual excess vs the SSE Composite is technically positive, but it is smaller than the margin that FMP data revisions move between runs, so treat it as indistinguishable from zero.
The zero cash periods look like a feature. In practice, they mean the portfolio was fully deployed into the 2008 crash and the 2011 selloff with no option to step aside.
The bubble years explain everything
The backtest includes two Chinese bubble periods that dominate the summary statistics:
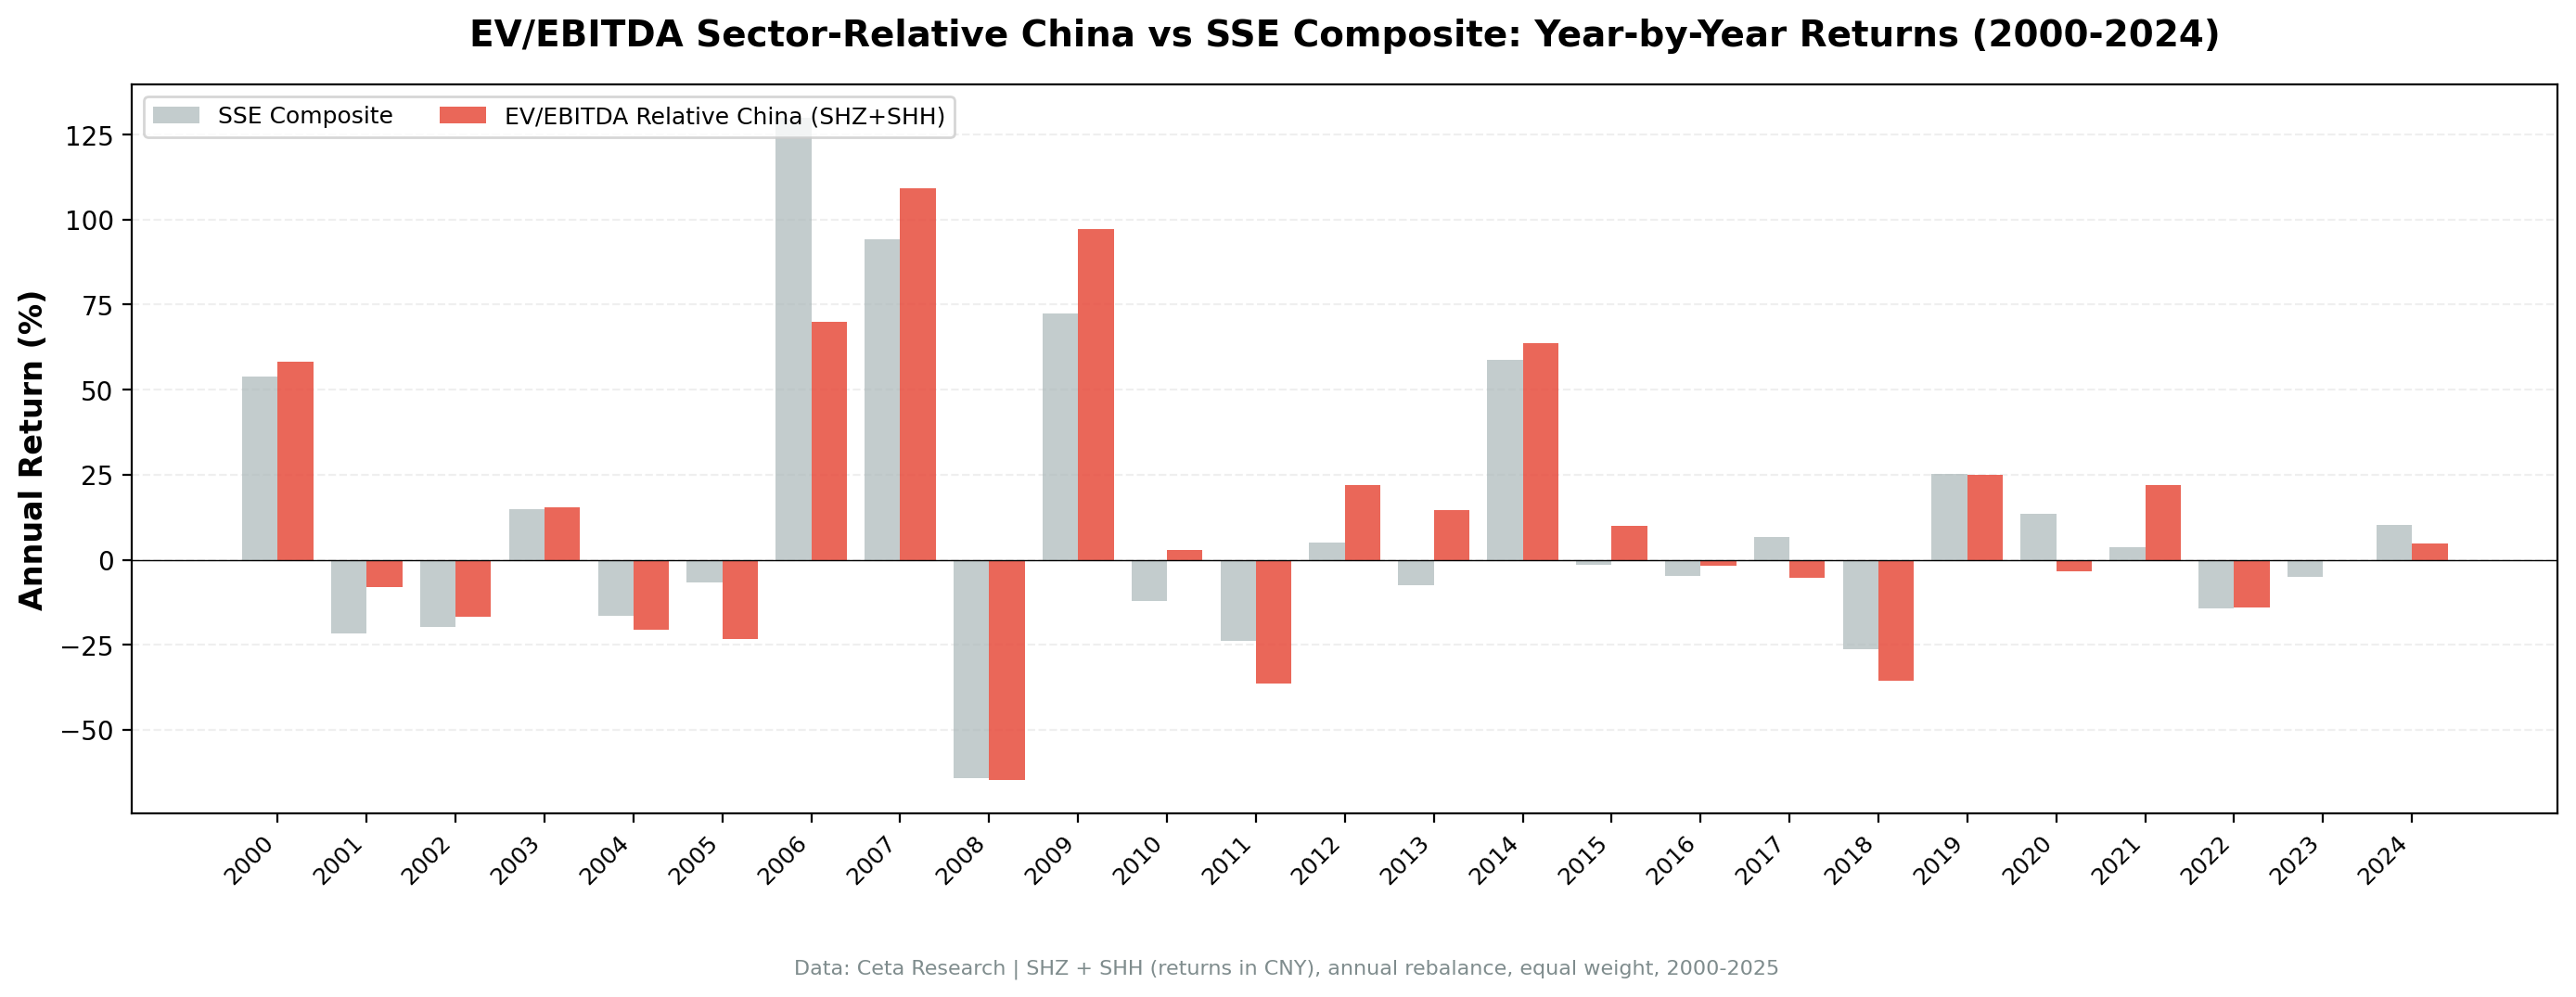
- 2007: +109.1% (Shanghai Composite hit 6,100 in October 2007, and returned +94.2% itself)
- 2009: +97.2% (post-crisis liquidity surge, against the index's +72.5%)
These aren't alpha. They're participation in a speculative bubble and its government-fueled recovery. The sector-relative signal happened to be invested during both, which inflates the 25-year CAGR significantly. Without those two years, the compound return would be deeply negative.
Year-by-year returns
| Year | Strategy | SSE Composite | Excess |
|---|---|---|---|
| 2000 | +58.2% | +53.9% | +4.3% |
| 2001 | -8.0% | -21.8% | +13.7% |
| 2002 | -16.9% | -19.8% | +2.9% |
| 2003 | +15.3% | +14.9% | +0.4% |
| 2004 | -20.6% | -16.5% | -4.1% |
| 2005 | -23.2% | -6.8% | -16.5% |
| 2006 | +70.0% | +130.0% | -59.9% |
| 2007 | +109.1% | +94.2% | +14.9% |
| 2008 | -64.7% | -64.3% | -0.4% |
| 2009 | +97.2% | +72.5% | +24.7% |
| 2010 | +2.7% | -12.1% | +14.8% |
| 2011 | -36.3% | -23.9% | -12.4% |
| 2012 | +22.1% | +5.0% | +17.1% |
| 2013 | +14.5% | -7.4% | +21.9% |
| 2014 | +63.6% | +58.8% | +4.8% |
| 2015 | +9.9% | -1.6% | +11.5% |
| 2016 | -1.9% | -4.9% | +3.0% |
| 2017 | -5.3% | +6.8% | -12.1% |
| 2018 | -35.5% | -26.4% | -9.2% |
| 2019 | +25.0% | +25.1% | -0.1% |
| 2020 | -3.5% | +13.5% | -17.0% |
| 2021 | +21.8% | +3.7% | +18.1% |
| 2022 | -14.0% | -14.2% | +0.2% |
| 2023 | -0.1% | -5.0% | +4.8% |
| 2024 | +4.7% | +10.1% | -5.4% |
Why the signal can't help you in China
The A-share market is structurally different from Western exchanges in three ways that matter for a value signal:
Policy cycles, not fundamentals, drive prices. The 2006-2007 surge and the 2008 crash to -64.7% were driven by Beijing's credit tap, not by sector-relative valuation. 2006 is the clearest single illustration: the index returned +130.0% and the screen returned +70.0%, a 59.9 point shortfall in the biggest up year on record. Stocks trading at EV/EBITDA discounts to their sector peers participated in the bubble on the way up and the crash on the way down. The signal provided no discrimination.
Retail dominance over institutional pricing. China's A-share market has historically had retail investor participation rates of 80%+ by trading volume. Retail investors don't price stocks on EV/EBITDA sector comparisons. They follow momentum, sentiment, and government signals. A cheap stock can stay cheap indefinitely because the marginal buyer isn't looking at it.
State-directed industries with controlled pricing. Large state-owned enterprises in banking, energy, and utilities are priced partly on policy mandates. A bank trading at a 40% discount to its sector peers might stay there because market participants understand it will face government-directed lending that constrains its ROE. The "discount" is rational, not anomalous.
2011 and 2018: the painful down years
Beyond 2008, two other years stand out for severity:
- 2011: -36.3% against the SSE Composite's -23.9% (-12.4% excess). The European debt crisis triggered capital outflows from emerging markets. Chinese property concerns added domestic pressure.
- 2018: -35.5% against the index's -26.4% (-9.2% excess). US-China trade war escalation hit export-oriented companies across multiple sectors.
These were macro events that sector-relative EV/EBITDA screening couldn't anticipate or protect against.
The recent years (2016-2024): going nowhere together
Measured against the SSE Composite rather than a US index, the last nine years are a wash rather than a collapse: four positive excess years, five negative, and a largest miss of -17.0% in 2020. What the local comparison makes clear is that both the screen and the index went nowhere. The strategy returned -0.1% in 2023 and +4.7% in 2024 while China's property slowdown, regulatory crackdowns on tech companies, and persistent geopolitical risk premiums weighed on the whole market.
The A-share market's valuation compression since 2021 has created many stocks that look cheap on EV/EBITDA metrics. But the signal can't tell you whether those discounts reflect genuine mispricing or a rational reassessment of growth expectations and risk premiums.
Backtest Methodology
Full methodology: backtests/METHODOLOGY.md
| Parameter | Choice |
|---|---|
| Universe | SHZ + SHH, MCap > ¥2B |
| Signal | EV/EBITDA < 70% of sector median, range 0.5-25x |
| Quality | ROE > 8%, D/E < 2.0 |
| Portfolio | Top 30 by deepest discount, equal weight |
| Rebalancing | Annual (January) |
| Cash rule | Hold cash if < 10 qualify |
| Benchmark | SSE Composite (000001.SS) |
| Period | 2000-2025 (25 years) |
| Data | Point-in-time (45-day lag on FY financial statements) |
| Transaction costs | Size-tiered one-way: 0.1% above $10B, 0.3% $2-10B, 0.5% below $2B |
Limitations
Bubble years distort the CAGR. Remove 2007 (+109.1%) and 2009 (+97.2%), and the 25-year compound return is sharply negative. The positive CAGR figure depends on two years of market-wide speculation that the signal didn't cause.
Data quality. FMP's Chinese data is less complete than US or European data, particularly for earlier years. Financial statement quality and disclosure standards for Chinese-listed companies are lower than for Western issuers.
MaxDD -64.72%. The worst max drawdown of the 15 exchange sets tested. A portfolio starting at $10,000 would have dropped to approximately $3,528 at the trough. Recovery from that depth requires a +183% return to break even.
Currency effects. Returns are in CNY. The SSE Composite is also in CNY, so the local comparison is clean. USD-based investors carry CNY/USD exposure.
Delisting and VIE risk. The backtest uses current exchange profiles. Historical delistings and companies that exited the market are not fully tracked. This creates survivorship bias that slightly flatters the results.
Conclusion
Sector-relative EV/EBITDA on China A-shares generated 4.11% CAGR over 25 years, +0.57% above the SSE Composite annually. The max drawdown of -64.72% is the deepest in this study. That +0.57% annual edge against a market that itself barely returned anything over 25 years isn't a meaningful result, and it is small enough to be noise.
The problem isn't the data or the signal construction. It's the market itself. China's A-share market prices stocks on policy expectations, retail momentum, and regulatory signals. Sector-relative EV/EBITDA discounts exist consistently, but they don't close on market logic. They close when Beijing opens the credit tap.
We're including this result because it's useful to understand where sector-relative value breaks down. The discipline of running the same strategy across all markets and reporting every result, including the failures, is how you learn where the signal's underlying assumptions hold.
Data: Ceta Research (FMP financial data warehouse). Returns in CNY (local currency), benchmarked against the SSE Composite (000001.SS) in CNY. Past performance does not guarantee future results. See full methodology at github.com/ceta-research/backtests.
Past performance does not guarantee future results. This is educational content, not investment advice.

