
Earnings Surprise Drift in Thailand: A Beat-Side Market After the Correction
Thailand's earnings drift is a beat-side signal vs the local SET Index. Biggest beats +1.34% at T+63, or +1.50% net of baseline, and the miss side is weaker and not significant. Q5-Q1 spread: +2.22%.

Thailand's earnings drift is a beat-side signal once you enter at a realistic price. Biggest beats on the SET produce +1.34% cumulative abnormal return at T+63 against the local SET Index, and against the near-consensus baseline that's +1.50% of genuine beat-side drift. The miss side is weaker: worst misses drift -0.89% and don't clear statistical significance. The Q5-Q1 spread is +2.22%, and most of it comes from the top. This corrects an earlier reading that called Thailand a miss-dominated market.
Contents
- Method
- The Strategy
- What We Found
- Positive vs Negative Surprise Drift
- Quintile Analysis at T+63
- Thailand's Beat Rate
- When It Works and When It Struggles
- Run It Yourself
- Limitations
- Part of a Series
- References
Data: FMP financial data warehouse, 2000–2025. Updated July 2026.
Method
| Parameter | Details |
|---|---|
| Data source | FMP earnings_surprises + stock_eod (Ceta Research warehouse) |
| Universe | SET (Thailand), market cap threshold applied per exchange |
| Period | 2000–2025 (26 years) |
| Events | 4,012 total (deduplicated per symbol/date) |
| Benchmark | SET Index (^SET.BK, local currency) |
| Execution | Enter at the next day's close (T+1), skipping the announcement day |
| Data quality | Oscillation rows removed, entry price > $1, single-window return capped at 200% |
| Surprise metric | (epsActual − epsEstimated) / ABS(epsEstimated) |
| Windows | T+1, T+5, T+21, T+63 trading days, measured from entry |
The Strategy
Post-Earnings Announcement Drift (PEAD) documents that stocks keep drifting in the direction of their earnings surprise for weeks after the announcement. Ball and Brown (1968) established it, and Bernard and Thomas (1989) confirmed it persists up to 60 trading days.
We tested the SET with a next-day entry and the local SET Index benchmark. Using the local index removes the cross-currency noise that a US-listed proxy introduces, and the next-day entry keeps the untradeable announcement move out of the drift.
What We Found
Positive vs Negative Surprise Drift
| Direction | Events | T+1 | T+5 | T+21 | T+63 |
|---|---|---|---|---|---|
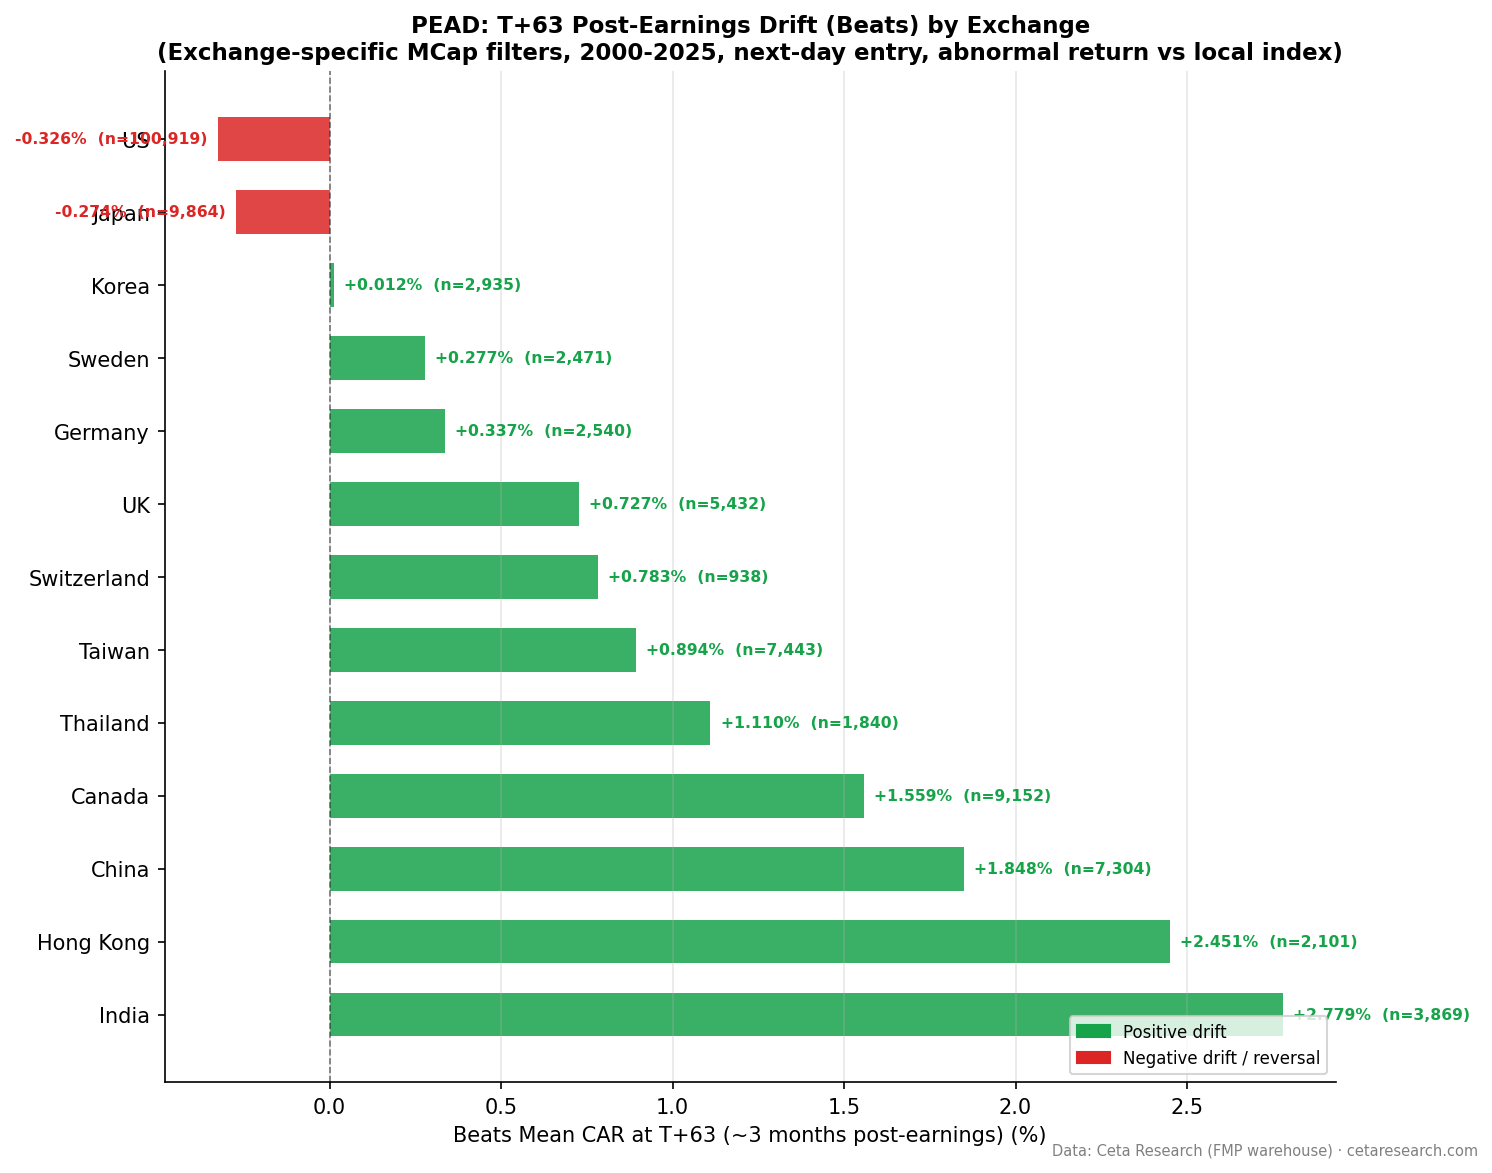
| Positive surprises | 1,840 | +0.16% | +0.41% | +1.22% | +1.11% |
| Negative surprises | 2,172 | -0.14% | -0.00% | +0.41% | -0.85% |
Positive surprises build to +1.22% by T+21, then settle at +1.11% by T+63. Beats outperform the SET Index through the window. Negative surprises are choppy, dipping and recovering before ending at -0.85%.
Quintile Analysis at T+63
| Quintile | Description | Events | CAR at T+63 | t-stat |
|---|---|---|---|---|
| Q5 | Biggest beats | 786 | +1.34% | +2.7 |
| Q4 | Moderate beats | 841 | +0.81% | +1.9 |
| Q3 | Near-consensus | 828 | -0.16% | -0.4 |
| Q2 | Moderate misses | 780 | -0.90% | -1.9 |
| Q1 | Worst misses | 777 | -0.89% | -1.7 |
The near-consensus baseline (Q3) is close to zero at -0.16%, so Thailand's raw levels are clean. The beat side carries the spread: Q5 minus Q3 is +1.50%, and Q5's t-statistic of +2.7 clears significance. The miss side is smaller and softer: Q1 minus Q3 is -0.73%, and Q1's t-statistic of -1.7 does not clear the conventional threshold. Q1 (-0.89%) and Q2 (-0.90%) are also essentially tied, so the miss tail is noisy.
The Q5-Q1 spread of +2.22% is mostly a beat-side effect. An earlier reading of this market as miss-dominated came from a same-day study against a US-listed proxy. Against the local index with a next-day entry, the beat side is the cleaner signal.
Thailand's Beat Rate
Thailand's beat rate is 45.9%, so more companies miss than beat. Thai analyst estimates aren't systematically conservative, which makes a genuine beat more informative. That's consistent with the beat side carrying the drift, the same pattern seen in India and Hong Kong.
When It Works and When It Struggles
Thailand's actionable signal is a long on the biggest beats. Q5 produces +1.34% (+1.50% net of baseline) with a significant t-statistic, and Q4 adds +0.81%. The drift builds gradually to T+21, so the entry window is wide.
The miss side isn't strong enough to short on this data. Neither Q1 nor Q2 clears significance, and they're statistically tied. Short-side implementation on the SET also faces real borrow constraints for smaller names, so even if the -0.73% net figure were cleaner, capturing it would be hard.
Run It Yourself
-- Recent large earnings surprises on SET (both beats and misses)
WITH deduped AS (
  SELECT
    es.symbol,
    es.date,
    es.epsActual,
    es.epsEstimated,
    (es.epsActual - es.epsEstimated) / NULLIF(ABS(es.epsEstimated), 0) AS std_surprise,
    ROW_NUMBER() OVER (PARTITION BY es.symbol, es.date ORDER BY es.lastUpdated DESC) AS rn
  FROM earnings_surprises es
  JOIN profile p ON es.symbol = p.symbol
  WHERE p.exchange = 'SET'
    AND p.isActivelyTrading = true
    AND CAST(es.date AS DATE) >= CURRENT_DATE - INTERVAL '90 days'
    AND ABS(es.epsEstimated) > 0.01
)
SELECT
  symbol,
  date,
  epsActual,
  epsEstimated,
  ROUND(std_surprise * 100, 1) AS surprise_pct,
  CASE WHEN std_surprise > 0.10 THEN 'BEAT' WHEN std_surprise < -0.10 THEN 'MISS' ELSE 'NEAR' END AS signal
FROM deduped
WHERE rn = 1
  AND ABS(std_surprise) > 0.10
ORDER BY date DESC, ABS(std_surprise) DESC
LIMIT 50
Run this query on Ceta Research →
Limitations
4,012 events is a small sample relative to the US (161,243) or China (21,010). Quintile sizes of roughly 800 events each are sufficient for the beat-side finding but leave the miss side underpowered, which is part of why Q1 and Q2 are noisy and tied. Early years (2000 to 2010) had sparser coverage, so the aggregate is weighted toward more recent data.
The near-zero baseline (Q3 at -0.16%) means Thailand's raw levels are clean, but we report the Q5 minus Q3 and Q1 minus Q3 decomposition for consistency across the series.
Short-side implementation on the SET faces borrow availability and cost constraints for smaller names. The signal is most actionable as a long tilt toward the biggest beats within a Thai equity allocation.
Part of a Series
- PEAD Across 13 Global Exchanges: The Drift Shrinks Everywhere
- Earnings Surprise Drift on US Stocks: Most of It Vanishes If You Wait One Day
References
- Ball, R. & Brown, P. (1968). An empirical evaluation of accounting income numbers. Journal of Accounting Research.
- Bernard, V. & Thomas, J. (1989). Post-earnings-announcement drift: Delayed price response or risk premium? Journal of Accounting Research.
- Foster, G., Olsen, C. & Shevlin, T. (1984). Earnings releases, anomalies, and the behavior of security returns. The Accounting Review.
Data: Ceta Research, FMP financial data warehouse. Not investment advice.


