
Earnings Surprise Drift in India: The Strongest Beat-Side Drift We Found
India has the strongest beat-side earnings drift we found. Positive surprises produce +2.78% CAR at T+63 vs Sensex, and it survives a next-day entry. Q5 biggest beats reach +3.83%. Q5-Q1 spread: +4.08%.

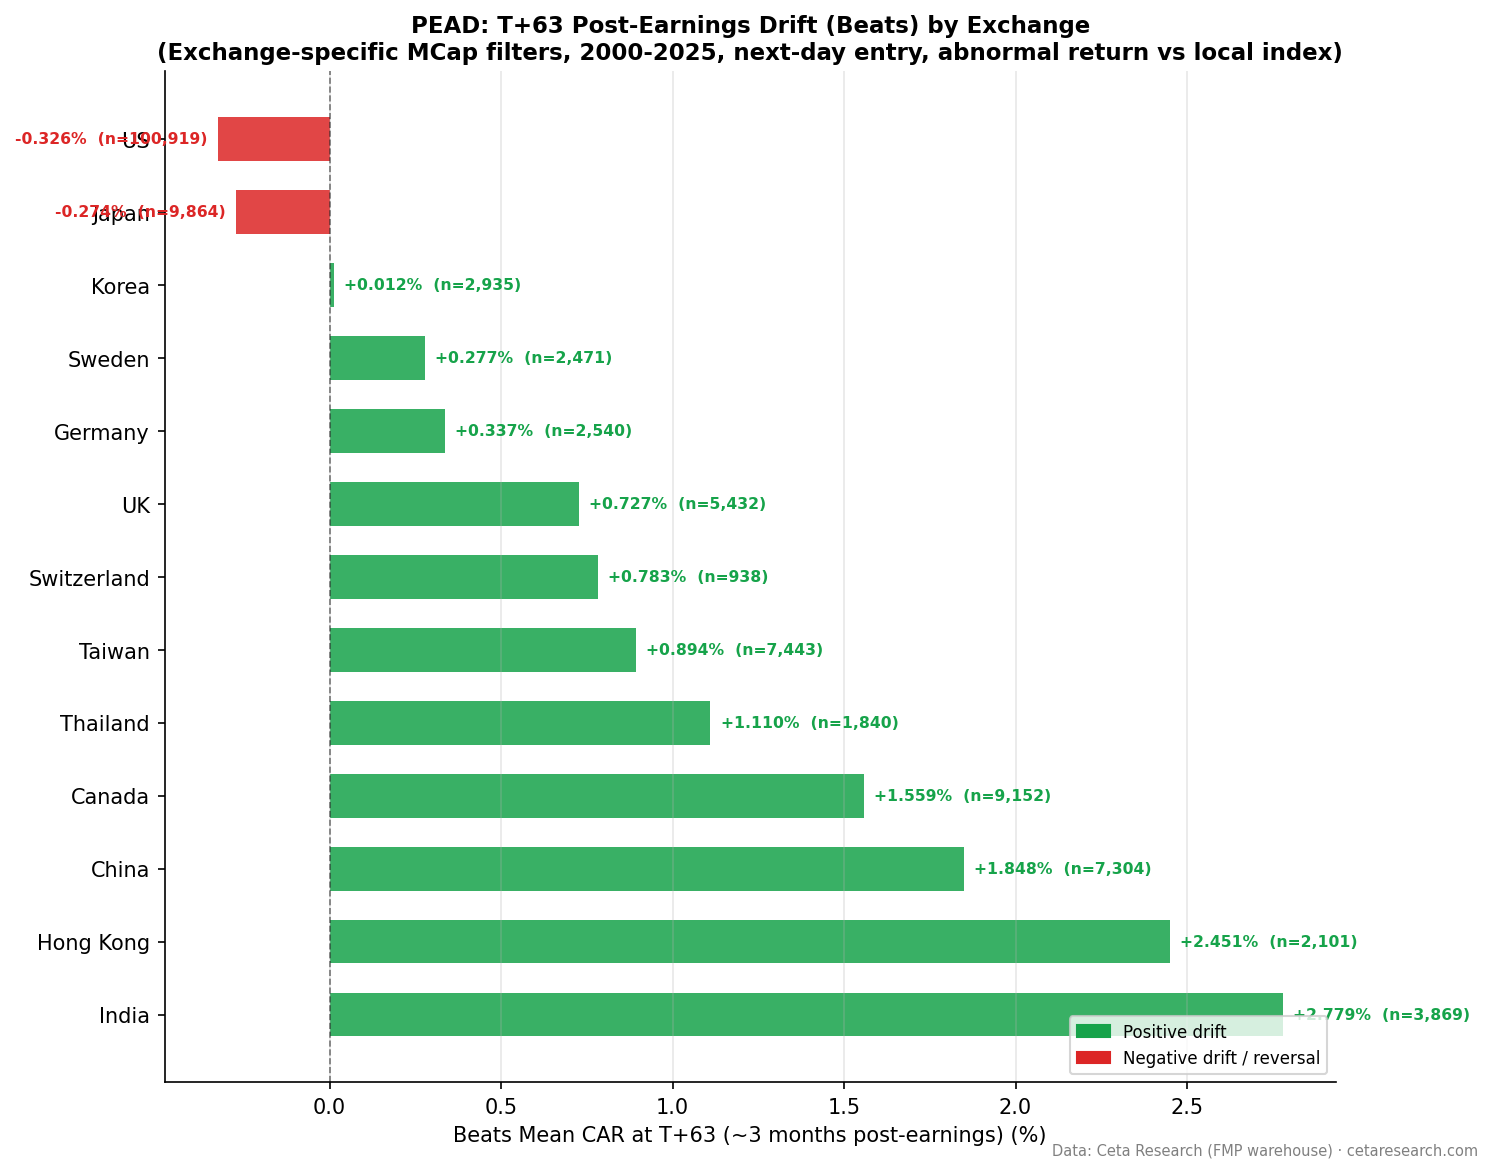
India has the strongest beat-side earnings drift of any market we tested. Beat the estimate on the NSE and your stock produces +2.78% cumulative abnormal return over the following 63 trading days, and it holds up even when you enter a full day after the announcement. The biggest beats (Q5) reach +3.83% at T+63. What makes India stand out is that the drift is genuine and gradual, not a one-day announcement pop, so realistic execution keeps most of it. India no longer has the widest overall spread (Taiwan does, driven by its miss side), but no market produces more beat-side drift than India.
Contents
- Method
- The Strategy
- What We Found
- Positive vs Negative Surprise Drift
- Quintile Analysis at T+63
- India's Beat Rate Is Below 50%
- When It Works and When It Struggles
- Run It Yourself
- Limitations
- Part of a Series
- References
Data: FMP financial data warehouse, 2000–2025. Updated July 2026.
Method
| Parameter | Details |
|---|---|
| Data source | FMP earnings_surprises + stock_eod (Ceta Research warehouse) |
| Universe | NSE, market cap threshold applied per exchange |
| Period | 2000–2025 (26 years) |
| Events | 8,128 total (deduplicated per symbol/date) |
| Benchmark | Sensex (^BSESN, local currency) |
| Execution | Enter at the next day's close (T+1), skipping the announcement day |
| Data quality | Oscillation rows removed, entry price > $1, single-window return capped at 200% |
| Surprise metric | (epsActual − epsEstimated) / ABS(epsEstimated) |
| Windows | T+1, T+5, T+21, T+63 trading days, measured from entry |
The Strategy
Post-Earnings Announcement Drift (PEAD) is a documented anomaly dating to Ball and Brown (1968). Markets underreact to earnings news, then price it in gradually over weeks. Bernard and Thomas (1989) showed the drift persists for up to 60 trading days in US markets.
We ran the same event study on the NSE, with two rules that keep the result honest. First, each position enters at the next day's close, skipping the announcement day, so we never count the untradeable overnight jump as drift. Second, the benchmark is the local Sensex, so returns are compared against the market Indian investors actually face, not a US-listed proxy.
What We Found
Positive vs Negative Surprise Drift
| Direction | Events | T+1 | T+5 | T+21 | T+63 |
|---|---|---|---|---|---|
| Positive surprises | 3,869 | +0.14% | +0.46% | +1.12% | +2.78% |
| Negative surprises | 4,259 | -0.15% | -0.22% | -0.26% | -0.09% |
India's positive drift builds the entire way to T+63. This is what genuine PEAD looks like: +0.14% at T+1, +0.46% at T+5, +1.12% at T+21, +2.78% at T+63, with a t-statistic of +10.9. Because the drift accumulates gradually rather than jumping on day one, entering a day late costs you almost nothing. That's the difference between India and markets like the US, where the beat "drift" was mostly the announcement-day gap.
The miss side barely moves. Negative surprises drift -0.09% at T+63, statistically indistinguishable from zero. India is a beat-side story. The signal is in what happens after a genuine positive surprise, not after a miss.
Quintile Analysis at T+63

| Quintile | Description | Events | CAR at T+63 | t-stat |
|---|---|---|---|---|
| Q5 | Biggest beats | 1,633 | +3.83% | +9.3 |
| Q4 | Moderate beats | 1,605 | +2.77% | +7.4 |
| Q3 | Near-consensus | 1,619 | +0.07% | +0.2 |
| Q2 | Moderate misses | 1,637 | +0.00% | +0.0 |
| Q1 | Worst misses | 1,634 | -0.25% | -0.6 |
The Q5-Q1 spread is +4.08% at T+63, second only to Taiwan (+4.52%) globally. But India's spread is built the right way: the near-consensus quintile Q3 sits at +0.07%, essentially zero, so the raw levels are clean and the spread comes from the top. Q5 beats produce +3.83% and Q4 produces +2.77%. Both are highly significant. Everything from Q3 down is flat.
Measured against that near-zero baseline, India's beat-specific drift (Q5 minus Q3) is +3.76%, the largest of any market in the study. The miss-specific figure (Q1 minus Q3) is only -0.32%. This is as one-sided as PEAD gets.
India's Beat Rate Is Below 50%
India's beat rate is 47.6%. More companies miss than beat, the inverse of the US pattern (62.6% beats). The sub-50% rate means Indian analyst estimates aren't systematically conservative. Companies aren't managing guidance to guarantee beats.
That's likely why the beat side carries so much drift. In the US, where two thirds of companies clear a lowered bar, a beat is expected and carries little information. In India, a genuine beat is rarer, and the market is slow to price it fully. The signal lives in the top two quintiles.
When It Works and When It Struggles
India's PEAD is a long-side strategy. The natural implementation is Q4 and Q5 beats: Q4 produces +2.77% and Q5 produces +3.83% at T+63. The miss side offers nothing to short (-0.25% for Q1, not significant), so this is a one-directional trade.
The drift builds gradually, which is the practical advantage. T+1 is +0.14%, T+21 is +1.12%, T+63 is +2.78%. You don't need to be first in on announcement day. The Indian market is slower to price positive news than Western markets, and the capture window is wide.
Liquidity is the constraint. Indian small and mid-caps have thinner order books, so a strategy that concentrates in smaller beat names faces more slippage on the NSE than the headline numbers suggest.
Run It Yourself
-- Recent large positive earnings surprises on NSE
WITH deduped AS (
  SELECT
    es.symbol,
    es.date,
    es.epsActual,
    es.epsEstimated,
    (es.epsActual - es.epsEstimated) / NULLIF(ABS(es.epsEstimated), 0) AS std_surprise,
    ROW_NUMBER() OVER (PARTITION BY es.symbol, es.date ORDER BY es.lastUpdated DESC) AS rn
  FROM earnings_surprises es
  JOIN profile p ON es.symbol = p.symbol
  WHERE p.exchange = 'NSE'
    AND p.marketCap >= 100000000
    AND p.isActivelyTrading = true
    AND CAST(es.date AS DATE) >= CURRENT_DATE - INTERVAL '90 days'
    AND ABS(es.epsEstimated) > 0.01
)
SELECT
  symbol,
  date,
  epsActual,
  epsEstimated,
  ROUND(std_surprise * 100, 1) AS surprise_pct
FROM deduped
WHERE rn = 1
  AND std_surprise > 0.10
ORDER BY date DESC, std_surprise DESC
LIMIT 50
Run this query on Ceta Research →
Limitations
8,128 events over 26 years is a smaller sample than the US study (161,243 events). The NSE-only universe avoids the dual-listing duplication that would inflate event counts if BSE and NSE were combined. Early years have sparse coverage, so 2000 to 2005 results carry wider confidence intervals. The Q5 t-statistic of +9.3 is strong, but individual-year results will vary.
Analyst coverage in India is thinner than in the US. Consensus estimates for small and mid-cap Indian stocks come from fewer analysts, which makes the standardized surprise noisier. The market cap filter helps but doesn't eliminate the issue.
The drift is gross of costs. Entering at the next day's close is realistic, but Indian settlement, trading hours, and slippage on smaller names will reduce the captured edge.
Part of a Series
- PEAD Across 13 Global Exchanges: The Drift Shrinks Everywhere
- Earnings Surprise Drift on US Stocks: Most of It Vanishes If You Wait One Day
References
- Ball, R. & Brown, P. (1968). An empirical evaluation of accounting income numbers. Journal of Accounting Research.
- Bernard, V. & Thomas, J. (1989). Post-earnings-announcement drift: Delayed price response or risk premium? Journal of Accounting Research.
- Foster, G., Olsen, C. & Shevlin, T. (1984). Earnings releases, anomalies, and the behavior of security returns. The Accounting Review.
Data: Ceta Research, FMP financial data warehouse. Not investment advice.


