Earnings Surprise Drift in Brazil: Both Sides Drift, Beats Lead
Brazil earnings beats produce +1.43% CAR at T+63 vs Bovespa. Misses produce -1.28%. Q5-Q1 spread: +3.22%. Both sides of the PEAD signal are active.

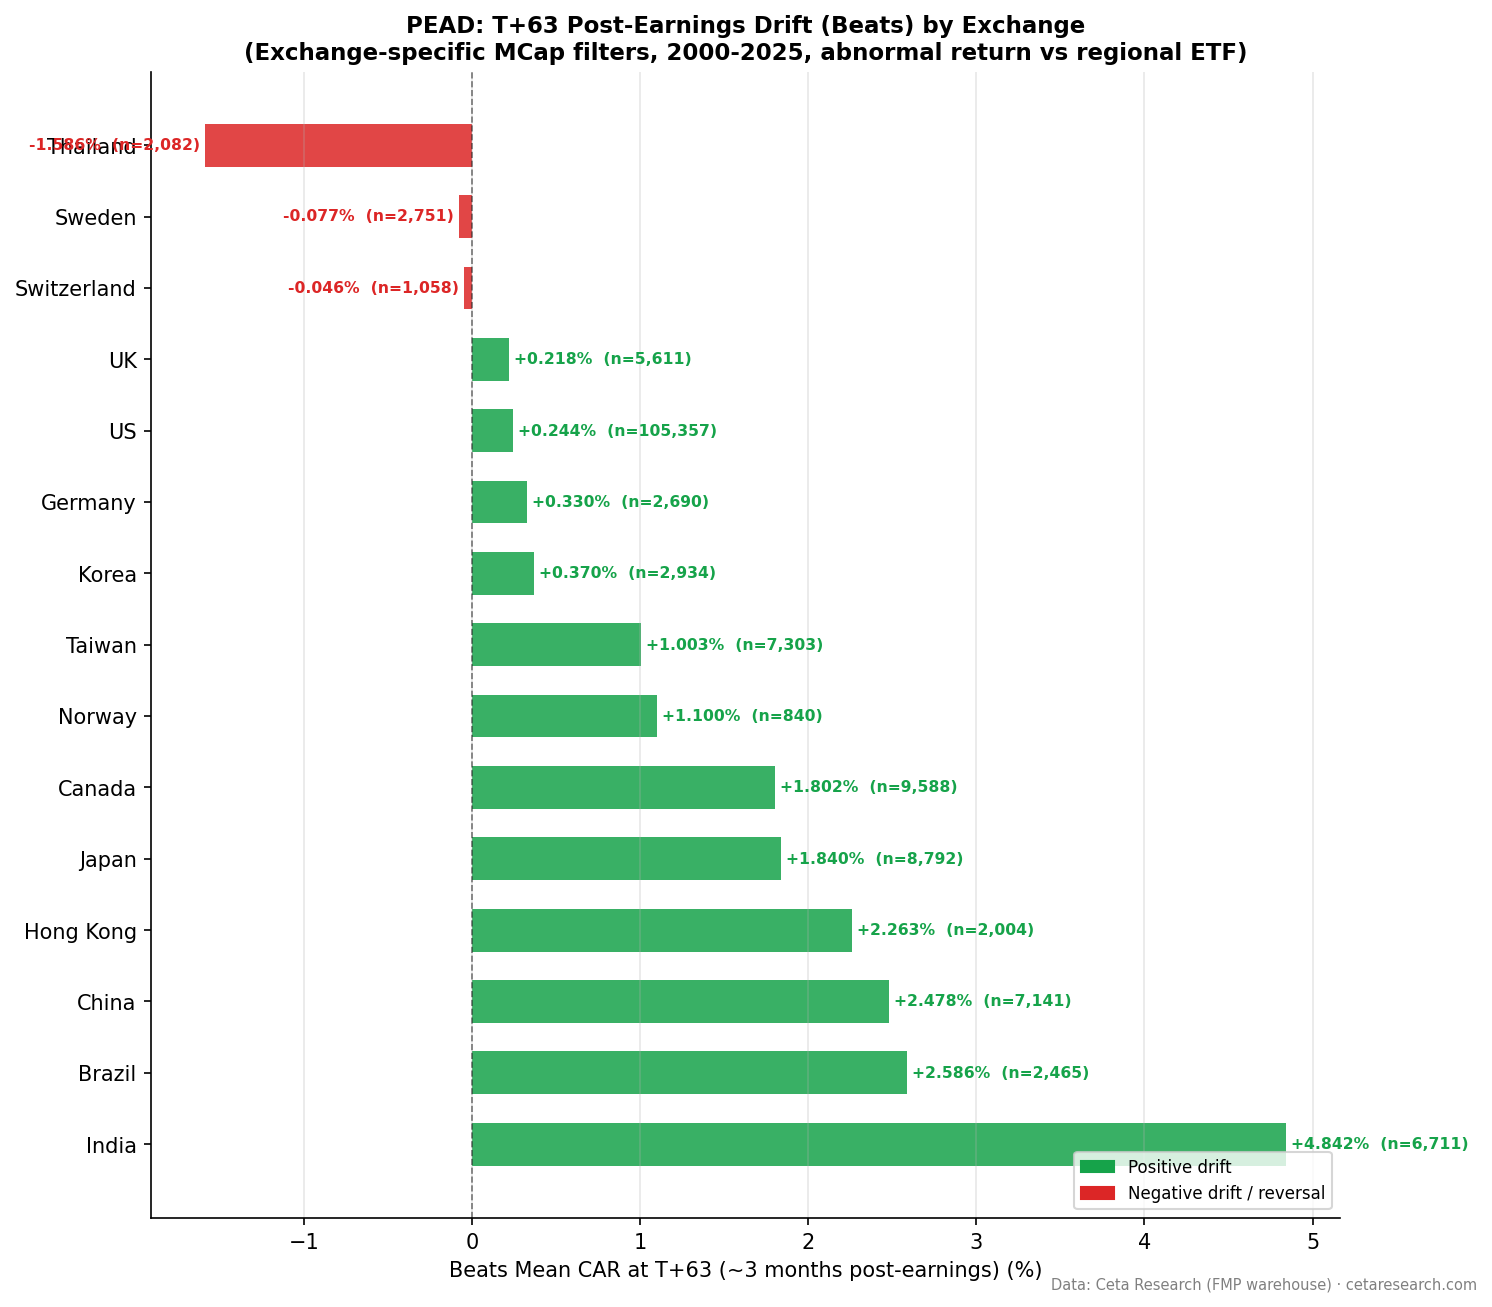
Brazil shows two-sided PEAD with the local Bovespa as benchmark. Earnings beats produce +1.43% cumulative abnormal return at T+63. Misses produce -1.28%. The Q5-Q1 spread of +3.22% has contributions from both tails. Following beats is still where the stronger signal lives, but the miss side now carries enough statistical weight to be actionable.
Contents
- Method
- The Strategy
- What We Found
- Positive vs Negative Surprise Drift
- Quintile Analysis at T+63
- Brazil vs India
- When It Works and When It Struggles
- Run It Yourself
- Limitations
- Part of a Series
- References
Data: FMP financial data warehouse, 2000–2025. Updated March 2026.
Method
| Parameter | Details |
|---|---|
| Data source | FMP earnings_surprises + stock_eod (Ceta Research warehouse) |
| Universe | SAO (B3, Brazil) — market cap threshold applied per exchange |
| Period | 2000–2025 (26 years) |
| Events | 5,321 total (deduplicated per symbol/date) |
| Benchmark | Bovespa (^BVSP, local currency) |
| Surprise metric | (epsActual − epsEstimated) / ABS(epsEstimated) |
| Windows | T+1, T+5, T+21, T+63 trading days |
The Strategy
Post-Earnings Announcement Drift (PEAD) documents that stocks continue drifting in the direction of their earnings surprise for weeks after announcement. Ball and Brown (1968) first established this. Bernard and Thomas (1989) confirmed the drift persists for up to 60 trading days. Foster, Olsen, and Shevlin (1984) analyzed different earnings windows.
Brazil presents an interesting case for PEAD: an emerging market with meaningful institutional participation, active sell-side coverage for large caps, but higher macro volatility than developed markets. Interest rates, commodity cycles, and currency moves regularly dominate earnings news. This creates an environment where earnings beats may carry more sustained signal than in markets where macro noise is lower.
What We Found
Positive vs Negative Surprise Drift
| Direction | Events | Beat% | T+1 | T+5 | T+21 | T+63 |
|---|---|---|---|---|---|---|
| Positive surprises | 2,478 | 46.6% | +0.63% | +0.87% | +1.18% | +1.43% |
| Negative surprises | 2,843 | 53.4% | -0.73% | -1.06% | -0.80% | -1.28% |
The positive drift builds steadily from T+1 (+0.63%) through T+5 (+0.87%), T+21 (+1.18%), and reaches +1.43% at T+63. It's genuine, sustained drift — no mean reversion.
The miss side is no longer negligible. Misses drift -0.73% at T+1, widen to -1.06% at T+5, partially recover at T+21 (-0.80%), and settle at -1.28% at T+63. Against the local Bovespa benchmark, Brazil earnings misses produce real negative drift. This is a shift from earlier analysis that used a US-listed ETF proxy benchmark.
Quintile Analysis at T+63
| Quintile | Description | Events | CAR T+63 | t-stat | Hit Rate |
|---|---|---|---|---|---|
| Q5 | Biggest beats | 1,065 | +1.71% | +2.8 | 50.5% |
| Q4 | Moderate beats | 1,070 | +1.42% | — | — |
| Q3 | Near-consensus | 1,070 | +0.66% | — | — |
| Q2 | Moderate misses | 1,071 | -2.37% | — | — |
| Q1 | Worst misses | 1,045 | -1.50% | -2.2 | 42.3% |
Q5 (t=2.8, hit rate 50.5%) is statistically significant. The positive drift is real but modest.
Q1 (t=-2.2, hit rate 42.3%) now clears the significance threshold. At -1.50% at T+63, the worst-miss quintile produces reliable negative drift. Brazil is no longer just a positive-side market.
Q2 (-2.37%) shows even larger negative drift than Q1. The Q2 result is the most negative in the distribution, which is unusual and may reflect specific sector or cycle dynamics within the B3 miss universe during this sample period. The aggregate Q5-Q1 spread is +3.22%.
Brazil vs India
Both Brazil and India have beat rates around 47%, reflecting analyst estimates that aren't systematically conservative. Both show PEAD on both sides with the beat side dominant.
| Metric | Brazil | India |
|---|---|---|
| Events | 5,321 | 7,743 |
| Beat rate | 46.6% | 47.3% |
| Q5 CAR T+63 | +1.71% | +5.39% |
| Q1 CAR T+63 | -1.50% | -1.50% |
| Q5-Q1 spread | +3.22% | +6.89% |
The Q1 figure is identical (-1.50%) in both markets, which is a coincidence of the numbers but reflects that both exhibit moderate miss-side drift. India's Q5 drift (+5.39%) is more than 3x Brazil's (+1.71%), likely from differences in analyst coverage density, market depth, and the structural information environment.
When It Works and When It Struggles
The positive drift in Brazil builds gradually over all four windows. Beats don't pop at T+1 and fade. The window for capture is wide.
Brazil's high nominal interest rate environment (Selic has ranged from 7.25% to 13.75% during our sample) creates a different discount rate backdrop than developed markets. Earnings beats may compound differently across rate cycles. We don't control for this in the aggregate analysis.
The 5,321 total events is smaller than most markets profiled in this series. Individual year results will show wider variance. Both Q5 (t=2.8) and Q1 (t=-2.2) clear significance thresholds, but position sizing should be conservative relative to larger-sample markets.
Run It Yourself
python3 earnings-surprise/screen.py --preset brazil
-- Recent large positive earnings surprises on B3
WITH deduped AS (
  SELECT
    es.symbol,
    es.date,
    es.epsActual,
    es.epsEstimated,
    (es.epsActual - es.epsEstimated) / NULLIF(ABS(es.epsEstimated), 0) AS std_surprise,
    ROW_NUMBER() OVER (PARTITION BY es.symbol, es.date ORDER BY es.lastUpdated DESC) AS rn
  FROM earnings_surprises es
  JOIN profile p ON es.symbol = p.symbol
  WHERE p.exchange = 'SAO'
    AND p.isActivelyTrading = true
    AND es.date >= CURRENT_DATE - INTERVAL '90 days'
    AND ABS(es.epsEstimated) > 0.01
)
SELECT
  symbol,
  date,
  epsActual,
  epsEstimated,
  ROUND(std_surprise * 100, 1) AS surprise_pct
FROM deduped
WHERE rn = 1
  AND std_surprise > 0.10
ORDER BY date DESC, std_surprise DESC
LIMIT 50
Run this query on Ceta Research →
Limitations
5,292 events over 26 years is a relatively thin sample. Brazil had fewer listed companies with systematic analyst consensus coverage in the early 2000s. Coverage density on B3 has improved significantly post-2010. Results from the first decade carry wider confidence intervals.
Currency volatility is a confounding factor for international investors. The BRL/USD exchange rate has moved substantially over the sample period (from ~2.3 in 2000 to ~5.0+ at points in the 2020s). The CAR computation uses BRL-denominated returns against a BRL benchmark, so within-study FX effects cancel, but USD-denominated investors will face additional variance.
The Q1 t-stat of -2.2 clears the conventional 5% threshold, but with 1,045 events it's a borderline finding. Practitioners running short-side strategies on Brazilian misses should treat this as weak-to-moderate evidence, not a strong signal like India's Q5 (t=11.8) or the US Q1 (t=-21.7).
Part of a Series
- PEAD Across 14 Global Exchanges: The Drift Is Universal
- Earnings Surprise Drift on US Stocks: 170,000 Events, 26 Years
References
- Ball, R. & Brown, P. (1968). An empirical evaluation of accounting income numbers. Journal of Accounting Research.
- Bernard, V. & Thomas, J. (1989). Post-earnings-announcement drift: Delayed price response or risk premium? Journal of Accounting Research.
- Foster, G., Olsen, C. & Shevlin, T. (1984). Earnings releases, anomalies, and the behavior of security returns. The Accounting Review.
Data: Ceta Research, FMP financial data warehouse