
Earnings Growth Consistency on UK Stocks (LSE): 25-Year Backtest
Screened LSE for 3-year net income growth streaks, ROE > 8%, D/E < 2.0. Result: 12.35% CAGR vs 1.23% FTSE 100 price index (+11.12%), max drawdown -22.0%, 92% win rate (highest of 17 exchanges). 2008: +0.9% while FTSE 100 fell -22.0%. FTSE 100 benchmark is price-only.

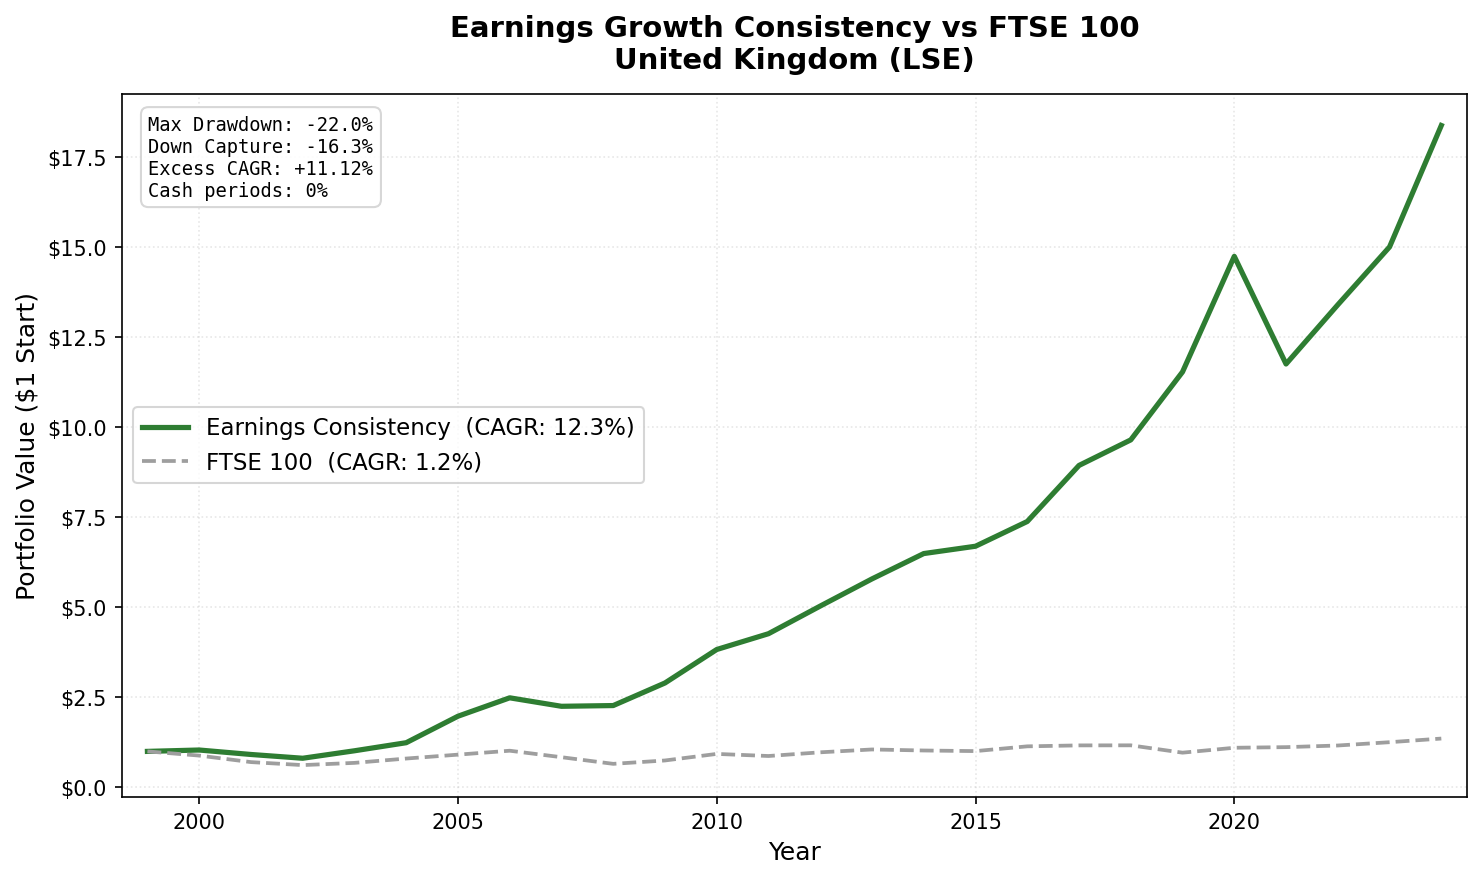
The UK produced the largest local-benchmark alpha in the study: +11.12% per year over the FTSE 100. CAGR of 12.35% vs 1.23% for the FTSE 100 price index, with a 92% annual win rate (23 of 25 years), the highest of all 17 exchanges tested.
Contents
- Method
- The Signal
- The Screen (SQL)
- What We Found
- Strong alpha vs local market. Lowest drawdown of any fully-invested exchange.
- Annual returns (July-to-July)
- 2008: The defining year
- 2005: The standout year
- 2019: The decoupling year
- 2016 and 2021: The miss years
- Why the UK Works
- Backtest Methodology
- Limitations
- Takeaway
- Part of a Series
Max drawdown of -22.0%, the lowest of any fully-invested exchange in the study. Down capture of -16.3% vs the FTSE 100: the portfolio rose, on average, when the local market fell.
Note on the benchmark: FTSE 100 returns here are price index returns (^FTSE from FMP), which don't include dividends. FTSE 100 total return with dividends historically adds 3-4% per year. Against a total-return FTSE 100, the excess would be roughly 6-7% rather than 11%. Both comparisons show clear alpha.
0 cash periods across all 25 years. The LSE consistently had qualifying companies, though the eligible universe is small (13.4 stocks on average).
Data: FMP financial data warehouse, 2000–2025. Updated June 2026.
Method
Universe: LSE-listed stocks with market cap > £300M, actively trading Period: July 2000 to July 2025 (25 annual holding periods) Rebalancing: Annual, each July. Top 30 by ROE, equal weight. Benchmark: FTSE 100 price index (GBP; price return only, does not include dividends) Execution: Next-day close (MOC) Cash rule: Hold cash if fewer than 10 stocks qualify. Data: Ceta Research (FMP financial data warehouse, 45-day point-in-time lag)
The Signal
Earnings streak: Net income grew year-over-year in each of the last three fiscal years. Four data points required. All must be positive.
ROE > 8%: Filters for capital efficiency. UK companies with consistent earnings but low returns on equity are excluded.
D/E < 2.0: Moderate leverage cap. Accommodates companies with manageable debt loads while excluding financially distressed issuers.
Portfolio: top 30 by ROE descending, equal weight.
The Screen (SQL)
WITH
fy_income AS (
    SELECT symbol, netIncome, dateEpoch,
        ROW_NUMBER() OVER (PARTITION BY symbol ORDER BY dateEpoch DESC) AS rn
    FROM income_statement
    WHERE period = 'FY'
      AND netIncome IS NOT NULL
      AND symbol IN (SELECT DISTINCT symbol FROM profile WHERE exchange IN ('LSE'))
),
streak AS (
    SELECT y1.symbol
    FROM fy_income y1
    JOIN fy_income y2 ON y1.symbol = y2.symbol AND y2.rn = 2
    JOIN fy_income y3 ON y1.symbol = y3.symbol AND y3.rn = 3
    JOIN fy_income y4 ON y1.symbol = y4.symbol AND y4.rn = 4
    WHERE y1.rn = 1
      AND y1.netIncome > y2.netIncome
      AND y2.netIncome > y3.netIncome
      AND y3.netIncome > y4.netIncome
      AND y4.netIncome > 0
)
SELECT
    s.symbol,
    p.companyName,
    p.sector,
    ROUND(k.returnOnEquityTTM * 100, 1) AS roe_pct,
    ROUND(f.debtToEquityRatioTTM, 2)    AS debt_to_equity,
    ROUND(p.marketCap / 1e9, 2)         AS market_cap_b
FROM streak s
JOIN key_metrics_ttm k ON s.symbol = k.symbol
JOIN financial_ratios_ttm f ON s.symbol = f.symbol
JOIN profile p ON s.symbol = p.symbol
WHERE k.returnOnEquityTTM > 0.08
  AND f.debtToEquityRatioTTM >= 0
  AND f.debtToEquityRatioTTM < 2.0
  AND p.marketCap > 300000000
  AND p.exchange IN ('LSE')
  AND p.isFund = false
  AND p.isEtf = false
  AND p.isActivelyTrading = true
QUALIFY ROW_NUMBER() OVER (PARTITION BY p.companyName
                           ORDER BY p.averageVolume DESC) = 1
ORDER BY k.returnOnEquityTTM DESC
LIMIT 30
Run this query on Ceta Research
What We Found
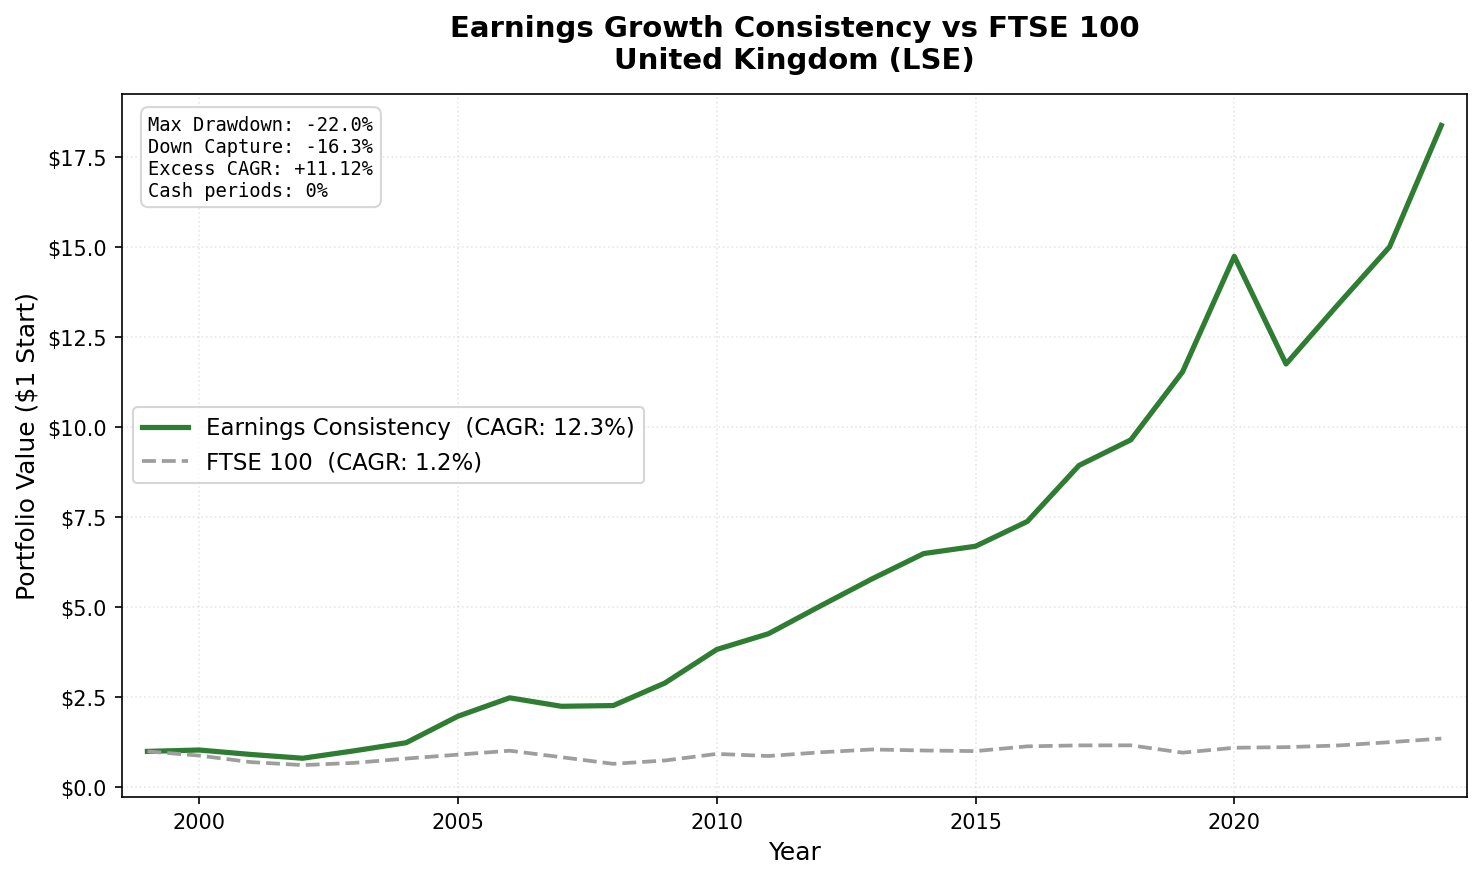
Strong alpha vs local market. Lowest drawdown of any fully-invested exchange.
| Metric | Earnings Consistency | FTSE 100 (price) |
|---|---|---|
| CAGR | 12.35% | 1.23% |
| Sharpe Ratio | 0.528 | - |
| Max Drawdown | -22.0% | - |
| Down Capture | -16.3% | 100% |
| Win Rate (annual vs FTSE 100) | 92% | - |
| Avg Stocks per Period | 13.4 | - |
| Cash Periods | 0 of 25 | - |
The FTSE 100 CAGR of 1.23% is the price-only return of the index over this period. The FTSE 100 is a high-dividend index, total return with dividends reinvested would add roughly 3-4% per year historically. Against total-return FTSE, the excess is roughly 6-7%. Both comparisons show clear and persistent alpha.
Win rate of 92% (23 of 25 years) is the highest of all 17 exchanges tested.
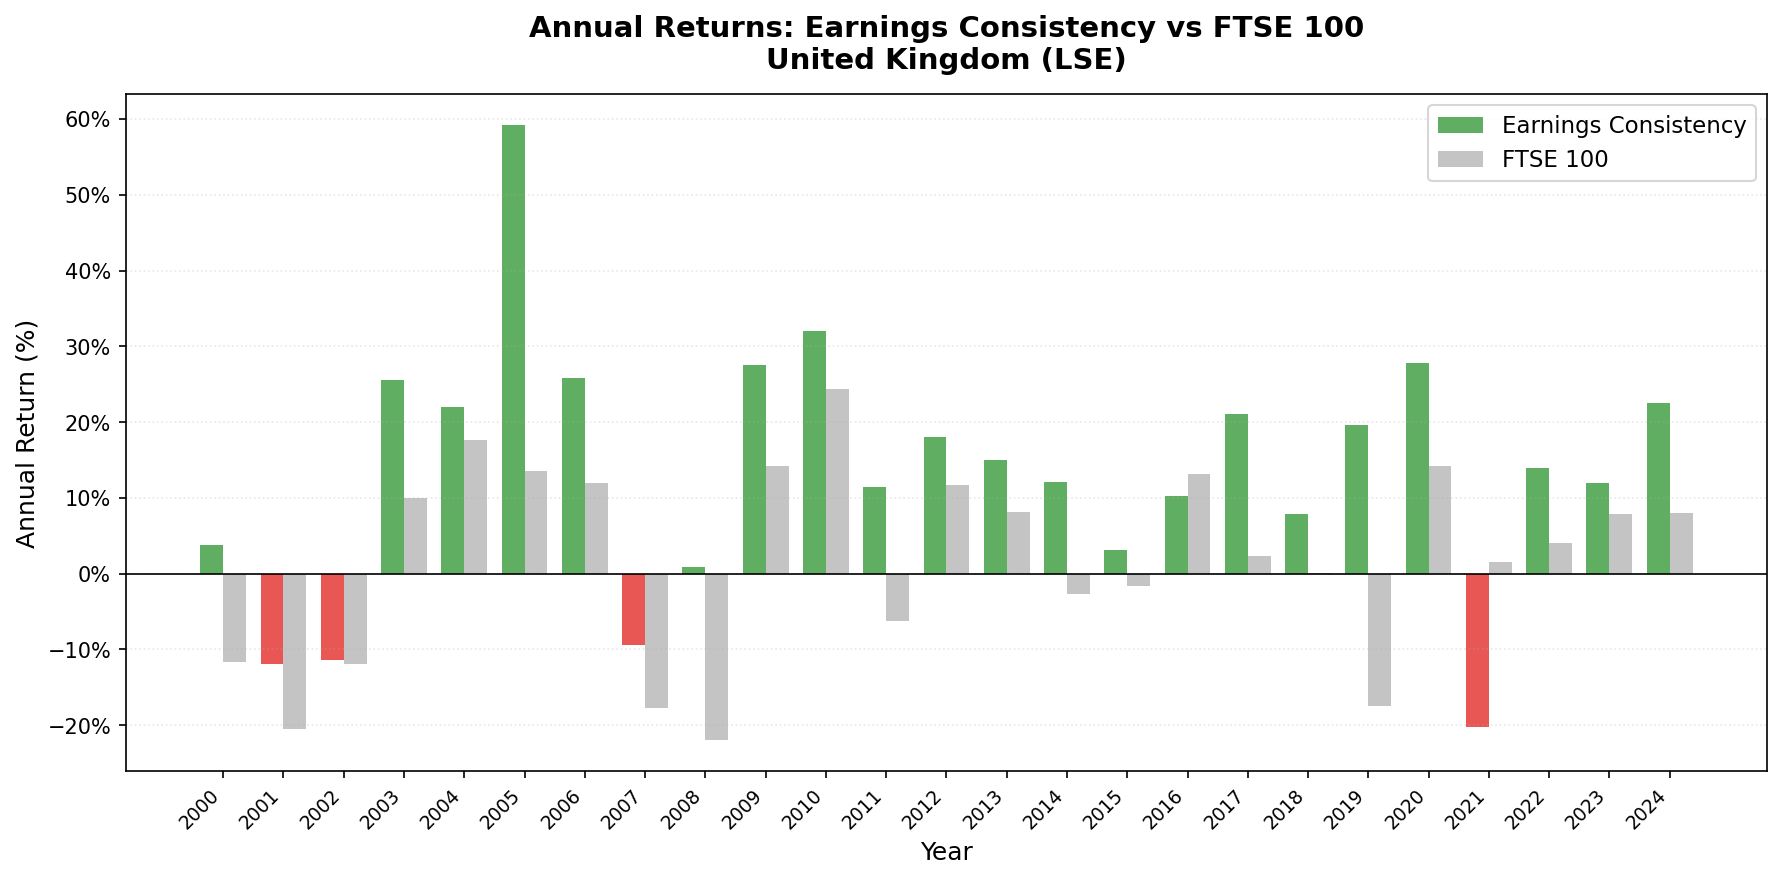
Annual returns (July-to-July)
| Year | Portfolio | FTSE 100 | Excess |
|---|---|---|---|
| 2000 | +3.8% | -11.7% | +15.5% |
| 2001 | -11.9% | -20.5% | +8.5% |
| 2002 | -11.4% | -11.9% | +0.4% |
| 2003 | +25.6% | +10.0% | +15.6% |
| 2004 | +22.1% | +17.6% | +4.4% |
| 2005 | +59.2% | +13.5% | +45.7% |
| 2006 | +25.9% | +12.0% | +13.9% |
| 2007 | -9.5% | -17.7% | +8.2% |
| 2008 | +0.9% | -22.0% | +22.9% |
| 2009 | +27.6% | +14.3% | +13.3% |
| 2010 | +32.0% | +24.4% | +7.7% |
| 2011 | +11.5% | -6.3% | +17.7% |
| 2012 | +18.0% | +11.8% | +6.2% |
| 2013 | +15.0% | +8.1% | +6.8% |
| 2014 | +12.2% | -2.7% | +14.9% |
| 2015 | +3.1% | -1.6% | +4.8% |
| 2016 | +10.3% | +13.1% | -2.9% |
| 2017 | +21.1% | +2.3% | +18.8% |
| 2018 | +7.9% | +0.1% | +7.8% |
| 2019 | +19.6% | -17.4% | +37.0% |
| 2020 | +27.8% | +14.2% | +13.7% |
| 2021 | -20.3% | +1.5% | -21.8% |
| 2022 | +14.0% | +4.1% | +9.9% |
| 2023 | +12.0% | +7.9% | +4.1% |
| 2024 | +22.5% | +8.1% | +14.4% |
2008: The defining year
2008 is the clearest illustration of the UK result. While the FTSE 100 fell -22.0% as the financial crisis unfolded, the LSE earnings consistency portfolio returned +0.9%, actually gaining slightly. That's a 23-point gap in the worst market environment in a generation.
The mechanism: UK companies with three consecutive years of earnings growth going into 2008 were concentrated in consumer staples, specialty industrials, healthcare, and mid-cap services businesses. They had demonstrated earnings resilience through the dot-com correction and the mid-2000s expansion. They continued demonstrating it in 2008.
The max drawdown of -22.0% for the entire 25-year period is the lowest of any fully-invested exchange in the study. The portfolio never experienced a sustained multi-year drawdown because the earnings filter excluded the companies most exposed to each crisis.
2005: The standout year
2005 was the portfolio's single best year: +59.2% vs FTSE 100 +13.5%, a +45.7-point excess. UK mid-caps surged, and the earnings-consistent names captured the move while staying decoupled from the large-cap index. Combined with strong early years (2000: +3.8% vs -11.7%; 2006: +25.9% vs +12.0%), the first half of the backtest built most of the cumulative lead.
2019: The decoupling year
2019: +19.6% vs FTSE 100 -17.4% (+37.0% excess), the second-largest excess year after 2005. The FTSE 100 went negative on Brexit uncertainty. The earnings-consistent portfolio, focused on domestic mid-cap earners rather than FTSE 100 multinationals, decoupled from the index's Brexit exposure entirely.
2016 and 2021: The miss years
The strategy underperformed the FTSE 100 in only two years: 2016 (-2.9% excess) and 2021 (-21.8% excess). 2016 coincided with the FTSE 100 rising on sterling weakness (large international companies in the index benefit when GBP falls), a tailwind the mid-cap domestic earners didn't share. 2021 was the single bad year: the portfolio fell -20.3% while the FTSE 100 gained +1.5%, as the post-COVID rotation favored large-cap value and commodity names the screen excludes.
Why the UK Works
The UK earnings consistency filter selects a different universe than the FTSE 100 benchmark suggests. The FTSE 100 skews toward large international companies: global commodity firms, pharmaceutical multinationals, banking groups. These companies grow earnings episodically, not consistently.
The earnings consistency filter removes them. What remains is a portfolio weighted toward mid-cap domestic services, consumer goods, specialty industrials, and healthcare. These companies grow earnings steadily because their revenue isn't tied to commodity prices, exchange rates, or investment banking activity cycles.
That composition explains the -22.0% max drawdown, the lowest of any fully-invested exchange. The 2008 financial crisis hit large banks and international commodity firms hardest. The earnings consistency portfolio had already excluded those companies.
Backtest Methodology
| Parameter | Choice |
|---|---|
| Universe | LSE, Market Cap > £300M |
| Signal | 3-year net income growth streak, ROE > 8%, D/E < 2.0 |
| Portfolio | Top 30 by ROE, equal weight |
| Rebalancing | Annual (July) |
| Cash rule | Hold cash if < 10 qualify |
| Benchmark | FTSE 100 price index (GBP) |
| Execution | Next-day close (MOC) |
| Period | 2000-2025 (25 years, 25 annual periods) |
| Data lag | Point-in-time, 45-day lag |
Limitations
Benchmark dividend gap. FTSE 100 returns here are price-only. FTSE 100 total return (including dividends) historically adds 3-4% per year. Against a total-return FTSE 100, the excess narrows to roughly 6-7% per year. Still strong, but the 11.12% headline excess is partly a benchmark construction difference.
Small eligible universe. The LSE screen averages just 13.4 qualifying stocks, the most concentrated of the dedicated-blog markets. A 13-stock equal-weight portfolio carries meaningful idiosyncratic risk; single-name moves drive annual results.
Mid-cap bias. The earnings consistency filter tends to select mid-cap businesses. Large-cap FTSE 100 companies (multinationals, commodity firms, banks) fail the consistency screen more often. The portfolio doesn't represent the FTSE 100's sector composition, which is part of why it outperforms.
Currency effects. Portfolio returns are in GBP. Both the portfolio and FTSE 100 are GBP-denominated, so currency movements don't affect the relative comparison. Cross-currency effects only matter if comparing to a USD benchmark like SPY.
Takeaway
The UK earnings consistency result makes a specific claim: UK companies with proven earnings growth trajectories massively outperform the local FTSE 100. CAGR of 12.35% vs 1.23% for the FTSE 100 price index, +11.12% excess. Win rate of 92%. Max drawdown of -22.0% vs the FTSE 100's deeper losses.
The signal works in the UK for the same reason it works in Canada and the US: earnings consistency filters for durable business models. The FTSE 100 is dominated by commodity firms, banks, and multinationals, companies whose earnings are episodic. The earnings consistency screen excludes them and finds mid-cap domestic businesses that compound steadily.
Part of a Series
- Earnings Growth Consistency: US Results: 11.55% CAGR, flagship study
- Earnings Growth Consistency: Canada Results: best Sharpe, negative down capture
- Earnings Growth Consistency: India Results: 10.04% CAGR, underperforms Sensex
- Earnings Growth Consistency: Germany Results: European result
- Earnings Growth Consistency: Global Comparison: 17 exchanges
Data: Ceta Research, FMP financial data warehouse. Universe: LSE. Annual rebalance (July), equal weight (top 30 by ROE), 2000-2025. Benchmark: FTSE 100 price index (price return only, does not include dividends).
Past performance does not guarantee future results. This is educational content, not investment advice.

