Earnings Beat Streaks: Does Consecutive Beating Drive Stock Returns?
We analyzed 73,386 beat streak events across US exchanges from 2000-2025. A second consecutive earnings beat produces +0.77% T+21 abnormal return vs SPY. The sweet spot is streak 2 and 3. Very long streaks show diminishing returns.

Earnings Beat Streaks in the US: 73,000 Events, 25 Years of Drift
When a company beats analyst EPS estimates for two or more consecutive quarters, something measurable happens after each additional beat. We tracked this across NYSE, NASDAQ, and AMEX from 2000 to 2025 and found statistically significant cumulative abnormal returns at every window out to 63 days. The drift is real, but it's compressing.
Contents
Method
Universe: NYSE, NASDAQ, and AMEX-listed stocks with market cap above $1B USD. We required at least two consecutive quarters of EPS beats to enter the sample. Data sourced from FMP's earnings surprises endpoint, 2000–2025.
Beat definition: epsActual > epsEstimated where ABS(epsEstimated) > 0.01. The floor on estimated EPS filters near-zero estimates where percentage beats carry no information.
Windows: Cumulative abnormal return (CAR) measured at T+1, T+5, T+21, and T+63 trading days after each streak-extending announcement. T+0 is excluded to avoid confounding intraday moves.
Benchmark: SPY (SPDR S&P 500 ETF). CAR = stock return minus SPY return over each window.
Streak counting: A streak resets to zero on any miss. Streak length is the count at the time of announcement. A company on its 4th consecutive beat contributes one event to the "streak 4" bucket.
Total events: 73,386
What We Found
The T+1 drift is the most robust signal. +0.52% with a t-stat of 27.86 across 73,386 events is not noise. The market is still surprised when a company extends a streak it's already on.
The more interesting finding is what happens at T+21 vs T+63. The 21-day drift (+0.55%, t=14.83) is actually stronger than the 1-day reaction. That's consistent with slow incorporation of information. But by T+63, the drift has fallen to +0.31% (t=4.95) and the hit rate drops below 50%.
The T+63 compression is the real story. In the early 2000s, the 63-day drift from earnings beat streaks was substantially larger. Institutional arbitrage, faster information processing, and algorithmic earnings plays have eroded it. The signal exists, but the window to capture it is shorter than it used to be.
| Window | Mean CAR | t-stat | N | Hit Rate |
|---|---|---|---|---|
| T+1 | +0.52% | 27.86 | 73,386 | 53.3% |
| T+5 | +0.49% | 19.60 | 73,349 | 52.1% |
| T+21 | +0.55% | 14.83 | 73,301 | 51.3% |
| T+63 | +0.31% | 4.95 | 73,070 | 49.2% |
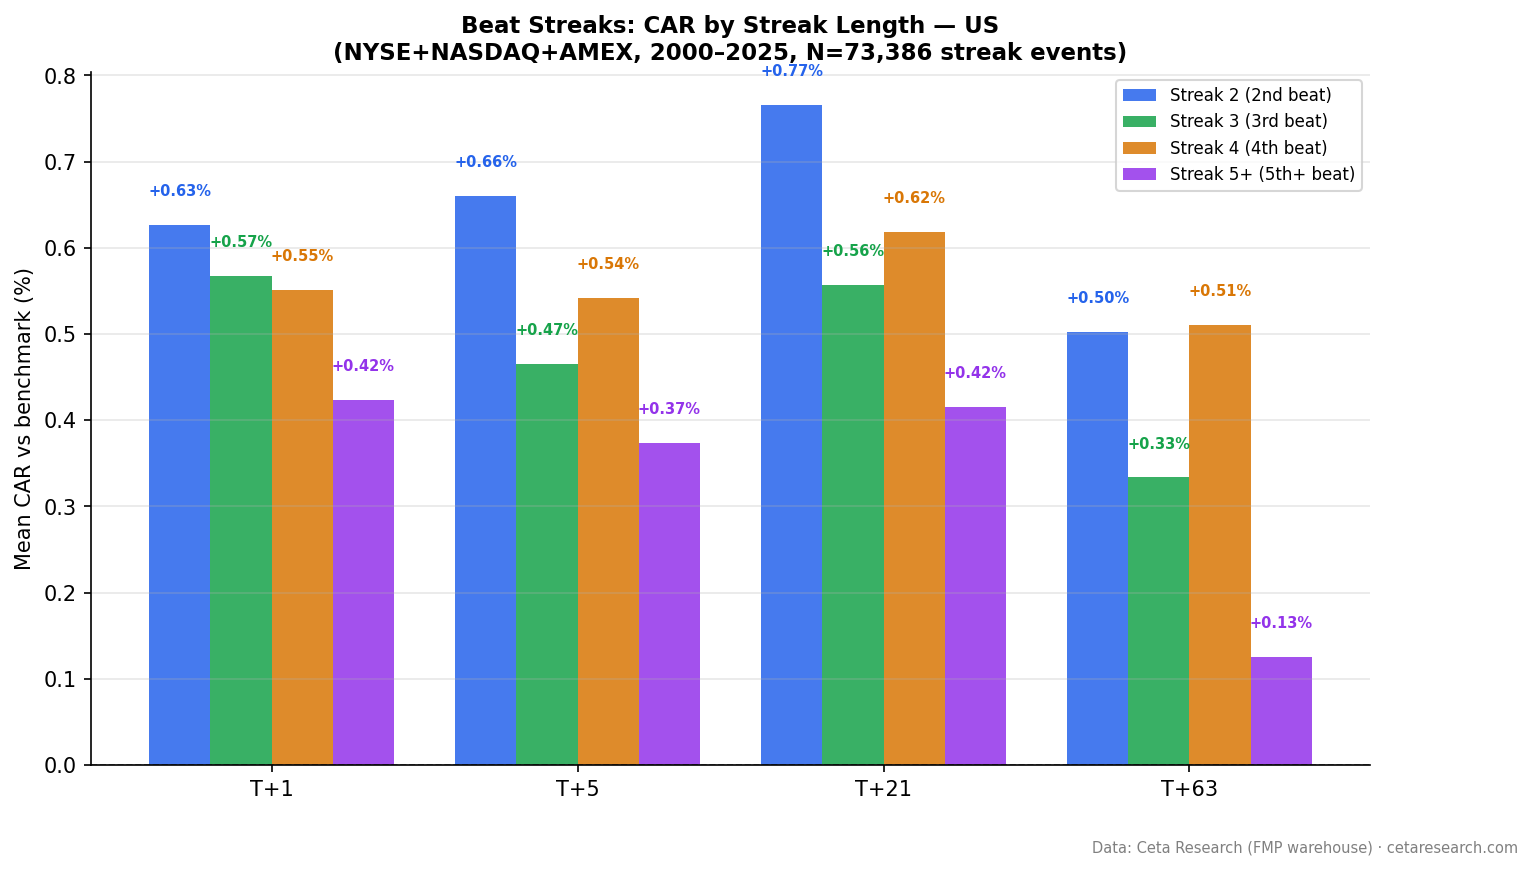
Streak Length Breakdown
Streak 2 is the strongest category. The first time a company extends a streak, the market's reaction is largest. By streak 5+, the T+21 return has declined to +0.42% and T+63 to +0.13%.
| Streak | N | T+1 | T+21 | T+63 | t(21) |
|---|---|---|---|---|---|
| Streak 2 | 19,632 | +0.63% | +0.77% | +0.50% | 9.88 |
| Streak 3 | 12,609 | +0.57% | +0.56% | +0.33% | 5.99 |
| Streak 4 | 8,622 | +0.55% | +0.62% | +0.51% | 5.71 |
| Streak 5+ | 32,523 | +0.42% | +0.42% | +0.13% | 7.90 |
Two things stand out. First, streak 4 outperforms streak 3 at both T+21 and T+63. The decay isn't monotonic, which suggests the market might underprice the 4th consecutive beat specifically. Second, the streak 5+ bucket has the most events (32,523) because once a company establishes a streak, it tends to stay in it. The drift here is smaller in magnitude but still statistically significant given the sample size.
The practical implication: for short-term traders, streak 2 is the best entry point. For longer holds, streak 4 has historically shown a secondary dip before recovering at the T+21 and T+63 horizons.
The SQL Screen
This query finds stocks currently on a beat streak of 3 or more consecutive quarters, ranked by streak length:
WITH ordered_earnings AS (
    SELECT symbol,
        CAST(date AS DATE) AS event_date,
        epsActual AS actual,
        epsEstimated AS estimated,
        CASE WHEN epsActual > epsEstimated THEN 1 ELSE 0 END AS is_beat,
        ROUND((epsActual - epsEstimated) / ABS(NULLIF(epsEstimated, 0)) * 100, 1) AS surprise_pct,
        ROW_NUMBER() OVER (PARTITION BY symbol ORDER BY date DESC) AS recency_rank
    FROM earnings_surprises
    WHERE epsEstimated IS NOT NULL
      AND ABS(epsEstimated) > 0.01
      AND epsActual IS NOT NULL
),
streak_calc AS (
    SELECT *, SUM(CASE WHEN is_beat = 0 THEN 1 ELSE 0 END)
        OVER (PARTITION BY symbol ORDER BY recency_rank
              ROWS UNBOUNDED PRECEDING) AS streak_breaker
    FROM ordered_earnings
),
streaks AS (
    SELECT symbol,
        COUNT(*) AS current_streak,
        ROUND(AVG(surprise_pct), 1) AS avg_surprise_pct,
        MIN(event_date) AS streak_start,
        MAX(event_date) AS latest_beat
    FROM streak_calc
    WHERE streak_breaker = 0 AND is_beat = 1
    GROUP BY symbol
    HAVING COUNT(*) >= 3
)
SELECT s.symbol, s.current_streak, s.avg_surprise_pct,
    s.streak_start, s.latest_beat,
    ROUND(k.mktCapUSD / 1e9, 1) AS mktcap_bn
FROM streaks s
JOIN key_metrics k ON s.symbol = k.symbol AND k.period = 'TTM'
WHERE k.mktCapUSD > 1000000000
QUALIFY ROW_NUMBER() OVER (PARTITION BY s.symbol ORDER BY k.date DESC) = 1
ORDER BY s.current_streak DESC, s.avg_surprise_pct DESC
LIMIT 30
The streak_breaker column is the key logic. Earnings are ordered from most recent to oldest (recency_rank). Each time a miss appears, the running sum increments. Filtering to streak_breaker = 0 keeps only quarters from the current unbroken run. The QUALIFY clause deduplicates the key_metrics join to the most recent TTM row per symbol.
Run this screen live on Ceta Research → (pre-loaded query, no account required)
Why It Works
Post-earnings announcement drift (PEAD) has been documented since Ball and Brown (1968). The beat streaks variation adds a layer: the market appears to underweight the information content of a continuing streak.
Myers, Myers, and Skinner (2007) showed that companies with long EPS streaks are valued as if analysts expect the streak to continue, but stock price reactions to individual beats within a streak are subdued. The market discounts each beat as "expected" rather than informative.
Loh and Warachka (2012) found that stocks with high idiosyncratic volatility show stronger PEAD after earnings beats. Streak stocks tend to be lower-volatility compounders, which partly explains why the T+1 reaction is moderate rather than explosive. The slow drift out to T+21 is consistent with their findings on investor under-reaction to streak information specifically.
The mechanistic explanation: most investors anchor to the streak and don't recalibrate their forward expectations aggressively enough after each beat. The signal is that the market keeps being surprised by something that is, in retrospect, predictable.
Limitations
Survivorship bias: This study uses stocks with available earnings data. Companies that delisted due to failure are underrepresented, which biases CAR estimates upward.
Market cap filter: The $1B floor excludes small caps, where the effect is likely larger but liquidity is worse. The results here apply to institutional-grade names.
Benchmark simplification: SPY is a US-only market-cap-weighted index. Sector tilts in beat streak stocks (typically technology, healthcare, consumer discretionary) mean SPY may not be the tightest benchmark. Sector-adjusted CARs would likely be smaller.
Transaction costs: The T+1 numbers look tradeable in aggregate, but earnings announcements happen after hours. Getting filled at the open after a surprise can be expensive for larger positions. The T+21 drift is more practically accessible.
Look-ahead bias in the screen: The SQL query above is designed as a screening tool, not a backtest entry signal. The historical results in this study use point-in-time data. Applying the screen as-is to historical dates would require careful data snapshotting.
Takeaway
US beat streaks produce statistically reliable short-term drift at T+1 and T+21. The T+63 drift is still significant but weaker than it was in earlier decades. Early streaks (streak 2) are the strongest entry point. Streak 5+ still works but the margin for error is smaller.
The more interesting finding is that this signal exists at all, given how well-studied earnings drift is. Beat streaks are a specific, filterable subset of PEAD. The consistency of the T+21 result across 25 years and 73,000 events suggests it won't disappear, even if it's been partially arbitraged.
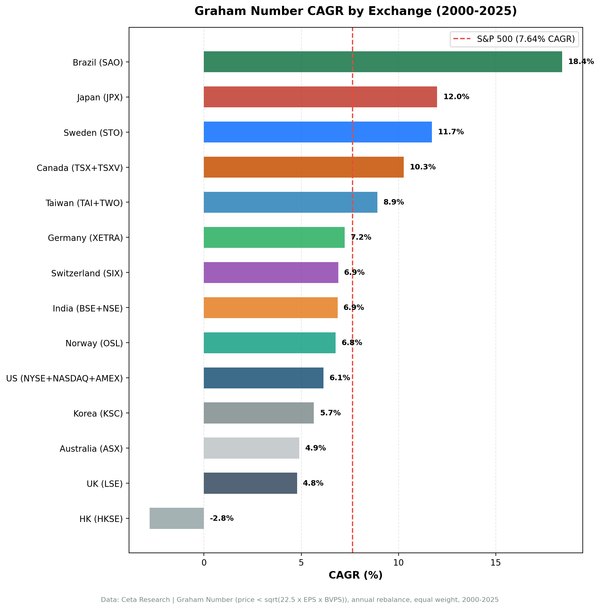
Part of a series: Beat streaks analyzed across 16 exchanges. See Canada, Japan, Taiwan, India, Brazil, and the global comparison.
Data: FMP earnings surprises + key metrics, 2000–2025. NYSE, NASDAQ, AMEX. Market cap > $1B USD. 73,386 streak events.