Beat Streaks in Brazil: +2.49% T+63 in an Emerging Market
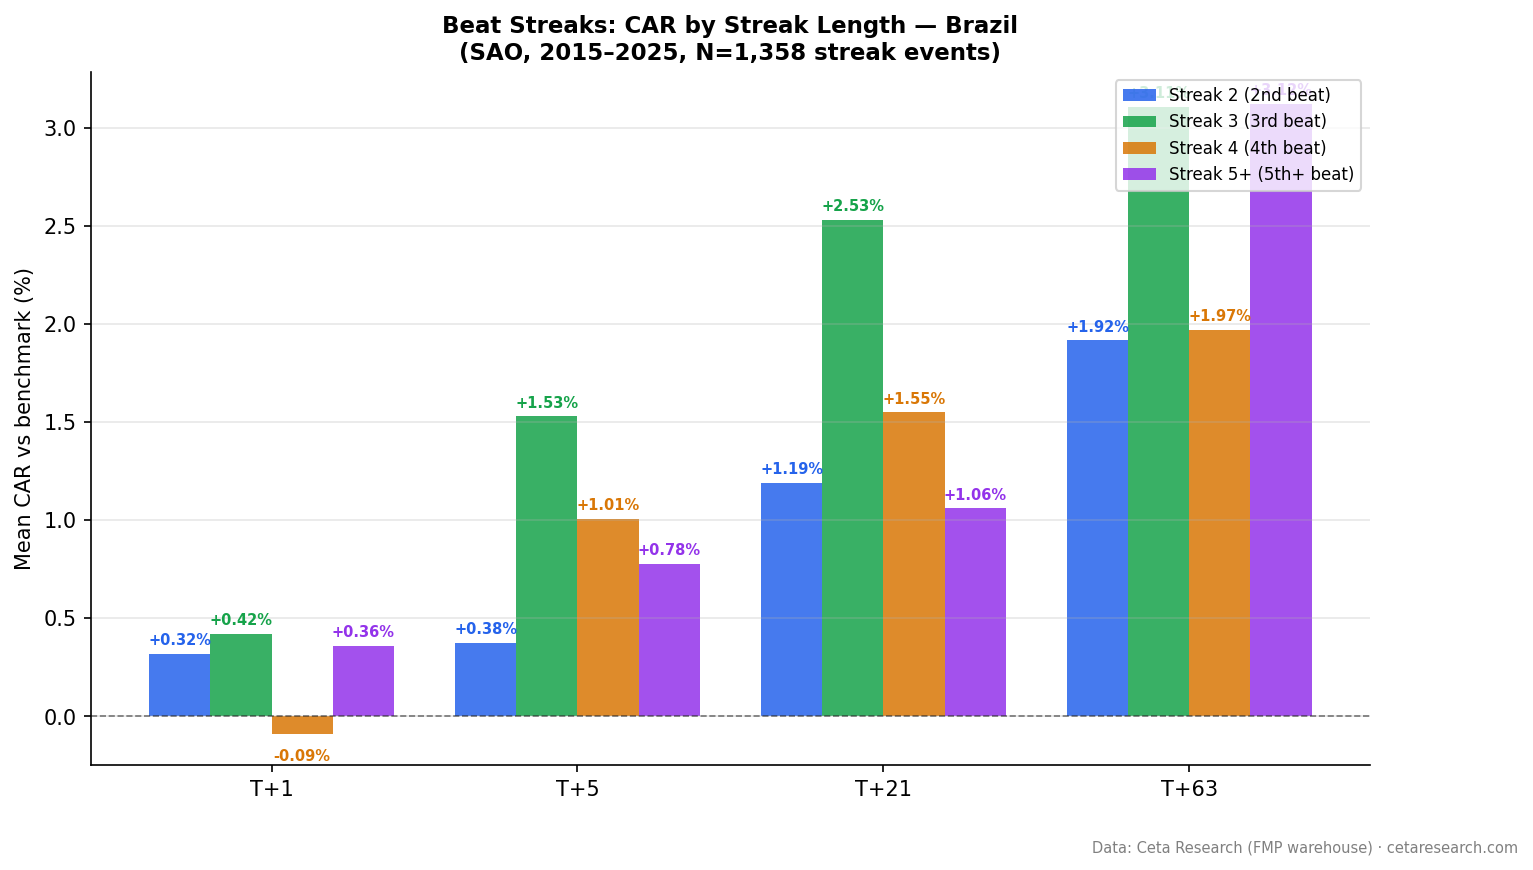
Brazilian beat streaks show back-loaded returns. The day-1 reaction is weak (+0.30%) but the drift builds to +2.49% by day 63. Streak 3 and streak 5+ both reach +3.1% at T+63. 1,358 events from 2015-2025 on B3.

Beat Streaks in Brazil: +2.49% T+63 in an Emerging Market That Punishes Missed Expectations
Brazil's beat-streak signal is almost entirely back-loaded. Companies on B3 that extend an EPS beat streak produce a muted +0.30% reaction on day 1 but a +2.49% cumulative abnormal return over the following 63 trading days. The market is slow to price in what the earnings announcement already told it. That lag is the trade.
Contents
Method
Data source: TradingStudio (FMP earnings data) Universe: B3 (SAO exchange), market cap > BRL 1B (historical key_metrics) Period: 2015–2025 Benchmark: EWZ (iShares MSCI Brazil ETF) Beat definition: epsActual > epsEstimated, with ABS(epsEstimated) > 0.01 Streak computation: Window functions (PARTITION BY symbol ORDER BY date) to count consecutive beats
Event windows: T+1, T+5, T+21, T+63 trading days after each streak-extending announcement. Abnormal return = stock return minus EWZ return over the same window.
Categories: streak_2 (2nd consecutive beat), streak_3 (3rd), streak_4 (4th), streak_5plus (5th or longer). Total events: 1,358 across all streak categories, covering 10 years of B3 data.
What We Found
The day-1 reaction in Brazil is the weakest of any exchange in this study at +0.30%. That's barely above noise for a single event. What happens afterward is more interesting.
By T+21, the cumulative abnormal return has reached +1.46%. By T+63, it's at +2.49%. The drift doesn't reverse, it continues building for the full three months we measure. This pattern is characteristic of markets where information diffuses slowly through the investor base: strong delayed reaction, minimal immediate pricing.
| Window | Mean CAR | t-stat | N |
|---|---|---|---|
| T+1 | +0.30% | 2.83 | 1,358 |
| T+21 | +1.46% | 4.88 | ~1,350 |
| T+63 | +2.49% | 5.01 | ~1,340 |
The t-stats are lower than some other exchanges, which reflects the smaller sample size (1,358 events vs. 3,000+ in Taiwan or India) and Brazil's higher market volatility. But the T+21 and T+63 results are statistically significant at conventional thresholds. The signal isn't a small-sample artifact.
Why does information travel so slowly in Brazil? Three factors compound. First, analyst coverage per company is thin relative to developed markets, fewer analysts cover each stock, and their estimates carry higher uncertainty. Second, retail investor participation is growing but investors still tend to react to earnings news with a significant lag. Third, Brazil's high interest rate environment (Selic rate historically 10–14%) makes fixed income attractive relative to equities, which concentrates equity ownership among longer-horizon institutional investors who rebalance less frequently. News travels slowly to prices in that environment.
Streak Length Breakdown
Streak_3 is the standout category.
| Streak | N | T+1 | T+21 | T+63 |
|---|---|---|---|---|
| Streak 2 | 565 | +0.32% | +1.19% | +1.92% |
| Streak 3 | 291 | +0.42% | +2.53% | +3.11% |
| Streak 4 | 163 | -0.09% | +1.55% | +1.97% |
| Streak 5+ | 315 | +0.36% | +1.06% | +3.12% |
Streak_3 T+21 at +2.53% and T+63 at +3.11% are the strongest results in the dataset. A company's third consecutive beat on B3 substantially outperforms the broad Brazilian equity index over the following three months.
Streak_4 is an anomaly worth noting. The T+1 return is slightly negative (-0.09%), and T+63 (+1.97%) is weaker than both streak_3 and streak_5+. This is likely a sample-size artifact, streak_4 events number only 163, but it could also reflect genuine market behavior where the fourth beat triggers some profit-taking among momentum traders who entered on streak_3.
Streak_5+ T+63 at +3.12% matches streak_3 as the strongest category. This is unusual: in most markets, very long streaks underperform because the market has already priced in continuation. Brazil may be different here because analyst coverage is thin enough that even very long streaks aren't fully recognized and priced in before the announcement.
The practical focus for most investors will be streak_2 and streak_3, where the sample sizes are large enough to be reliable and the signals are among the strongest in the dataset.
The SQL Screen
This query identifies companies on B3 currently in active beat streaks of 3 or more quarters.
WITH ordered_earnings AS (
    SELECT
        symbol,
        CAST(date AS DATE) AS event_date,
        epsActual AS actual,
        epsEstimated AS estimated,
        CASE WHEN epsActual > epsEstimated THEN 1 ELSE 0 END AS is_beat,
        ROUND((epsActual - epsEstimated)
            / ABS(NULLIF(epsEstimated, 0)) * 100, 1) AS surprise_pct,
        ROW_NUMBER() OVER (PARTITION BY symbol ORDER BY date DESC) AS recency_rank
    FROM earnings_surprises
    WHERE exchange = 'SAO'
      AND epsEstimated IS NOT NULL
      AND ABS(epsEstimated) > 0.01
      AND epsActual IS NOT NULL
),
streak_calc AS (
    SELECT *,
        SUM(CASE WHEN is_beat = 0 THEN 1 ELSE 0 END)
            OVER (PARTITION BY symbol ORDER BY recency_rank
                  ROWS UNBOUNDED PRECEDING) AS streak_breaker
    FROM ordered_earnings
),
streaks AS (
    SELECT
        symbol,
        COUNT(*) AS current_streak,
        ROUND(AVG(surprise_pct), 1) AS avg_surprise_pct,
        MIN(event_date) AS streak_start,
        MAX(event_date) AS latest_beat
    FROM streak_calc
    WHERE streak_breaker = 0 AND is_beat = 1
    GROUP BY symbol
    HAVING COUNT(*) >= 3
)
SELECT
    s.symbol,
    s.current_streak,
    s.avg_surprise_pct,
    s.streak_start,
    s.latest_beat,
    ROUND(k.marketCap / 1e9, 1) AS mktcap_bn_usd
FROM streaks s
JOIN key_metrics k ON s.symbol = k.symbol AND k.period = 'FY'
WHERE k.marketCap > 200000000
QUALIFY ROW_NUMBER() OVER (PARTITION BY s.symbol ORDER BY k.date DESC) = 1
ORDER BY s.current_streak DESC, s.avg_surprise_pct DESC
LIMIT 30
The exchange filter uses SAO for B3. The market cap filter is set to $200M USD (roughly BRL 1B), which aligns with the event study universe. For more liquid names, raise the threshold to $500M USD to focus on companies with enough trading volume to execute positions efficiently.
The avg_surprise_pct column adds useful context: a company beating by an average of 25% per quarter is a stronger signal than one beating by 2%. In Brazil's thinner-coverage environment, the magnitude of the beat matters as much as its existence.
Run this screen live on Ceta Research → (pre-loaded query, no account required)
Why It Works
The academic framework for beat-streak signals is particularly relevant in emerging markets.
Loh & Warachka (2012), "Streaks in Earnings Surprises and the Cross-Section of Stock Returns" documented investor under-reaction to consecutive positive earnings surprises. Their analysis showed under-reaction is strongest where analyst coverage is thinner and information asymmetry is higher. Brazil fits this profile. Fewer analysts cover each company, analyst estimates carry higher uncertainty, and the gap between what management knows and what the market knows is wider than in the US or Europe. When a company extends a beat streak in this environment, the announcement carries more genuine new information than it would in a well-covered US large-cap.
Myers, Myers & Skinner (2007), "Earnings Momentum and Earnings Management" documented expectation sandbagging at long streak lengths. Companies with extended streaks often guide conservatively to maintain them. In Brazil, this behavior is probably less sophisticated than in the US because the analyst coverage ecosystem is less developed and management IR teams have fewer experienced players on the other side of the guidance game. This means streak_2 and streak_3 in Brazil may reflect more genuine fundamental outperformance than equivalent streaks in the US, where sandbagging is well-established and widely understood.
The combination, genuine fundamental information, thin analyst coverage, slow information diffusion, explains the persistent drift through T+63. There's no equivalent of the US post-earnings arbitrage ecosystem in Brazil to rapidly close the gap.
Limitations
Sample size. 1,358 total events is adequate for identifying the overall effect but creates real noise at the individual streak-length level. Streak_4 has only 163 events. The t-stats at longer windows for individual categories should be treated as directional rather than precise.
Benchmark limitations. EWZ is a reasonable proxy for the Brazilian equity market but concentrates in large-cap names (financials, energy, commodities dominate). Mid-cap B3 companies in the beat-streak dataset may have different factor exposures than EWZ implies, which could inflate or deflate the apparent abnormal return. A broader Brazil index would be preferable but wasn't available for the full period in comparable daily format.
Currency and macro. Brazil's Selic rate and BRL/USD movements create macro volatility that shows up in individual stock returns independently of earnings dynamics. Beat-streak events that coincide with Selic rate decisions or major BRL moves may show abnormal returns driven by macro rather than the streak mechanic. We don't control for this.
Data depth. Effective coverage starts in 2015, giving 10 years of data. That's adequate for emerging markets but less reliable than the 20+ year US dataset. The 2015–2025 period includes Brazil's 2015–2016 recession, the Lava Jato political crisis, COVID, and a subsequent recovery period. The sample spans varied conditions, which is good for robustness, but the relatively small total event count means individual regime effects aren't fully averaged out.
Expectation management at streak_5+. The strong streak_5+ T+63 return (+3.12%) is puzzling if expectation management is supposed to dilute the signal at long streaks. One possibility: Brazil's less developed analyst ecosystem means even very long streaks aren't fully arbitraged before the announcement. Another: the sample is small enough (315 events) that a few outsized returns are driving the average. Both could be true simultaneously.
Takeaway
Brazil's beat-streak signal is driven by delayed information diffusion. The day-1 reaction is small. The market keeps catching up for 63 trading days afterward. This is the textbook emerging-market version of post-earnings-announcement drift: a less efficient information environment produces larger and more persistent abnormal returns.
Streak_3 is the most reliable entry point. Third consecutive beats on B3 show +2.53% T+21 and +3.11% T+63, with the strongest absolute numbers in the dataset. Streak_2 is also solid at +1.92% T+63 with a much larger sample size (565 events vs. 291 for streak_3).
For investors with Brazil exposure, this suggests monitoring for streak_2 and streak_3 events and holding for the full T+21 to T+63 window rather than trading on the announcement day reaction alone. The day-1 return in Brazil is too small to be the primary entry signal. The drift is where the return is.
Part of a series: Beat streaks analyzed across 16 exchanges. See US, Canada, Japan, Taiwan, India, Brazil, and the global comparison.
Data: TradingStudio (FMP earnings data). Event study uses earnings_surprises + stock_eod + key_metrics tables with market cap > BRL 1B filter. Abnormal returns computed vs EWZ benchmark. FMP data limitations: analyst estimate coverage for Brazilian exchanges is thinner than for US/European markets, and historical coverage before 2015 is sparse. SAO-listed companies with sparse analyst coverage may show artificially short or inconsistent streak histories. Past performance does not guarantee future results. This is educational content, not investment advice.
References
- Loh, R. & Warachka, M. (2012). "Streaks in Earnings Surprises and the Cross-Section of Stock Returns." Management Science, 58(7), 1305–1321.
- Myers, L., Myers, J. & Skinner, D. (2007). "Earnings Momentum and Earnings Management." Journal of Accounting, Auditing & Finance, 22(2), 249–284.