backtests
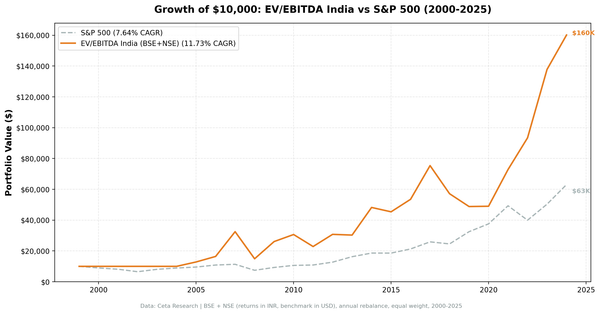
EV/EBITDA Below 10x on Indian Equities: 20-Year Backtest (BSE, NSE)
EV/EBITDA below 10x on Indian equities: 12.03% CAGR over 20 invested years vs 11.40% for the Sensex. A narrow edge with lower beta.

Building CetaResearch. Data analysis for policy, research, and startups.

backtests
EV/EBITDA below 10x on Indian equities: 12.03% CAGR over 20 invested years vs 11.40% for the Sensex. A narrow edge with lower beta.
backtests
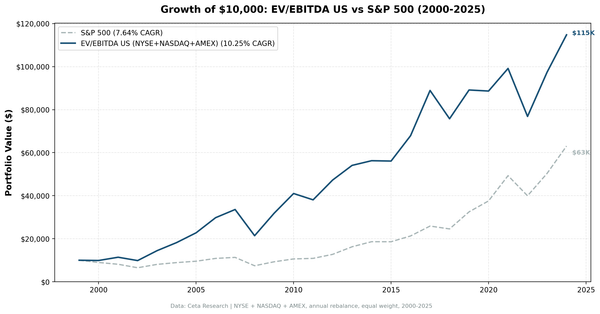
EV/EBITDA below 10x is how private equity prices acquisitions. We tested it as an equity screen on 22,000+ US stocks over 25 years.
backtests
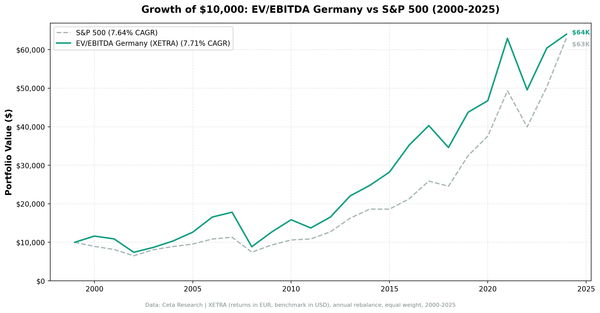
EV/EBITDA screening on XETRA: 7.40% CAGR vs 4.45% for the DAX. A 2.96% annual edge against the local index with a 68% win rate.
backtests
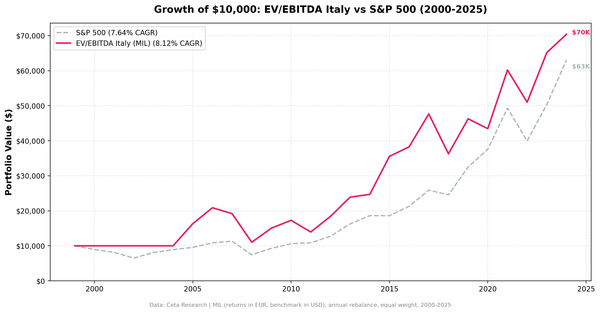
EV/EBITDA screen on Borsa Italiana returned 6.03% CAGR over 25 years, trailing SPY's 7.64%. Thin universe and six cash years. The strategy doesn't justify the complexity over a simple index fund.
backtests
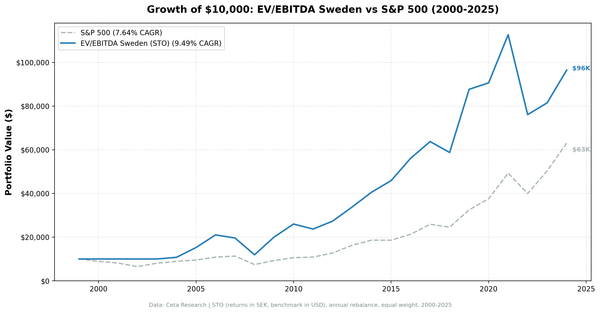
Sweden has one of the more interesting profiles for a simple value screen. The Stockholm exchange is heavy in industrials, engineering, and materials. These sectors tend to have lower EV/EBITDA multiples than tech-heavy markets, which means the screen has plenty to work with. Over 25 years, the strategy returned
global stocks
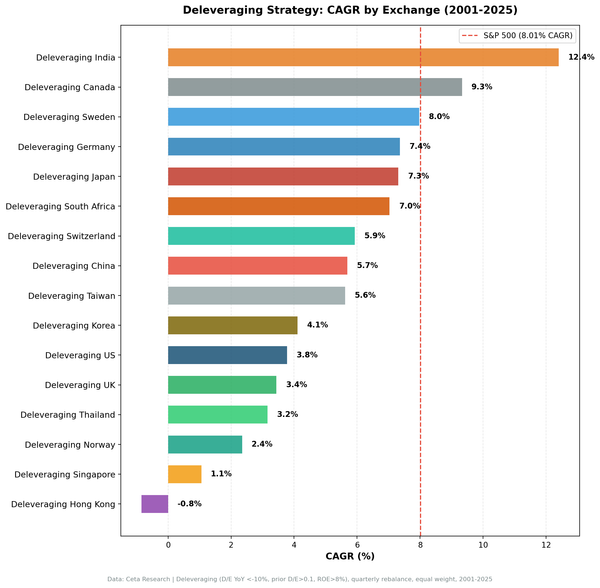
D/E reduction + ROE > 8% tested on 13 exchanges from 2001-2025. Only India (+4.39%) and Canada (+1.32%) beat SPY. US -4.23%, HK -8.85%. The signal is regime-dependent, not universal.
debt reduction
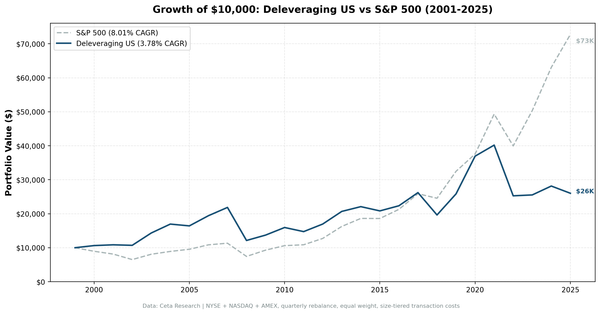
We backtested D/E reduction with ROE > 8% on US stocks from 2001-2025. 3.78% CAGR vs 8.01% for SPY. Pre-2013 it averaged +2.7% excess per year. Post-2013 it averaged -9.8%. The signal didn't fail — it became regime-dependent when ZIRP made leverage cheap.
india stocks
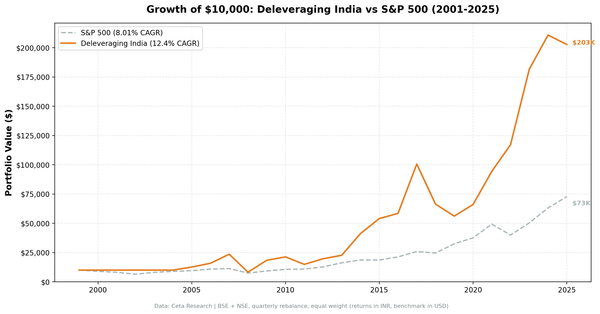
The same D/E reduction + ROE > 8% screen that fails in the US adds 4.39% annually in India. CAGR 12.40%, down capture 40.66%, total return 1,927%. The signal works here because balance sheet discipline is genuinely scarce in India's growth economy.
value-investing
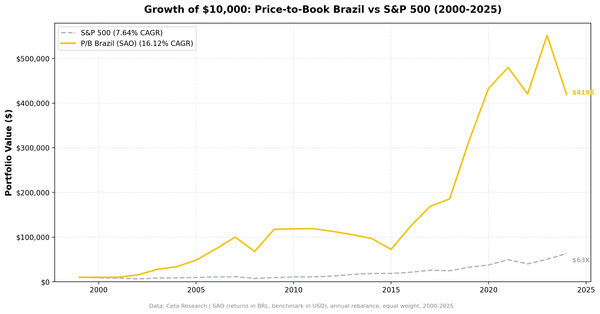
Brazil's B3 returned 16.12% CAGR on a low P/B screen over 25 years. 8.47% annual alpha over the S&P 500, the highest across all 18 exchanges tested. Down capture of just 7.5%. Returns in BRL; currency adjustment reduces but doesn't eliminate the alpha.
value-investing
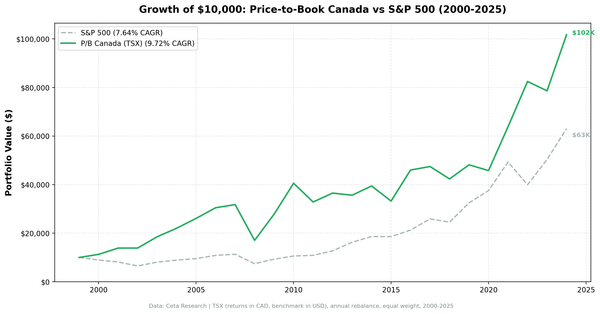
Canada's TSX delivered 9.72% CAGR on a low P/B screen from 2000 to 2025. That's 2.08% annual excess return over the S&P 500. The number that stands out more is down capture: 8.02%. When the S&P 500 fell
backtests
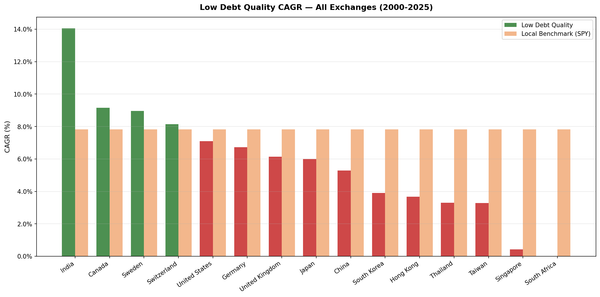
We ran a low-debt + Piotroski F-Score screen on 13 exchanges over 25 years. India leads at 14.05% CAGR with -2.02% down capture. Canada is the biggest surprise. Switzerland has the best Sharpe. Here''s the full global breakdown.
value investing
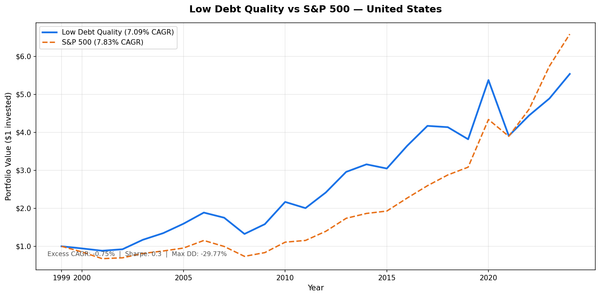
We screened NYSE, NASDAQ, and AMEX for D/E < 0.5 and Piotroski F-Score >= 7, then held the portfolio annually for 25 years. The result: 7.09% CAGR vs 7.83% for SPY, with max drawdown of -29.77% vs -36.27%. Lower return, but meaningfully better downside protection.