
52-Week Low Quality: 24-Year US Backtest (NYSE, NASDAQ, AMEX)

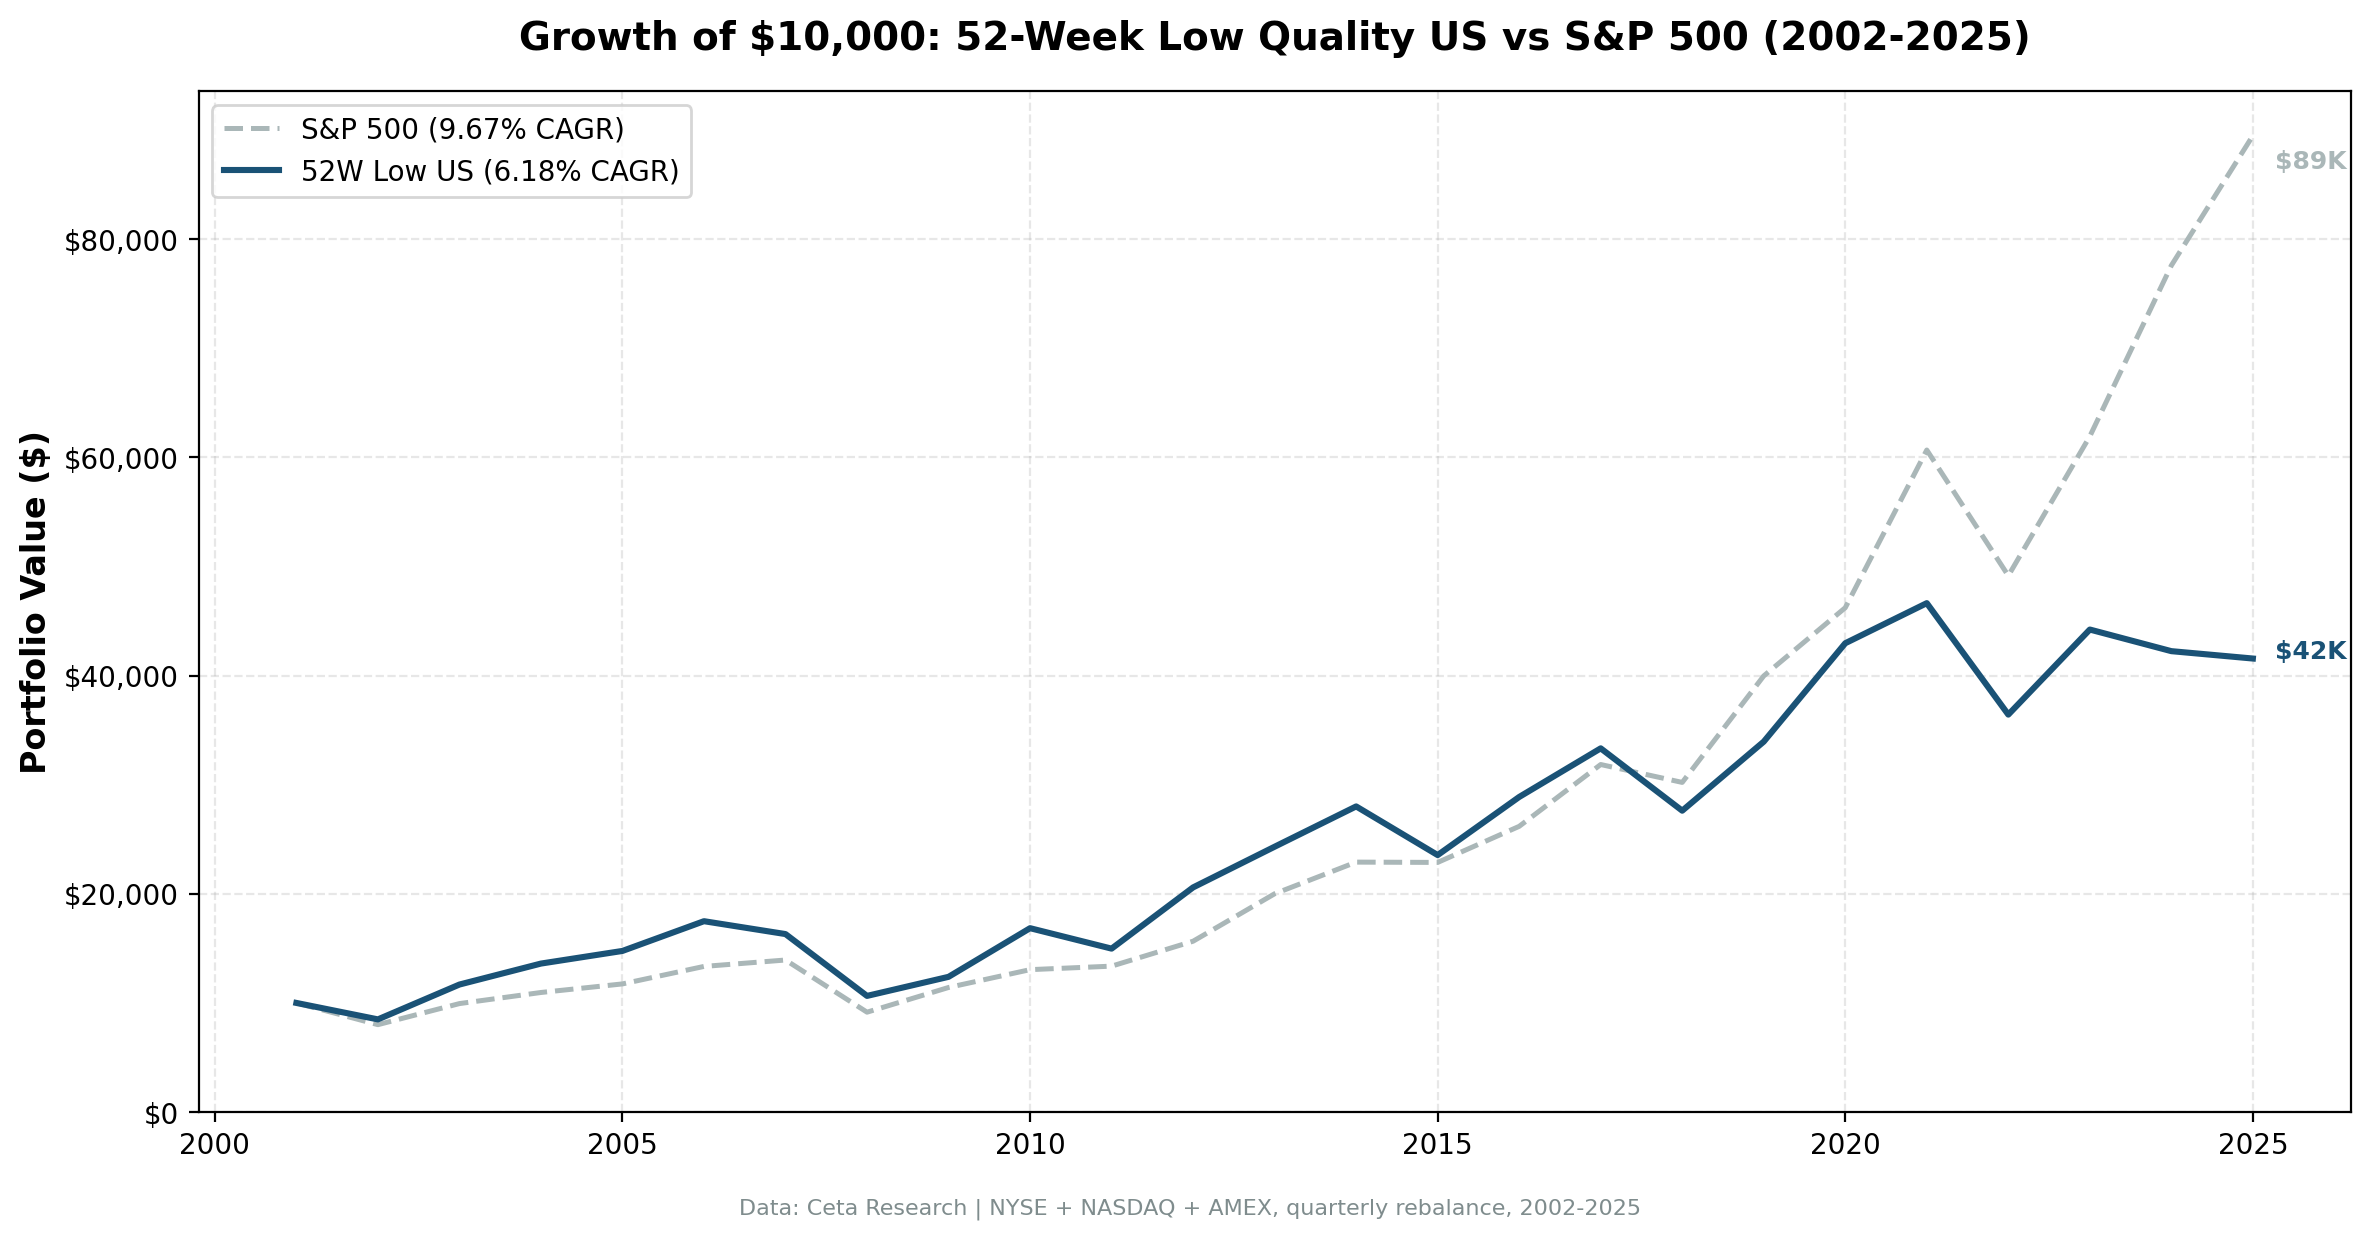
We combined two ideas that shouldn't need explaining separately: buy stocks near their lows, but only the ones with strong balance sheets. The 52-Week Low Quality strategy screens for US stocks within 15% of their 52-week low, then filters to those with a Piotroski F-score of 7 or higher. From 2002 to 2025, across 23.8 years and 95 quarterly rebalances, the strategy returned 6.18% annually vs 9.67% for the S&P 500.
Contents
- Method
- The Strategy
- What We Found
- Year-by-Year
- Where the Strategy Earns Its Returns
- Why It Struggles in the Modern US Market
- Run It Yourself
- Limitations
That's a clear underperformance. But the numbers tell a more specific story about when and why it fails, and when it doesn't.
Method
- Data source: Ceta Research (FMP financial data warehouse)
- Universe: NYSE, NASDAQ, AMEX, market cap > $500M
- Period: 2002–2025 (23.8 years, 95 quarterly periods)
- Rebalancing: Quarterly (January/April/July/October), equal weight, up to 30 stocks
- Minimum to deploy: 5 qualifying stocks
- Benchmark: S&P 500 Total Return (SPY)
- Cash rule: Hold cash if fewer than 5 stocks qualify
- Transaction costs: 0.1% per trade
- Filing lag: 45 days (prevents look-ahead bias)
Historical financial data with 45-day lag. Full methodology: backtests/METHODOLOGY.md
The Strategy
The logic is simple: stocks near 52-week lows are beaten down. Most beaten-down stocks deserve to be there. The Piotroski F-score identifies the ones that don't.
The F-score runs 9 binary tests across three categories. Each passes or fails, and the sum is the score.
| Category | Tests |
|---|---|
| Profitability | Positive net income, positive operating cash flow, improving ROA, cash flow > net income (accruals) |
| Leverage & Liquidity | Declining long-term debt ratio, improving current ratio, no dilution |
| Operating Efficiency | Improving asset turnover, improving gross margin |
A score of 7 or higher means the company is passing at least 7 of those 9 tests. Financially, it's improving across most dimensions. Paired with a near-52-week-low price, you're buying operational momentum at a beaten-down price.
| Filter | Threshold |
|---|---|
| Price vs 52-week low | Within 15% |
| Piotroski F-score | ≥ 7 |
| Market cap | > $500M |
| Price | ≥ $1.00 |
What We Found
| Metric | Portfolio | S&P 500 |
|---|---|---|
| CAGR | 6.18% | 9.67% |
| Total Return | 315.71% | 794.85% |
| Max Drawdown | -47.70% | -45.53% |
| Volatility (ann.) | 21.9% | — |
| Sharpe Ratio | 0.191 | 0.461 |
| Sortino Ratio | 0.301 | — |
| Calmar Ratio | 0.130 | — |
| Beta | 1.141 | 1.00 |
| Alpha | -4.56% | — |
| Up Capture | 94.45% | — |
| Down Capture | 114.4% | — |
| Win Rate (vs SPY) | 49.47% | — |
| Cash Periods | 0/95 | — |
| Avg Stocks | 28.5 | — |
$10,000 invested in January 2002 grew to $41,571 by end of 2025. The same amount in SPY: $89,485.
The down-capture of 114.4% is the central problem. When SPY falls, this portfolio falls harder. That's structurally embedded in the design: near-52-week-low stocks, almost by definition, are already under pressure. In a systemic sell-off, they have further to fall. The Piotroski filter helps, you're not holding the genuinely broken ones, but it doesn't prevent the broad repricing of beaten-down names.
The zero cash periods tell you something too. The US market always had at least 5 qualifying stocks in every quarter for 24 years. That's market depth, not signal strength.
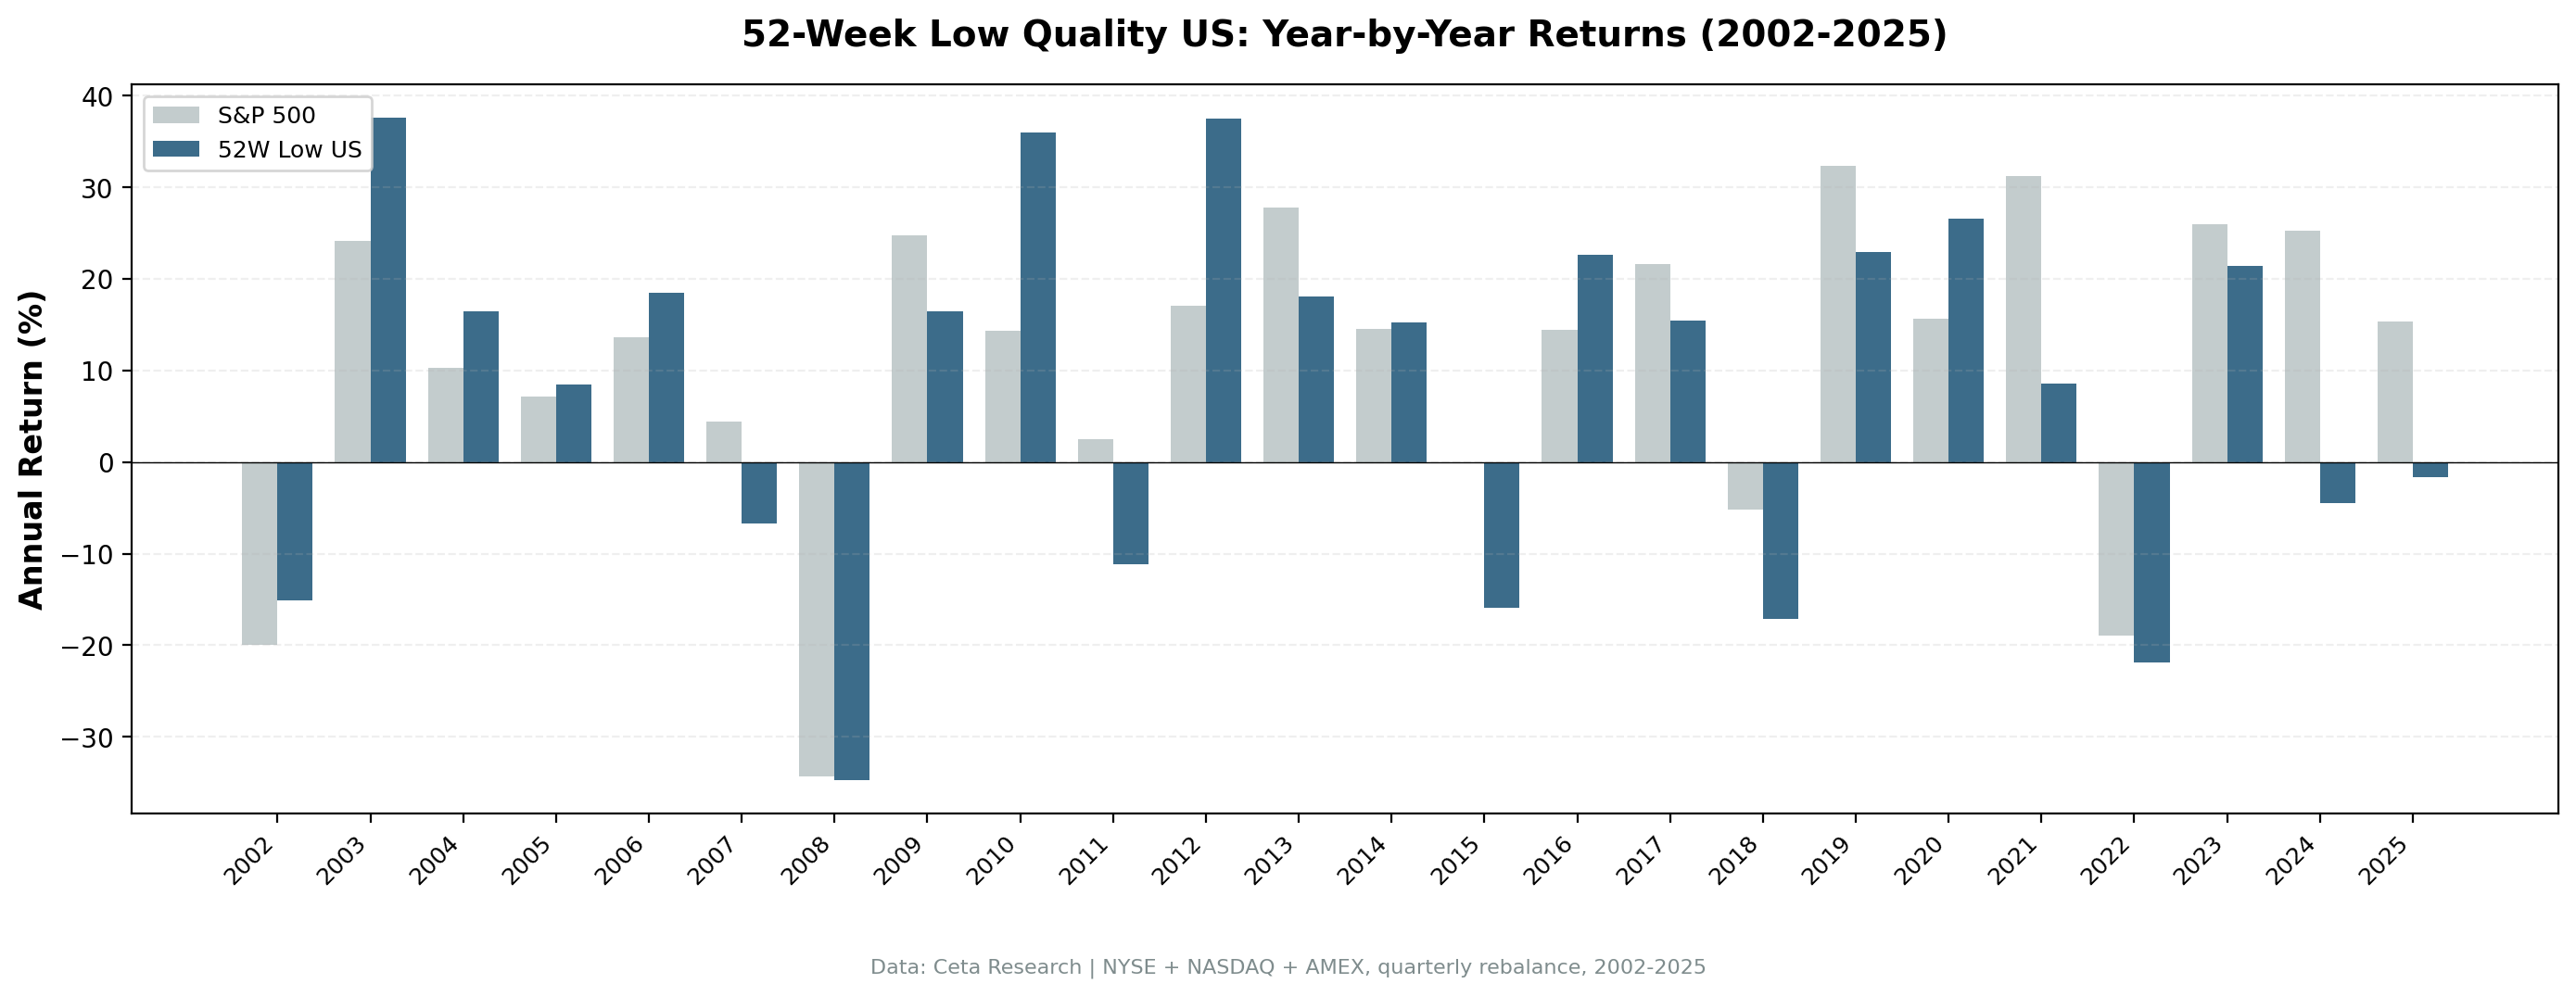
Year-by-Year
| Year | Portfolio | S&P 500 | Excess |
|---|---|---|---|
| 2002 | -15.08% | -19.92% | +4.84% |
| 2003 | +37.60% | +24.12% | +13.48% |
| 2004 | +16.45% | +10.24% | +6.21% |
| 2005 | — | +7.17% | — |
| 2006 | — | +13.70% | — |
| 2007 | — | +4.40% | — |
| 2008 | -34.74% | -34.31% | -0.43% |
| 2009 | +16.42% | +24.73% | -8.31% |
| 2010 | +35.98% | +14.31% | +21.67% |
| 2011 | — | +2.50% | — |
| 2012 | +37.46% | +17.09% | +20.37% |
| 2013 | +18.11% | +27.77% | -9.66% |
| 2014 | — | +14.50% | — |
| 2015 | — | -0.10% | — |
| 2016 | +22.61% | +14.45% | +8.16% |
| 2017 | — | +21.60% | — |
| 2018 | — | -5.20% | — |
| 2019 | — | +32.30% | — |
| 2020 | +26.57% | +15.64% | +10.93% |
| 2021 | +8.55% | +31.26% | -22.71% |
| 2022 | -21.90% | -18.99% | -2.91% |
| 2023 | — | +26.00% | — |
| 2024 | -4.48% | +25.28% | -29.76% |
| 2025 | -1.60% | +15.34% | -16.94% |
Where the Strategy Earns Its Returns
The pattern across 24 years is consistent: the strategy outperforms in market dislocations and underperforms in trending bull markets.
2002–2004: The dot-com bust and early recovery. Beaten-down quality stocks outperformed as the market repriced fundamentals after the speculative excess of the late 1990s. The strategy caught the early recovery cleanly.
2009–2012: The post-GFC period. 2008 was nearly a draw (-34.74% vs -34.31% for SPY, essentially identical). Then 2010 delivered +35.98% vs +14.31%, and 2012 delivered +37.46% vs +17.09%. Surviving beaten-down companies that maintained financial health bounced back hard when credit markets normalized.
2016 and 2020: Both outperformance years. Post-Brexit uncertainty in 2016 and pandemic-recovery in 2020 created dislocations where quality near lows was genuinely mispriced.
The underlying mechanism is mean reversion. Stocks near 52-week lows with improving fundamentals are pricing in continued deterioration that doesn't materialize. When the negative narrative fades, they re-rate.
Why It Struggles in the Modern US Market
The strategy has structurally underperformed since 2013, with the exception of 2016 and 2020.
Two reasons.
First, the US market has become increasingly dominated by a handful of high-multiple technology and growth companies. Microsoft, Nvidia, Meta, Apple. These stocks don't appear in 52-week-low screens. They've had expanding multiples for a decade. A portfolio that by design holds none of these will lag during any year that tech leadership drives the index, which describes most of 2013-2024.
Second, mean reversion in the US is aggressively arbitraged. When a quality stock hits a 52-week low, institutional quant desks see it the same day. The reversion is often priced quickly, reducing the edge to retail-accessible timing.
The 2024 result (-4.48% vs +25.28%) captures this starkly. The SPY return was concentrated in a handful of AI-beneficiary names. A screen that targets beaten-down small and mid-cap value had no overlap with that return stream.
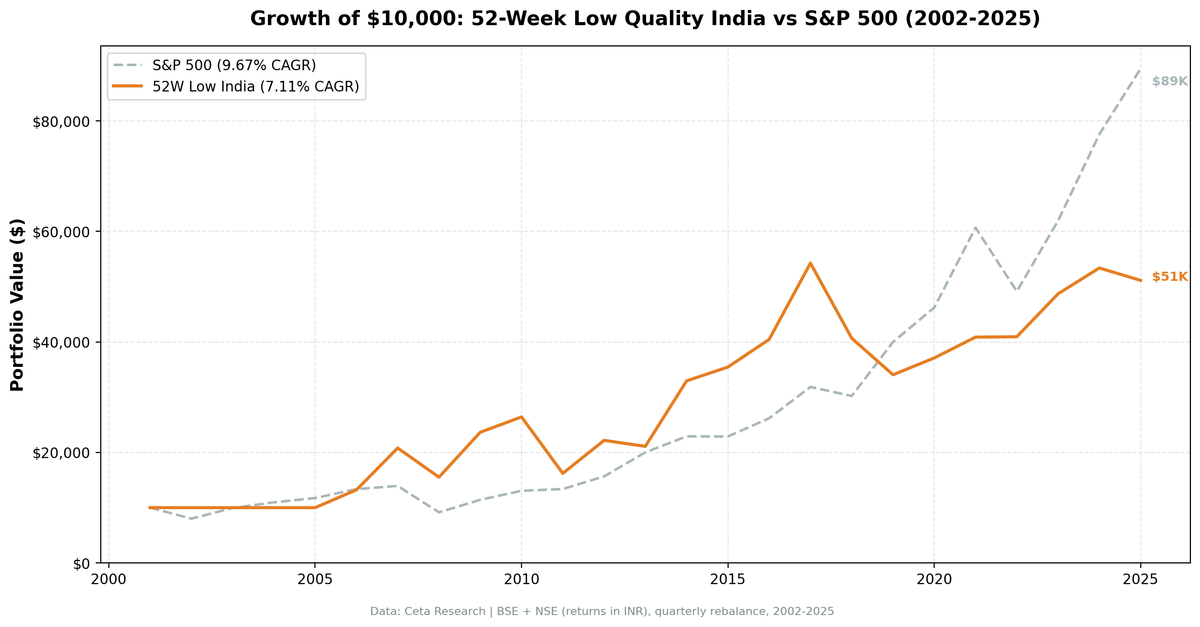
Part of a Series: Global | Switzerland | India | Hong Kong | Germany | China | Canada
Run It Yourself
The live screen below finds current US stocks that meet both criteria: within 15% of their 52-week low, Piotroski F-score ≥ 7.
WITH
inc AS (
 SELECT symbol, netIncome, grossProfit, revenue,
 ROW_NUMBER() OVER (PARTITION BY symbol ORDER BY dateEpoch DESC) AS rn
 FROM income_statement WHERE period = 'FY' AND netIncome IS NOT NULL
),
bal AS (
 SELECT symbol, totalAssets, totalCurrentAssets, totalCurrentLiabilities,
 longTermDebt, totalStockholdersEquity,
 ROW_NUMBER() OVER (PARTITION BY symbol ORDER BY dateEpoch DESC) AS rn
 FROM balance_sheet WHERE period = 'FY' AND totalAssets > 0
),
cf AS (
 SELECT symbol, operatingCashFlow,
 ROW_NUMBER() OVER (PARTITION BY symbol ORDER BY dateEpoch DESC) AS rn
 FROM cash_flow_statement WHERE period = 'FY' AND operatingCashFlow IS NOT NULL
),
piotroski AS (
 SELECT ic.symbol,
 CASE WHEN ic.netIncome > 0 THEN 1 ELSE 0 END
 + CASE WHEN cfc.operatingCashFlow > 0 THEN 1 ELSE 0 END
 + CASE WHEN (ic.netIncome/bc.totalAssets) > (ip.netIncome/bp.totalAssets) THEN 1 ELSE 0 END
 + CASE WHEN cfc.operatingCashFlow/bc.totalAssets > ic.netIncome/bc.totalAssets THEN 1 ELSE 0 END
 + CASE WHEN (COALESCE(bc.longTermDebt,0)/bc.totalAssets) < (COALESCE(bp.longTermDebt,0)/bp.totalAssets) THEN 1 ELSE 0 END
 + CASE WHEN (bc.totalCurrentAssets/bc.totalCurrentLiabilities) > (bp.totalCurrentAssets/bp.totalCurrentLiabilities) THEN 1 ELSE 0 END
 + CASE WHEN bc.totalStockholdersEquity >= bp.totalStockholdersEquity THEN 1 ELSE 0 END
 + CASE WHEN (ic.revenue/bc.totalAssets) > (ip.revenue/bp.totalAssets) THEN 1 ELSE 0 END
 + CASE WHEN (ic.grossProfit/ic.revenue) > (ip.grossProfit/ip.revenue) THEN 1 ELSE 0 END
 AS f_score
 FROM (SELECT * FROM inc WHERE rn=1) ic
 JOIN (SELECT * FROM inc WHERE rn=2) ip ON ic.symbol = ip.symbol
 JOIN (SELECT * FROM bal WHERE rn=1) bc ON ic.symbol = bc.symbol
 JOIN (SELECT * FROM bal WHERE rn=2) bp ON ic.symbol = bp.symbol
 JOIN (SELECT * FROM cf WHERE rn=1) cfc ON ic.symbol = cfc.symbol
),
prices_52w AS (
 SELECT symbol,
 LAST_VALUE(adjClose) OVER (PARTITION BY symbol ORDER BY dateEpoch ROWS BETWEEN UNBOUNDED PRECEDING AND UNBOUNDED FOLLOWING) AS current_price,
 MIN(adjClose) OVER (PARTITION BY symbol) AS low_52w
 FROM stock_eod
 WHERE date >= CURRENT_DATE - INTERVAL '365 days' AND adjClose > 0
)
SELECT pio.symbol, p.companyName, p.sector,
 pio.f_score,
 ROUND(ps.current_price, 2) AS current_price,
 ROUND(ps.low_52w, 2) AS low_52w,
 ROUND((ps.current_price - ps.low_52w)/ps.low_52w * 100, 1) AS pct_above_low,
 ROUND(k.marketCap/1e9, 2) AS mktcap_b
FROM piotroski pio
JOIN profile p ON pio.symbol = p.symbol
JOIN (SELECT symbol, MAX(current_price) AS current_price, MIN(low_52w) AS low_52w FROM prices_52w GROUP BY symbol) ps ON pio.symbol = ps.symbol
JOIN key_metrics_ttm k ON pio.symbol = k.symbol
WHERE p.exchange IN ('NYSE','NASDAQ','AMEX')
 AND k.marketCap > 500000000
 AND pio.f_score >= 7
 AND (ps.current_price - ps.low_52w)/ps.low_52w <= 0.15
 AND ps.current_price >= 1.0
ORDER BY (ps.current_price - ps.low_52w)/ps.low_52w ASC
LIMIT 30
To reproduce the full backtest:
git clone https://github.com/ceta-research/backtests.git
cd backtests

# US backtest
python3 52-week-low/backtest.py --preset us --output results.json --verbose

# Current screen
python3 52-week-low/screen.py --preset us
Limitations
Down-capture is the core problem. At 114.4%, this portfolio amplifies market declines. That's not a bad quarter or bad parameterization, it's structural. Stocks near their 52-week lows by definition carry elevated downside risk. Even with the Piotroski filter removing the most distressed names, the universe still skews toward companies facing genuine headwinds.
Beta of 1.141. You're taking on more market risk than the index, with less return to show for it. Negative alpha of -4.56% means after adjusting for that beta exposure, the strategy is generating negative excess return.
No overlap with mega-cap tech. This isn't a bug, but it's a reality. A screen that targets near-52-week-low stocks will never hold companies in sustained uptrends. As US market returns become more concentrated in a few large positions, that's an increasing structural headwind.
Quarterly rebalancing with 45-day lag. A stock that qualifies in January but deteriorates by March stays in the portfolio until April. The Piotroski F-score uses annual filings, you can be holding a company whose most recent annual data looked good but whose current trajectory has shifted.
Survivorship bias is partially mitigated. The backtest uses point-in-time data with 45-day filing lag, but delisting effects can still create slight upward bias.
Run It Yourself
Explore the data behind this analysis on Ceta Research. Query our financial data warehouse with SQL, build custom screens, and run your own backtests across 70,000+ stocks on 20 exchanges.
Data: Ceta Research (FMP financial data warehouse), 2002–2025. Universe: NYSE + NASDAQ + AMEX. Full methodology: METHODOLOGY.md. Backtest code: backtests/52-week-low/. Past performance doesn't guarantee future results.


