
52-Week Low Quality: 24-Year China Backtest (Shanghai, Shenzhen)

52-Week Low Quality on Chinese Equities: 24-Year Backtest (Shanghai, Shenzhen)
China's equity markets are retail-dominated, sentiment-driven, and structurally disconnected from the fundamentals of individual companies. That makes them a strange testing ground for a quality-filtered 52-week low screen. The result is strange too.
Contents
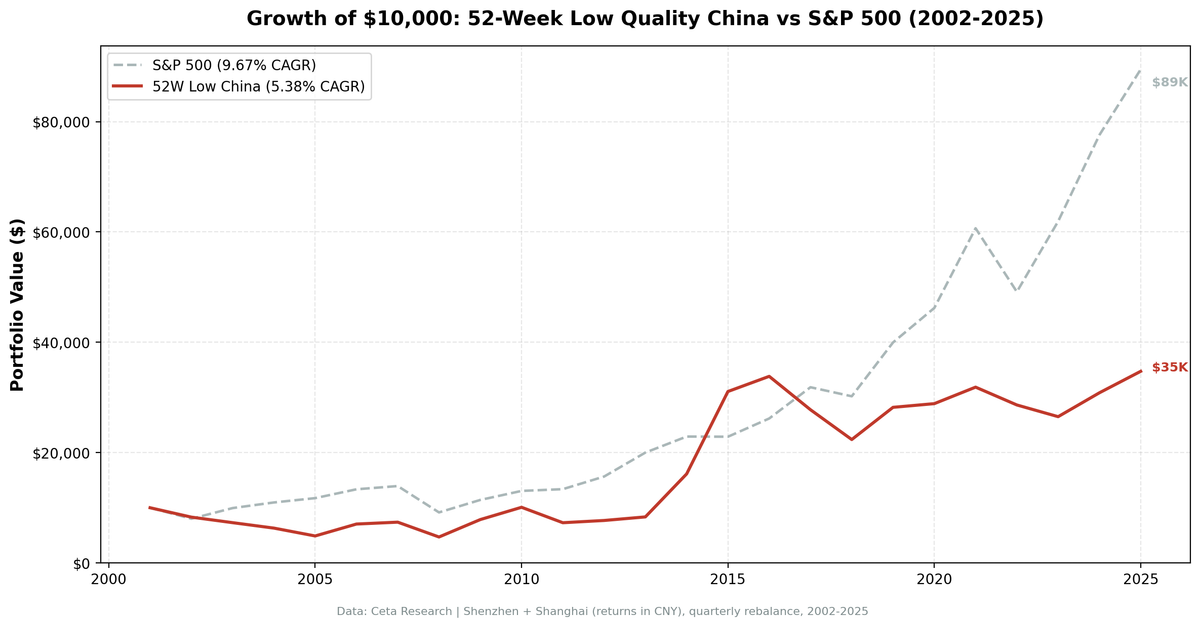
CAGR of 5.38%. Down-capture of 20.46%. Alpha of +0.77%. The strategy absorbed only 20% of SPY's downside moves, technically generated positive alpha, and still returned less than $35k on a $10k investment while SPY returned nearly $90k. Here's how that happened.
Method
- Data source: Ceta Research (FMP financial data warehouse)
- Universe: Shanghai (SHH) + Shenzhen (SHZ), market cap > ¥500M
- Period: 2002–2025 (95 quarters)
- Rebalancing: Quarterly (January, April, July, October), equal weight
- Max stocks: 30, minimum 5 to deploy capital
- Benchmark: S&P 500 Total Return (SPY)
- Cash rule: Hold cash if fewer than 5 stocks qualify
- Transaction costs: 0.1% per trade (one-way)
- Filing lag: 45-day lag on all fundamental data
Full methodology: backtests/METHODOLOGY.md
What We Found
| Metric | Portfolio | S&P 500 (SPY) |
|---|---|---|
| CAGR | 5.38% | 9.67% |
| Total Return | 247.26% | 789.45% |
| Max Drawdown | -54.92% | -45.53% |
| Volatility (ann.) | 29.77% | 16.63% |
| Sharpe Ratio | 0.097 | 0.431 |
| Sortino Ratio | 0.184 | — |
| Calmar Ratio | 0.098 | — |
| Beta | 0.294 | 1.00 |
| Alpha | +0.77% | — |
| Up Capture | 56.99% | — |
| Down Capture | 20.46% | — |
| Win Rate (vs SPY) | 38.95% | — |
| Cash Periods | 8/95 | — |
| Avg Stocks (when invested) | 26.5 | — |
The down-capture of 20.46% stands out. In years when SPY fell, this portfolio fell only 20% as much. That's the lowest down-capture in the entire 52-week low study across all markets tested. The alpha of +0.77% is technically positive, the only market in this series with positive alpha.
But those numbers exist alongside a max drawdown of -54.92%, annualized volatility of 29.77%, and a win rate vs SPY of only 38.95%. The portfolio beats SPY in fewer than 4 out of 10 quarters. The beta of 0.294 means this portfolio moves largely independently of US equity markets, which is why down-capture looks so low, the correlation itself is weak.
The terminal wealth result: $10k grew to $34,726 vs $89,485 in SPY. The wealth gap is the largest of any market in this series.

$10k invested in January 2002. China portfolio (blue) reaches $34,726 vs SPY (grey) $89,485 by December 2025.
Year-by-Year
| Year | Portfolio | S&P 500 | Excess |
|---|---|---|---|
| 2002 | -17.43% | -19.92% | +2.49% |
| 2003 | -12.18% | +24.12% | -36.30% |
| 2004 | -13.26% | +10.25% | -23.51% |
| 2005 | -22.58% | +7.21% | -29.79% |
| 2006 | +44.26% | +13.65% | +30.61% |
| 2007 | +38.74% | +4.40% | +34.34% |
| 2008 | -19.83% | -34.31% | +14.48% |
| 2009 | +67.23% | +24.73% | +42.50% |
| 2010 | +12.47% | +14.31% | -1.84% |
| 2011 | -27.74% | +2.46% | -30.20% |
| 2012 | +10.34% | +17.09% | -6.75% |
| 2013 | +14.62% | +27.77% | -13.15% |
| 2014 | +18.83% | +14.50% | +4.33% |
| 2015 | 0% (cash) | -0.07% | — |
| 2016 | -3.47% | +14.45% | -17.92% |
| 2017 | +22.51% | +21.64% | +0.87% |
| 2018 | -11.62% | -5.23% | -6.39% |
| 2019 | +16.77% | +32.31% | -15.54% |
| 2020 | +33.48% | +15.64% | +17.84% |
| 2021 | +8.34% | +31.33% | -22.99% |
| 2022 | +4.36% | -18.99% | +23.35% |
| 2023 | +9.87% | +26.00% | -16.13% |
| 2024 | -1.56% | +25.28% | -26.84% |
The first four years of the backtest (2002–2005) were universally negative. Chinese equities were in a prolonged bear market. The quality filter prevented the worst losses, the portfolio fell less than the broader market, but couldn't generate positive returns in a market where almost nothing worked. A Piotroski score of 7 or higher identifies financial strength, not immunity to bear markets.
The 2006–2007 surge (+44.26%, +38.74%) shows what happens when China's growth economy rerated. The whole market moved, and quality companies near 52-week lows participated fully. The 2009 recovery of +67.23% is the same dynamic after the financial crisis.
The two most striking results are 2022 and 2008. In 2022, SPY fell -18.99% while this portfolio returned +4.36%. In 2008, SPY fell -34.31% while this portfolio fell only -19.83%. These aren't coincidences. Chinese equities and US equities have low correlation. When the US equity market sells off, Chinese stocks at 52-week lows with quality financials don't need to follow.
2024 was painful: -1.56% vs SPY +25.28%. China's equity market underperformed as economic headwinds and property sector debt problems weighed on sentiment. The strategy held quality companies, but the macro backdrop overwhelmed the fundamentals.
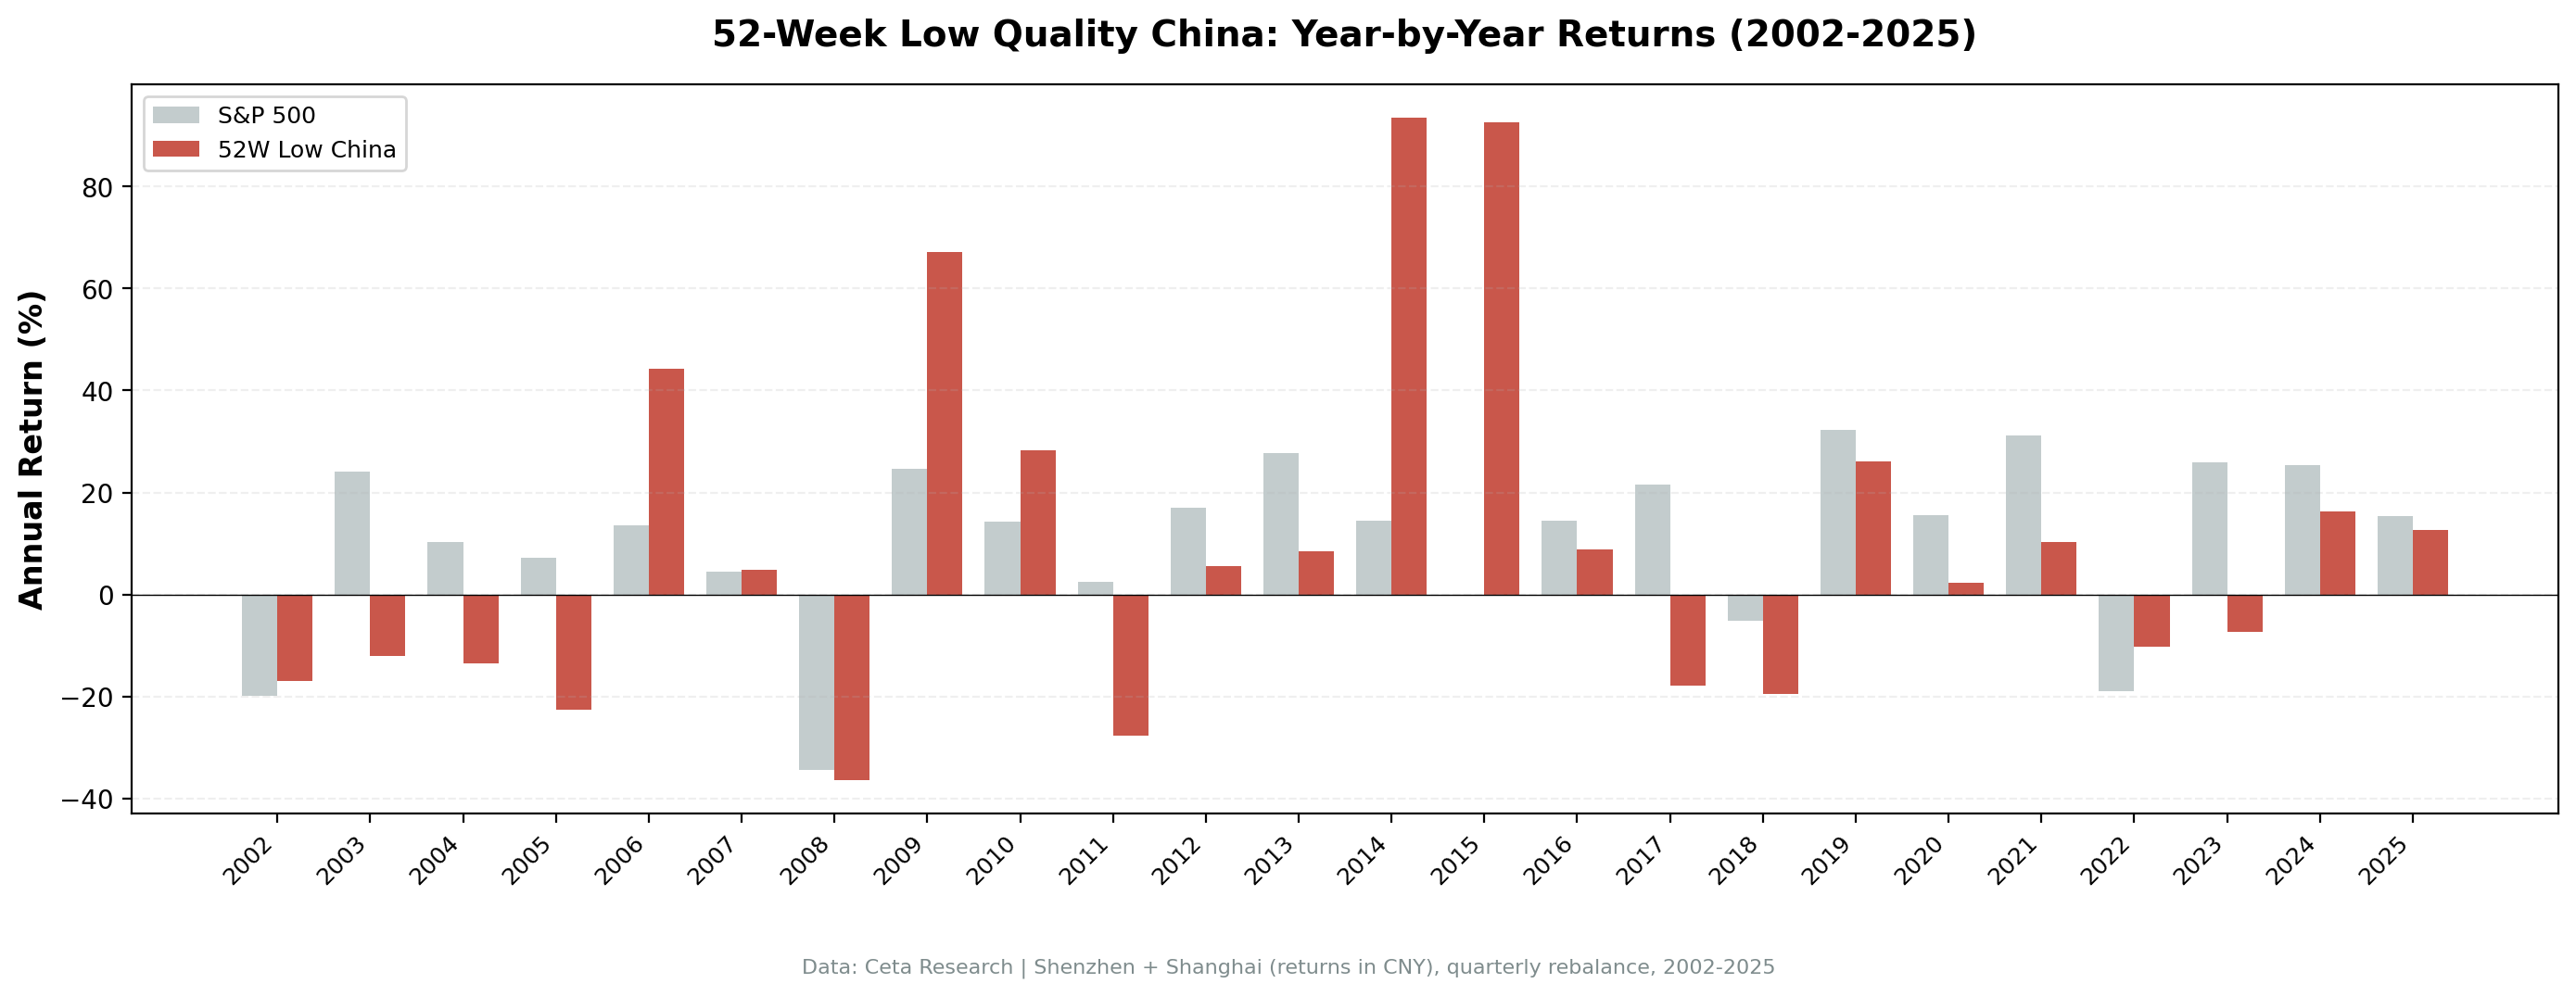
Year-by-year comparison. High volatility in both directions. The 2002–2005 bear market, the 2006–2007 and 2009 surges, and the 2022 divergence are the defining periods.
China's Structural Anomalies
China's equity markets have characteristics that interact with this strategy in specific ways.
Retail dominance. Roughly 80% of daily trading volume on Shanghai and Shenzhen exchanges comes from retail investors. Institutional penetration is low compared to developed markets. Retail investors react to news events, government policy announcements, and sentiment cycles rather than fundamental analysis. A quality filter is therefore selecting companies that fundamentals say are good, but the market is pricing based on sentiment.
That dynamic creates the pattern visible in the data: large swings unconnected to fundamentals, but with quality companies recovering after panics. The 2009 return of +67.23% and 2020 return of +33.48% are both post-panic recovery events where quality prevailed.
Low correlation with US markets. The beta of 0.294 reflects genuine structural independence. China's economic cycle, currency policy, and regulatory environment operate on a different clock from US equity markets. This independence explains the low down-capture (20.46%) and also explains why the strategy doesn't participate when US markets run.
State intervention. Chinese regulators can and do intervene in equity markets. Trading halts, IPO suspensions, and direct government purchases create non-fundamental price dynamics. The 2015 circuit-breaker crisis (which produced a cash period in this backtest) is an example. The quality filter doesn't protect against regulatory events.
The quality filter in a state-dominated economy. Companies in state-controlled sectors can score well on Piotroski metrics due to implicit government support for their financials. Some of the "quality" identified by the F-score in China reflects government backstopping rather than genuine business strength. This means the filter may be noisier in China than in market economies.
The alpha of +0.77% is real in the mathematical sense: after adjusting for beta, the strategy generated marginally positive excess return vs SPY. But with a Sharpe of 0.097 and volatility of 29.77%, the risk-adjusted picture is poor. The positive alpha just means the strategy's independent movement vs SPY happened to lean slightly positive over 24 years.
Part of a Series: Global | US | Switzerland | India | Hong Kong | Germany | Canada
Run It Yourself
-- 52-Week Low Quality Screen: Shanghai + Shenzhen (China)
-- Stocks within 15% of 52-week low with Piotroski F-Score >= 7
-- Point-in-time with 45-day filing lag
WITH price_history AS (
 SELECT
 e.symbol,
 e.date,
 e.adjClose,
 MIN(e.adjClose) OVER (
 PARTITION BY e.symbol
 ORDER BY e.date
 ROWS BETWEEN 251 PRECEDING AND CURRENT ROW
 ) AS low_52wk
 FROM read_parquet('/opt/insydia/data/data_source=fmp/tick_data/eod/*.parquet') e
 JOIN read_parquet('/opt/insydia/data/data_source=fmp/company/profile/*.parquet') p
 ON e.symbol = p.symbol
 WHERE p.exchange IN ('SHZ', 'SHH')
 AND e.date <= CURRENT_DATE
 AND e.date >= CURRENT_DATE - INTERVAL '400' DAY
),
latest_price AS (
 SELECT symbol, adjClose AS current_price, low_52wk,
 ROW_NUMBER() OVER (PARTITION BY symbol ORDER BY date DESC) AS rn
 FROM price_history
 WHERE date <= CURRENT_DATE
),
near_low AS (
 SELECT symbol, current_price, low_52wk,
 (current_price / low_52wk - 1) AS pct_above_low
 FROM latest_price
 WHERE rn = 1 AND low_52wk > 0
 AND (current_price / low_52wk - 1) < 0.15
),
piotroski AS (
 SELECT
 i.symbol,
 i.date,
 CASE WHEN i.netIncome > 0 THEN 1 ELSE 0 END AS f1_net_income,
 CASE WHEN c.operatingCashFlow > 0 THEN 1 ELSE 0 END AS f2_ocf,
 CASE WHEN (i.netIncome / NULLIF(b.totalAssets, 0)) >
 LAG(i.netIncome / NULLIF(b.totalAssets, 0)) OVER (PARTITION BY i.symbol ORDER BY i.date)
 THEN 1 ELSE 0 END AS f3_roa_improving,
 CASE WHEN c.operatingCashFlow > i.netIncome THEN 1 ELSE 0 END AS f4_accruals,
 CASE WHEN (b.longTermDebt / NULLIF(b.totalAssets, 0)) <
 LAG(b.longTermDebt / NULLIF(b.totalAssets, 0)) OVER (PARTITION BY b.symbol ORDER BY b.date)
 THEN 1 ELSE 0 END AS f5_leverage,
 CASE WHEN (b.totalCurrentAssets / NULLIF(b.totalCurrentLiabilities, 0)) >
 LAG(b.totalCurrentAssets / NULLIF(b.totalCurrentLiabilities, 0)) OVER (PARTITION BY b.symbol ORDER BY b.date)
 THEN 1 ELSE 0 END AS f6_liquidity,
 CASE WHEN i.weightedAverageShsOut <=
 LAG(i.weightedAverageShsOut) OVER (PARTITION BY i.symbol ORDER BY i.date)
 THEN 1 ELSE 0 END AS f7_no_dilution,
 CASE WHEN (i.grossProfit / NULLIF(i.revenue, 0)) >
 LAG(i.grossProfit / NULLIF(i.revenue, 0)) OVER (PARTITION BY i.symbol ORDER BY i.date)
 THEN 1 ELSE 0 END AS f8_gross_margin,
 CASE WHEN (i.revenue / NULLIF(b.totalAssets, 0)) >
 LAG(i.revenue / NULLIF(b.totalAssets, 0)) OVER (PARTITION BY i.symbol ORDER BY i.date)
 THEN 1 ELSE 0 END AS f9_asset_turnover
 FROM read_parquet('/opt/insydia/data/data_source=fmp/statements/income_statement/*.parquet') i
 JOIN read_parquet('/opt/insydia/data/data_source=fmp/statements/balance_sheet_statement/*.parquet') b
 ON i.symbol = b.symbol AND i.date = b.date AND i.period = b.period
 JOIN read_parquet('/opt/insydia/data/data_source=fmp/statements/cash_flow_statement/*.parquet') c
 ON i.symbol = c.symbol AND i.date = c.date AND i.period = c.period
 WHERE i.period = 'FY'
 AND CAST(i.date AS DATE) <= CURRENT_DATE - INTERVAL '45' DAY
),
piotroski_scored AS (
 SELECT symbol,
 (f1_net_income + f2_ocf + f3_roa_improving + f4_accruals +
 f5_leverage + f6_liquidity + f7_no_dilution + f8_gross_margin + f9_asset_turnover) AS fscore,
 ROW_NUMBER() OVER (PARTITION BY symbol ORDER BY date DESC) AS rn
 FROM piotroski
),
quality AS (
 SELECT k.symbol, k.marketCap,
 ROW_NUMBER() OVER (PARTITION BY k.symbol ORDER BY k.date DESC) AS rn
 FROM read_parquet('/opt/insydia/data/data_source=fmp/statements/key_metrics/*.parquet') k
 WHERE CAST(k.date AS DATE) <= CURRENT_DATE - INTERVAL '45' DAY
 AND k.period = 'FY'
)
SELECT
 n.symbol,
 ROUND(n.current_price, 2) AS current_price,
 ROUND(n.low_52wk, 2) AS low_52wk,
 ROUND(n.pct_above_low * 100, 2) AS pct_above_low,
 ps.fscore AS piotroski_score,
 ROUND(q.marketCap / 1e6, 0) AS mktcap_mm_cny
FROM near_low n
JOIN piotroski_scored ps ON n.symbol = ps.symbol AND ps.rn = 1
JOIN quality q ON n.symbol = q.symbol AND q.rn = 1
WHERE ps.fscore >= 7
 AND q.marketCap > 500000000
ORDER BY n.pct_above_low ASC
LIMIT 30
Run this screen on Ceta Research →
Limitations
Retail market dynamics. Chinese equity markets trade on sentiment cycles that have little to do with company fundamentals. A quality filter identifies financially strong companies, but those companies still get caught in broad market selloffs driven by retail panic or government policy changes.
State sector noise in quality metrics. Some Chinese companies score well on Piotroski metrics because they benefit from implicit government support. The financial strength identified by the F-score may reflect state backing rather than genuine business quality. This makes the filter noisier in China than in market economies.
Volatility of 29.77%. Nearly double SPY's 16.63%. A portfolio with this volatility requires strong conviction. A 54.92% max drawdown at some point in the 24-year history is a real investor test.
Currency. Returns are in CNY. CNY has appreciated vs USD over this period, which partially helps the comparison vs SPY (USD-denominated). Stripping out currency appreciation would reduce the apparent CAGR for international investors.
Win rate of 38.95%. The strategy beats SPY in fewer than 4 out of 10 quarters. It wins when it wins large (2006, 2007, 2009, 2020, 2022), but those events are infrequent. Investors need tolerance for extended stretches of underperformance.
Regulatory risk. Chinese market interventions, trading halts, and sudden regulatory changes are a real and unquantifiable risk. The 2015 circuit-breaker episode is a mild example. More severe interventions are possible and can't be backtested.
Run It Yourself
Explore the data behind this analysis on Ceta Research. Query our financial data warehouse with SQL, build custom screens, and run your own backtests across 70,000+ stocks on 20 exchanges.
Data: Ceta Research (FMP financial data warehouse), 2002–2025. Full methodology: backtests/METHODOLOGY.md. Backtest code: backtests/52-week-low/. Past performance doesn't guarantee future results. Educational content only, not investment advice.


