
Thailand's 52-Week High Proximity: Anchoring Works in Emerging Markets Too
We tested the 52-week high proximity strategy on Thai stocks (SET) from 2000 to 2025. 10.47% CAGR, +6.71% vs SET Index, 49.3% down capture. In 2022, the strategy returned +5.6% while the SET rose just 0.5%.

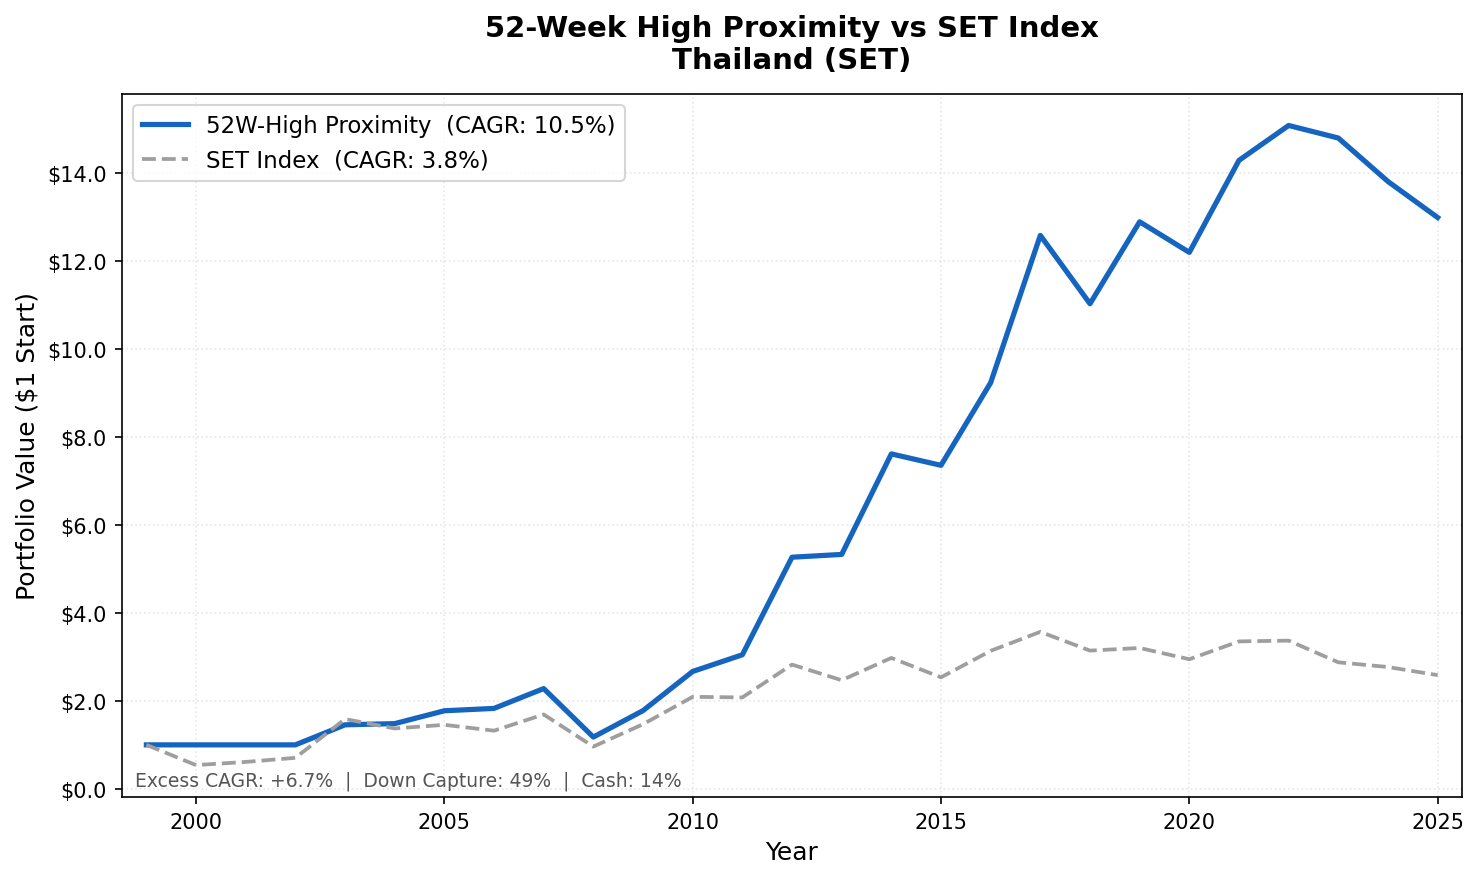
We ran the 52-week high proximity strategy on Thai stocks (SET) from 2000 to 2025. The result: 10.47% annualized, +6.71% above the SET Index, 49.3% down capture. A ฿1 investment grew to ฿12.98. The SET Index grew to ฿2.58 over the same period. Thailand is a surprising result: a frontier-adjacent emerging market where a simple proximity signal delivered strong outperformance over 25 years.
Contents
- Method
- What is the 52-Week High Proximity Strategy?
- What We Found
- 10.47% CAGR. +6.71% vs SET. 49.3% down capture.
- Year-by-Year Returns
- 2000–2002: three years of cash
- 2003: the first year the signal fired, +45.5%
- 2009-2012: the standout stretch
- 2011: strong when SET was flat
- 2022: a clear protection year
- 2023-2025: three consecutive negative years, mostly outperforming the index
- Why Anchoring Works in Thailand
- Limitations
- Run This Screen Yourself
- Part of a Series
- References
The 2022 year tells part of the story. Global equity markets took heavy losses, the SET Index rose just 0.5%. The Thailand 52-week high strategy returned +5.6% (+5.0% excess). The signal rotated toward domestic-oriented Thai companies that were holding relative strength while global rate sensitivity pressured most markets.
Data: FMP financial data warehouse, 2000-2025. Updated June 2026.
Method
Data source: Ceta Research (FMP financial data warehouse) Universe: SET (Stock Exchange of Thailand), exchange-specific market cap threshold Period: 2000–2025 (25 years, 103 quarterly periods) Rebalancing: Quarterly (January, April, July, October), equal weight Execution: Next-day close (MOC) Benchmark: SET Index (THB, local currency comparison) Returns: Calculated in THB; benchmark in THB Cash rule: Hold cash if fewer than 10 stocks qualify
The signal is the proximity ratio: current price divided by the 52-week high (rolling 252 trading days). Stocks are ranked by proximity ratio and the top 30 are held each quarter.
Note on benchmarking: Returns are in THB, same currency as the portfolio. Comparing to the SET Index enables an honest same-currency benchmark. Cross-currency comparison to SPY would include currency effects.
What is the 52-Week High Proximity Strategy?
George and Hwang (2004) showed that stocks trading near their 52-week high outperform stocks far from it, in a paper published in the Journal of Finance. The mechanism is anchoring bias. When investors treat the 52-week high as a ceiling, their preemptive selling creates a predictable discount. The signal captures stocks in that discount period, just before fundamental catalysts push prices through the anchor level.
Proximity ratio = adjClose / MAX(high over 252 trading days)
A ratio close to 1.0 means the stock is near its annual peak. We select the top 30 by this ratio and hold equal weight for one quarter.
What We Found
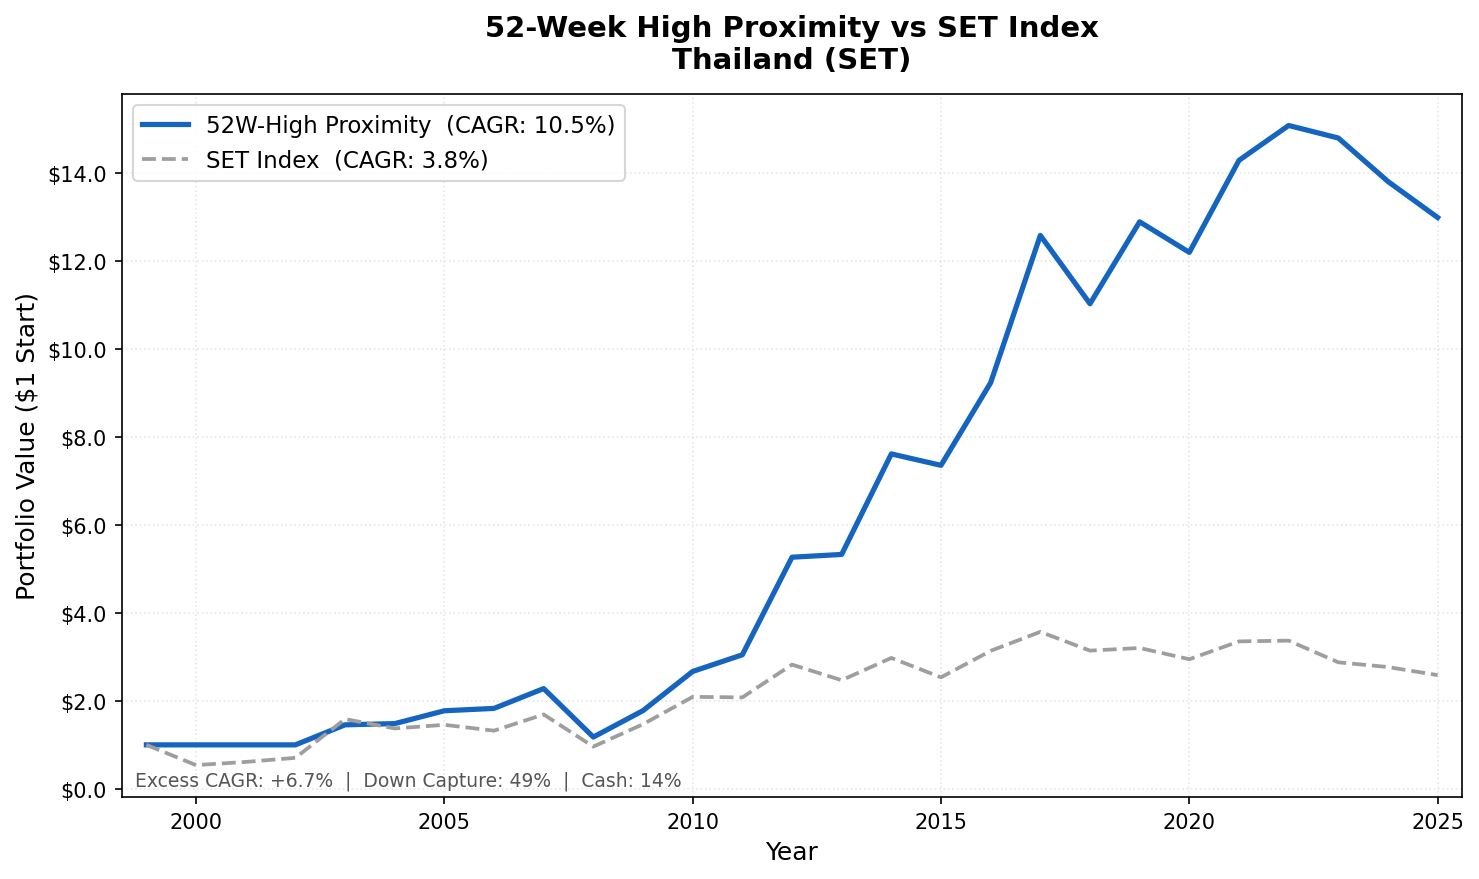
10.47% CAGR. +6.71% vs SET. 49.3% down capture.
| Metric | 52-Week High Thailand | SET Index |
|---|---|---|
| CAGR | 10.47% | 3.76% |
| Excess Return | +6.71% | - |
| Total Return | ฿12.98 per ฿1 | ฿2.58 per ฿1 |
| Max Drawdown | -55.72% | -48.10% |
| Sharpe Ratio | 0.387 | 0.054 |
| Up Capture | 92.69% | - |
| Down Capture | 49.34% | - |
| Cash Periods | 13.6% of quarters | - |
| Avg Stocks (invested) | 28.7 | - |
| Win Rate | 67.0% | - |
The up capture of 92.69% is notable. When the SET Index went up, the Thailand strategy kept pace almost exactly, capturing effectively the full upside. Paired with 49.3% quarterly down capture, this creates an asymmetric return profile across the typical quarter. The strategy participated in up markets and, in most down quarters, absorbed about half the declines.
The win rate of 67.0% is strong. Two-thirds of the individual quarterly periods were positive against the benchmark. The edge comes from both a high batting average and the scale of wins relative to losses.
Year-by-Year Returns
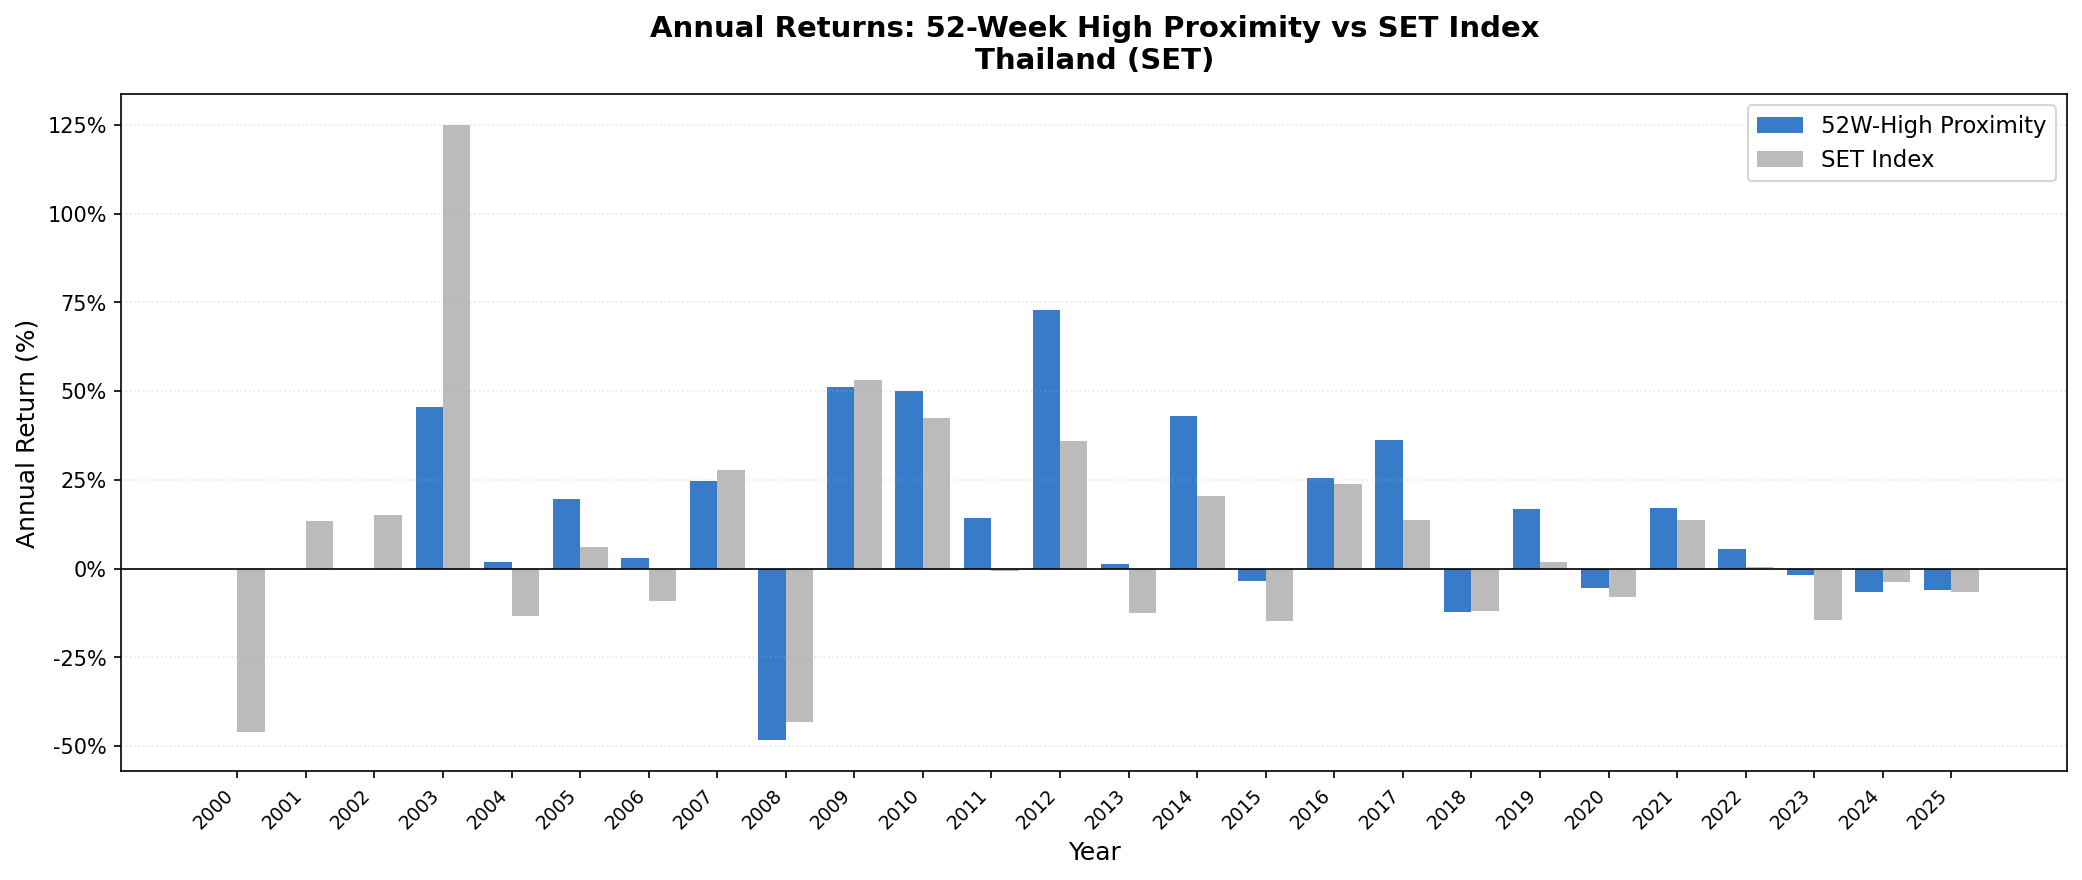
| Year | Thailand Strategy | SET Index | Excess |
|---|---|---|---|
| 2000 | 0.0% (cash) | -46.0% | n/a |
| 2001 | 0.0% (cash) | +13.4% | n/a |
| 2002 | 0.0% (cash) | +15.2% | n/a |
| 2003 | +45.5% | +125.0% | -79.5% |
| 2004 | +1.9% | -13.5% | +15.4% |
| 2005 | +19.7% | +6.0% | +13.7% |
| 2006 | +3.0% | -9.2% | +12.2% |
| 2007 | +24.7% | +27.9% | -3.2% |
| 2008 | -48.4% | -43.2% | -5.1% |
| 2009 | +51.0% | +53.0% | -1.9% |
| 2010 | +50.1% | +42.4% | +7.7% |
| 2011 | +14.2% | -0.6% | +14.8% |
| 2012 | +72.8% | +35.8% | +36.9% |
| 2013 | +1.2% | -12.6% | +13.8% |
| 2014 | +42.9% | +20.5% | +22.4% |
| 2015 | -3.4% | -14.8% | +11.4% |
| 2016 | +25.5% | +23.8% | +1.8% |
| 2017 | +36.3% | +13.8% | +22.5% |
| 2018 | -12.4% | -11.9% | -0.4% |
| 2019 | +16.9% | +1.9% | +15.0% |
| 2020 | -5.4% | -8.0% | +2.6% |
| 2021 | +17.2% | +13.8% | +3.4% |
| 2022 | +5.6% | +0.5% | +5.0% |
| 2023 | -1.9% | -14.6% | +12.7% |
| 2024 | -6.7% | -3.7% | -2.9% |
| 2025 | -5.9% | -6.6% | +0.7% |
2000–2002: three years of cash
Thailand's stock market was still recovering from the 1997 Asian financial crisis. The SET had low depth and few companies showing the relative strength the proximity signal requires. Three years of cash meant missing the 2000 SET crash (-46.0%) and the 2001-2002 recoveries (+13.4%, +15.2%). The starting base for the invested period was clean.
2003: the first year the signal fired, +45.5%
When Thailand's market recovered from the post-crisis trough, it did so with explosive force. The SET Index returned +125.0% in 2003. The strategy returned +45.5%, missing most of the surge (-79.5% underperformance). The strategy entered in 2003 but caught only the tail end of the recovery rally. The SET's domestically-oriented companies had already made massive moves before the proximity signal could position.
2009-2012: the standout stretch
Four years of strong absolute returns define the middle period, three of them beating the SET. 2009: +51.0% (SET +53.0%, -1.9% excess). 2010: +50.1% (SET +42.4%, +7.7% excess). 2011: +14.2% (SET -0.6%, +14.8% excess). 2012: +72.8% (SET +35.8%, +36.9% excess). These four years averaged about 47% annually while the SET averaged around 33%.
Thailand's economy was genuinely expanding during this period. Rising domestic consumption, infrastructure investment, and a growing tourism sector pushed corporate earnings. The SET was less correlated to US rate cycles or tech valuations. The proximity signal found companies at the leading edge of that domestic growth story.
2011: strong when SET was flat
2011 was a difficult global year. The SET Index returned -0.6%. Thailand returned +14.2% on the strategy (+14.8% excess). Thailand's domestic consumption story was intact and the proximity signal found the companies insulated from the European debt crisis that dominated global sentiment.
2022: a clear protection year
2022 is a clear demonstration of the signal's downside protection in a high-stress environment. The Federal Reserve raised rates from near zero to over 4%. US growth stocks crashed. The SET Index rose just 0.5%. The Thailand 52-week high strategy returned +5.6% (+5.0% excess).
The 5.0 percentage point excess return in 2022 happened because Thailand's equity market has different rate sensitivity than US equities. Thai companies near their 52-week highs in 2022 were domestic-oriented businesses: consumer staples, utilities, and financials that benefited from rising local rates. The proximity filter naturally positioned in exactly that subset.
2023-2025: three consecutive negative years, mostly outperforming the index
The strategy returned -1.9%, -6.7%, and -5.9% from 2023 to 2025. The SET Index fell -14.6%, -3.7%, and -6.6% respectively. The strategy outperformed by +12.7% in 2023, lagged slightly in 2024, and roughly matched in 2025.
Thailand's economy faced headwinds: weak Chinese tourism recovery, manufacturing competitiveness pressure, political uncertainty. The SET struggled to generate the upward momentum that the proximity signal looks for. Fewer stocks near annual highs means fewer qualifying positions and more muted returns.
This is an honest weakness in any single-exchange strategy. Domestic economic cycles can last several years and create extended periods where the signal fires in a flat or declining market. But even in these difficult years, the downside protection mechanism worked: the strategy lost less than the index.
Why Anchoring Works in Thailand
Thailand's SET has high retail participation, consistent with other Southeast Asian markets. Retail investors anchor to visible price levels: 52-week highs, round numbers, all-time highs. These serve as reference points for buy and sell decisions.
The SET also has meaningful price continuity. Thai stocks don't gap wildly on earnings the way US stocks do. Price approaches to annual highs tend to be gradual, which creates a longer window for the proximity signal to position ahead of breakouts.
The 13.6% cash periods reflect moderate selectivity. Thailand isn't so illiquid or distressed that the signal rarely fires (like some frontier markets), but it doesn't have deep enough liquidity for the signal to always find 30 qualifying stocks. The cash periods provide natural drawdown protection.
Limitations
Currency risk. Returns are in THB. THB/USD fluctuations matter for international investors. The THB is a managed float with periodic depreciation pressure.
Max drawdown of 55.72%, worse than the index. 2008 saw -48.4% in a single year, below the SET's -43.2%. Unlike most markets in this series, the strategy's peak-to-trough drawdown (-55.7%) exceeded the index's (-48.1%). The 49% quarterly down capture reflects milder-than-index losses in the typical down quarter, but the 2008 crash hit the high-proximity Thai names harder than the broad index.
2023-2025 negative returns. Three consecutive years of negative absolute returns show that the strategy is not immune to prolonged domestic headwinds. It still beat the SET Index in 2023 and roughly matched it in 2025, though it lagged slightly in 2024.
Liquidity constraints. Thailand's mid-cap segment is thinner than India or Korea. Position sizing matters. Transaction costs may be higher in practice than modeled.
Survivorship bias. Companies that delisted or failed during the 25-year period aren't fully tracked through failure. Historical drawdowns are likely somewhat understated.
Run This Screen Yourself
Current 52-week high proximity screen (Thai stocks):
WITH price_window AS (
    SELECT
        symbol,
        TRY_CAST(date AS DATE) AS trade_date,
        adjClose,
        high,
        dateEpoch,
        MAX(high) OVER (
            PARTITION BY symbol ORDER BY dateEpoch
            ROWS BETWEEN 251 PRECEDING AND CURRENT ROW
        ) AS high_52w,
        COUNT(*) OVER (
            PARTITION BY symbol ORDER BY dateEpoch
            ROWS BETWEEN 251 PRECEDING AND CURRENT ROW
        ) AS row_count
    FROM stock_eod
    WHERE TRY_CAST(date AS DATE) >= CURRENT_DATE - INTERVAL '14' MONTH
      AND adjClose > 0 AND high > 0
),
latest AS (
    SELECT symbol, adjClose, high_52w
    FROM price_window
    WHERE trade_date >= CURRENT_DATE - INTERVAL '10' DAY
      AND high_52w > 0 AND row_count >= 100
    QUALIFY ROW_NUMBER() OVER (PARTITION BY symbol ORDER BY dateEpoch DESC) = 1
)
SELECT
    l.symbol,
    p.companyName,
    p.sector,
    ROUND(l.adjClose / l.high_52w, 4) AS proximity_ratio,
    ROUND(p.marketCap / 1e9, 2) AS mktcap_bn_thb
FROM latest l
JOIN profile p ON l.symbol = p.symbol
WHERE p.exchange = 'SET'
ORDER BY proximity_ratio DESC
LIMIT 30
Run this screen on Ceta Research
The full backtest code (Python + DuckDB) is on GitHub.
Part of a Series
This post is part of our 52-week high proximity global exchange comparison:
- India (NSE): 19.0% CAGR, +7.8% vs Sensex
- Korea (KSC): 12.1% CAGR, 38% Down Capture
- Japan (JPX): Steady Alpha in a Flat Market
- Global Comparison: 52-Week High Proximity Across Exchanges
References
- George, T. & Hwang, C. (2004). "The 52-Week High and Momentum Investing." Journal of Finance, 59(5), 2145–2176.
- Jegadeesh, N. & Titman, S. (1993). "Returns to Buying Winners and Selling Losers: Implications for Stock Market Efficiency." Journal of Finance, 48(1), 65–91.
- Rouwenhorst, K. (1999). "Local Return Factors and Turnover in Emerging Stock Markets." Journal of Finance, 54(4), 1439–1464.
Data: Ceta Research (FMP financial data warehouse). Universe: SET. Quarterly rebalance, equal weight, next-day close execution, transaction costs included, 2000–2025. Returns in THB, benchmark SET Index.
Past performance does not guarantee future results. This is educational content, not investment advice.

