
Z-Score Pairs Trading Fails on Every Exchange Tested: 7-Exchange Backt

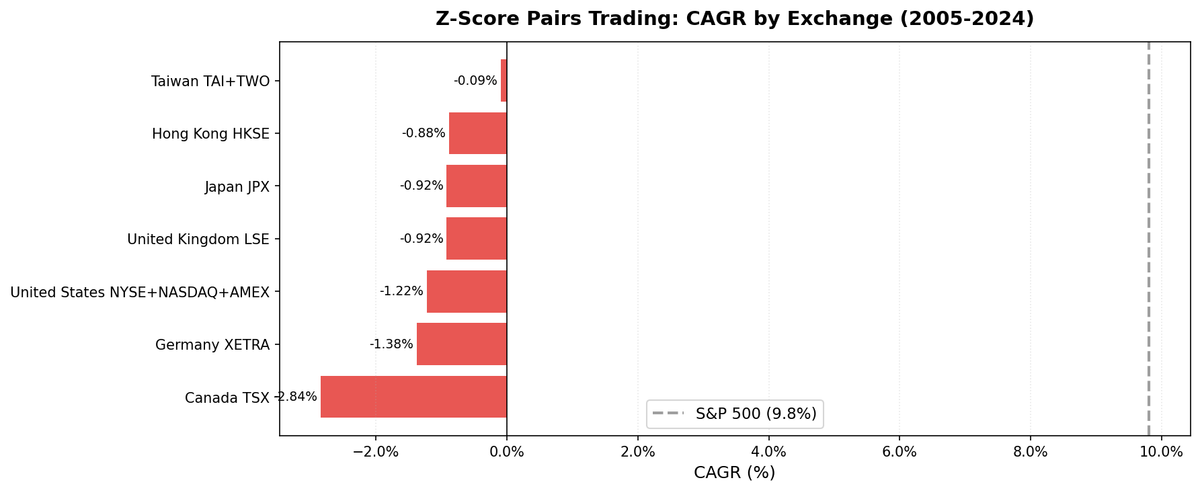
We tested active z-score pairs trading on 7 major exchanges from 2005 to 2024. Convergence rates ranged from 77% to 87%. Every exchange lost money. Canada lost the most (-2.84% CAGR). Taiwan came closest to flat (-0.09% CAGR). The underlying cause is the same everywhere: transaction costs absorb the mean-reversion gain.
Contents
- Method
- What We Found
- Universal failure
- The convergence rate doesn't predict performance
- Germany: 40% cash years
- Canada: worst avg trade return
- Taiwan: the near-zero outlier
- Why It Fails Everywhere
- What Would Fix It
- Limitations
- Run It Yourself
- Takeaway
- References
Method
Same strategy across all exchanges. Annual pair formation (same sector, correlation > 0.70, AR(1) half-life 5-60 days, top 20 pairs). Daily z-score monitoring with 40-day rolling window. Entry at |z| > 2.0, exit at |z| < 0.5 (convergence), 60-day time stop, or -5% loss stop. Transaction costs at ~0.1% per leg (4 legs per trade).
- Exchanges excluded from content due to data quality issues: -
- South Africa (JNB): 2006: +331%, 2011-2013: 100-300% annually. Implausible for a market-neutral strategy. Cause: thin universe (73 large-cap stocks) and apparent data gaps in 2004-2005 that corrupt beta estimates. -
- India (BSE+NSE): 2005: +50%, 2006: +111%. FMP data coverage for India is sparse in 2004. Formation-year beta estimates are unstable. -
- Korea (KSC): 2005: +66%, 2008: +56%. Same data warmup issue, plus the 2008 KRW currency crisis disrupts spread estimates. -
- Sweden (STO): 2005: +54%. Warmup artifact. -
- China (SHZ+SHH): 2005: +54%. Warmup artifact.
All five excluded exchanges show the same pattern: extreme returns in 2005 followed by normal-range returns after that. The common cause is FMP's sparse 2004 data coverage for these markets, which corrupts the formation-year OLS beta. These results aren't representative.
The seven clean exchanges:
| Exchange | Universe |
|---|---|
| NYSE+NASDAQ+AMEX | US large caps |
| JPX | Japan large caps |
| LSE | UK large caps |
| HKSE | Hong Kong large caps |
| TAI+TWO | Taiwan large caps |
| XETRA | Germany large caps |
| TSX | Canada large caps |
What We Found
Universal failure
Every exchange posted negative CAGR over 20 years. The range was -0.09% (Taiwan) to -2.84% (Canada). Convergence rates ranged from 77.7% (Canada) to 86.6% (US).
| Exchange | CAGR | vs SPY | Sharpe | Max DD | Cash% | Conv% | Avg Trade |
|---|---|---|---|---|---|---|---|
| TAI+TWO (Taiwan) | -0.09% | -9.91% | -0.173 | -23.52% | 20% | 80.4% | +0.107% |
| HKSE (Hong Kong) | -0.88% | -10.69% | -1.913 | -17.31% | 5% | 82.6% | -0.143% |
| JPX (Japan) | -0.92% | -10.73% | -0.623 | -17.43% | 0% | 85.4% | -0.139% |
| LSE (UK) | -0.92% | -10.74% | -1.224 | -24.49% | 5% | 81.4% | -0.053% |
| NYSE+NASDAQ+AMEX (US) | -1.22% | -11.03% | -2.750 | -21.81% | 0% | 86.6% | -0.181% |
| XETRA (Germany) | -1.38% | -11.19% | -0.951 | -24.31% | 40% | 80.9% | -0.261% |
| TSX (Canada) | -2.84% | -12.65% | -1.714 | -44.26% | 5% | 77.7% | -0.454% |
SPY benchmark: 9.81% CAGR (2005-2024).
The convergence rate doesn't predict performance
Taiwan has an 80.4% convergence rate and a -0.09% CAGR. The US has an 86.6% convergence rate and a -1.22% CAGR. Higher convergence rate doesn't produce better returns.
The chart showing convergence rate vs average trade return across all seven exchanges illustrates this directly. Taiwan and UK are the outliers with near-zero avg trade returns (+0.107% and -0.053% respectively). The US has the highest convergence rate and one of the worst avg trade returns (-0.181%). There is no positive relationship between convergence rate and profitability.
The explanation is mechanical. Convergence rate measures how often the z-score returns to below 0.5 standard deviations from the mean. That's a mild condition. The spread only needs to travel from |z|=2.0 to |z|<0.5, which corresponds to a small move in log-price space. The gain from that travel, after four transaction legs, often doesn't survive.
Germany: 40% cash years
Germany (XETRA) has 40% cash years, meaning 8 out of 20 years the strategy found fewer than 3 active pairs and held cash instead. XETRA's same-sector large-cap universe is smaller than the US or Japan. Fewer qualifying pairs means fewer z-score crossings means fewer trades. The strategy under-earns its cost of capital even when it's invested, and then holds cash for much of the time.
Canada: worst avg trade return
Canada (TSX) has the worst per-trade performance at -0.454% avg trade return and the lowest convergence rate at 77.7%. TSX large caps tend toward resource and financial stocks, which are concentrated in a few sectors. Same-sector correlation is high but the pairs are highly correlated to commodity cycles. When oil prices or metals prices shift, many TSX pairs diverge simultaneously and stay diverged, causing loss stops across multiple pairs in the same year. The 2016 (-7.08%) and 2020 (-6.76%) years are examples of this pattern.
Taiwan: the near-zero outlier
Taiwan (TAI+TWO) comes closest to zero (-0.09% CAGR) with a positive avg trade return (+0.107%). The strategy was in cash 20% of the time (4 years). Taiwan's semiconductor-heavy large caps form tight within-sector pairs in tech and electronic components. When they do form valid pairs, the spreads are tight enough that the cost drag is small. But the universe is thin enough that many years produce fewer than the minimum pairs required.
The net effect: Taiwan is the least-bad result, not a success. The positive avg trade return is wiped out by cash periods and the overall 20-year loss.
Why It Fails Everywhere
The root cause is the same on every exchange. The mean-reversion signal works mechanically: spreads that diverge do tend to revert. But:
- The gain per converging trade is small. The entry at |z|=2.0 and exit at |z|=0.5 captures a fraction of the spread's volatility. Typical gross gain per converging trade: 0.5-1.5% on the spread.
- Transaction costs are fixed. Four legs × ~0.1% = ~0.4% per trade, regardless of whether the spread produces 0.3% or 3.0% gross.
- Loss stops are real losses. 8-16% of trades hit the loss stop. These typically lose 3-5% before the stop triggers. The converging trades need to make enough profit to cover these.
The blended result: converging trades barely cover their cost, loss stops create real losses, time stops close unprofitable positions at zero, and the net average is negative. This mechanism operates identically across developed markets.
The 2008 and 2022 years show the strategy's one genuine property: market neutrality. In 2008, all seven exchanges outperformed SPY (which fell 36%). The portfolio has near-zero market beta by construction. But market neutrality with a negative carry isn't a useful investment property.
What Would Fix It
The math requires either lower transaction costs or larger spreads at entry.
Lower costs: feasible for prime brokerage clients with negotiated commissions, near-zero for market makers. Out of reach for most investors.
Wider entry threshold: raising the entry from |z|=2.0 to |z|=2.5 or |z|=3.0 would increase the gross gain per trade but reduce trade frequency. At very high thresholds, the strategy is essentially in cash most of the time.
Better pair selection: using stricter cointegration tests (ADF, KPSS) rather than the AR(1) half-life filter might select pairs where the spread volatility is higher and the per-trade gain is larger. This is worth testing.
Alternative timing: the academic literature (Gatev et al., 2006; Do and Faff, 2010) documents that pairs trading was profitable in the 1962-2002 period. The mechanism worked before widespread algorithmic execution compressed the edge. In the 2005-2024 window used here, the edge is gone or too small to capture after costs.
Limitations
Short-selling assumed everywhere. Short-selling restrictions in practice vary by market and change over time. In Taiwan and Hong Kong, short-selling of specific stocks can be restricted or expensive. The backtest doesn't model borrow costs.
Fixed formation calendar. Pairs form once per year. If a pair's cointegrating relationship breaks mid-year (merger announcement, spinoff, earnings shock), the strategy continues trading it until year-end or a stop is hit. Rolling formation would catch this faster.
FMP data quality. Five exchanges were excluded due to 2004 data sparsity corrupting beta estimates. The seven clean exchanges in this comparison have full coverage from 2004 onward.
Run It Yourself
git clone https://github.com/ceta-research/backtests.git
cd backtests

export CR_API_KEY="your_key_here"

# Run all exchanges
python3 pairs-zscore/backtest.py --global --output results/exchange_comparison.json

# Run a specific exchange
python3 pairs-zscore/backtest.py --preset japan

# Current live signals
python3 pairs-zscore/screen.py --preset japan
Takeaway
Active z-score pairs trading, with realistic parameters and transaction costs, produced negative returns on every exchange tested over 20 years. Convergence rates of 77-87% look like a working signal. They are. The problem isn't the signal. It is the economics: mean-reversion gains are too small to cover four-leg transaction costs.
The strategy has real properties worth keeping. Market neutrality. Very low volatility. No correlation to SPY. These are valuable in a portfolio context if the carry is positive. Here it isn't.
The pairs trading methodology works. This particular implementation doesn't scale to typical trading costs. The 2006-vintage literature found it did. The 2025-vintage data says it doesn't.
References
- Gatev, E., Goetzmann, W. & Rouwenhorst, K. (2006). "Pairs Trading: Performance of a Relative-Value Arbitrage Rule." Review of Financial Studies, 19(3), 797-827.
- Do, B. & Faff, R. (2010). "Does Simple Pairs Trading Still Work?" Financial Analysts Journal, 66(4), 83-95.
- Do, B. & Faff, R. (2012). "Are Pairs Trading Profits Robust to Trading Costs?" Journal of Financial Research, 35(2), 261-287.
- Krauss, C. (2017). "Statistical Arbitrage Pairs Trading Strategies: Review and Outlook." Journal of Economic Surveys, 31(2), 513-545.
Run It Yourself
Explore the data behind this analysis on Ceta Research. Query our financial data warehouse with SQL, build custom screens, and run your own backtests across 70,000+ stocks on 20 exchanges.
Data: Ceta Research (FMP data warehouse). 7 exchanges, 2005-2024. All exchanges: large caps only, same formation and trading parameters. Note: Past performance doesn't guarantee future results. This is educational content, not investment advice.


