
Z-Score Pairs Trading Backtest: 86.6% Convergence Rate, -1.22% CAGR

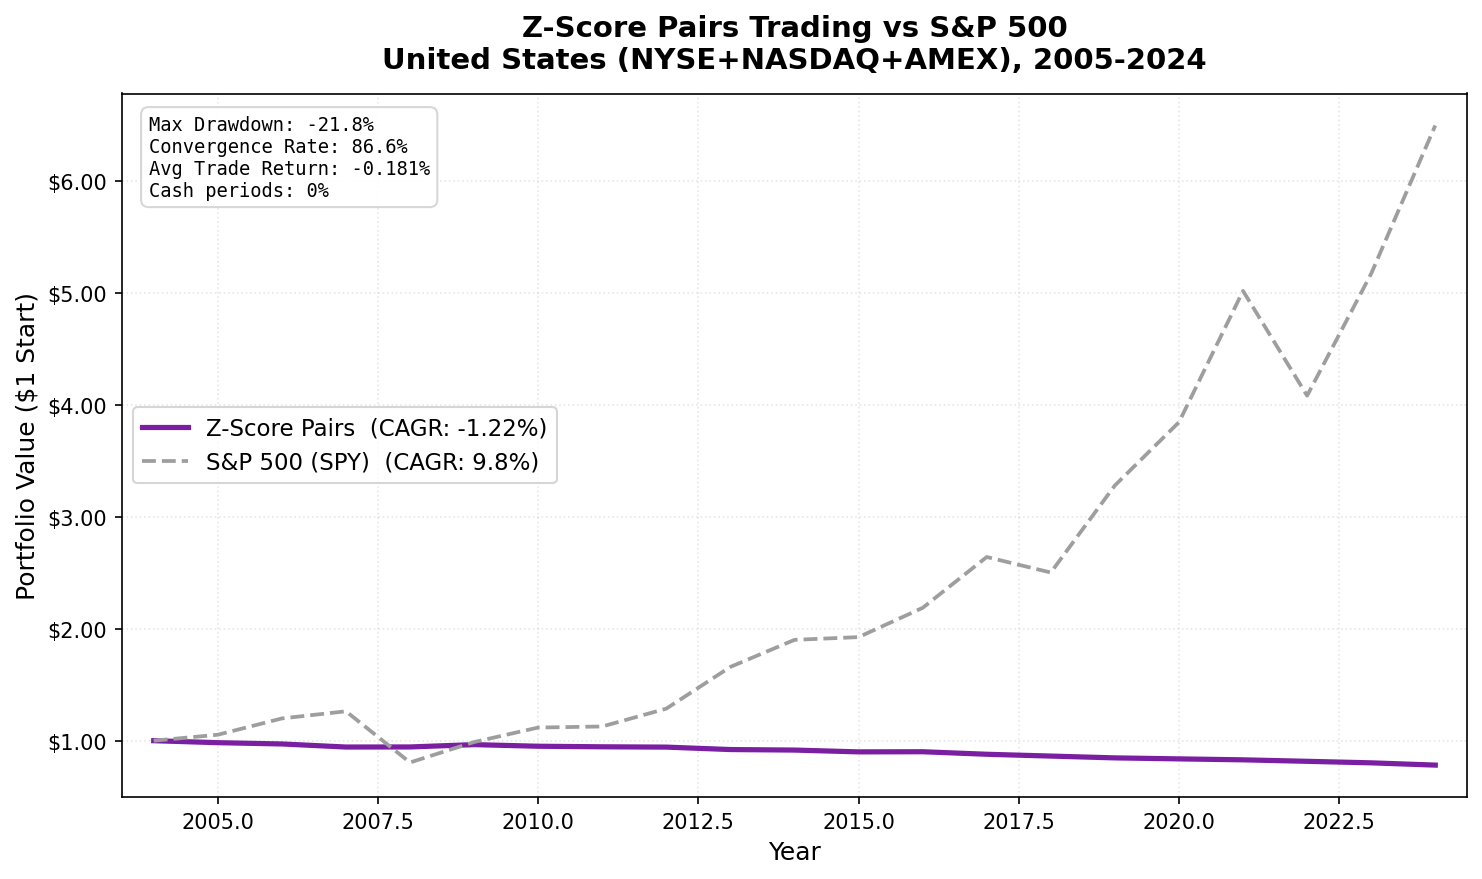
We ran an active z-score pairs trading backtest on US large caps from 2005 to 2024. 134 trades per year. 86.6% of spreads converged back to the mean. The strategy returned -1.22% CAGR over 20 years, vs 9.81% for the S&P 500.
Contents
- Method
- What We Found
- The convergence-profitability disconnect
- 20 years, 3 positive years
- Trade breakdown
- The Data
- Annual returns (NYSE+NASDAQ+AMEX, 2005-2024)
- Summary metrics
- The No-Cost Thought Experiment
- Limitations
- Run It Yourself
- Takeaway
- References
The convergence rate sounds like a success. It isn't. Here is the math that explains why.
Method
- Data source: Ceta Research (FMP data warehouse, 70K+ stocks)
- Universe: Top 30 large-cap stocks per sector by market cap, same exchange (NYSE+NASDAQ+AMEX)
- Formation: Annual. One prior year (252 trading days) of daily price data for pair selection.
- Pair selection: Same sector, returns correlation > 0.70, half-life 5-60 days (AR(1) mean-reversion speed filter), top 20 pairs.
- Signal: 40-day rolling z-score on log-price spread:
z = (spread - rolling_mean) / rolling_std - Entry: |z| > 2.0 (one position per pair at a time)
- Exit: |z| < 0.5 (convergence), 60-day time stop, or -5% loss stop
- Costs: 4 one-way legs per trade (open long + open short + close long + close short), ~0.1% each
- Period: 2005-2024 (20 years)
- Cash rule: Year marked as cash if fewer than 3 pairs have any trades
The half-life filter is the key addition over basic correlation screening. A half-life of 5-60 days means the spread reverts to its mean in 5-60 trading days on average, confirming genuine mean-reversion behavior. Pairs with half-life > 60 days barely revert. Pairs < 5 days are noise.
What We Found
The convergence-profitability disconnect
86.6% of the 2,680 trades across 20 years reached the convergence exit (|z| < 0.5). On its face, that sounds like the strategy is working. Spreads were reverting as expected. The pairs were behaving.
But the average trade returned -0.181%. The 20-year CAGR was -1.22%.
Here is why those two facts aren't contradictory.
When you enter at |z| > 2.0 and exit at |z| < 0.5, the spread only needs to travel from 2.0 to 0.5 standard deviations. In log-price terms, with a typical spread volatility of 5-8%, that distance corresponds to roughly 0.5-1.0% on the spread before you capture it. That is your gross profit per converging trade.
Transaction costs are 4 legs × ~0.1% = ~0.4% per trade. So a converging trade nets you approximately 0.5-1.0% gross minus 0.4% cost = 0.1-0.6% net, at best. When you include the 13.4% of trades that don't converge (time stops at -0%, loss stops at some negative value, plus year-end exits), the average across all trades lands at -0.181%.
The strategy doesn't fail because pairs don't revert. They do. It fails because the reversion gain is smaller than the cost of executing it.
20 years, 3 positive years
- The portfolio was positive in 3 out of 20 calendar years: -
- 2008: +0.07%. SPY fell 36.2%. Near-perfect market neutrality during the financial crisis. -
- 2009: +2.20%. Spreads remained active and a few pairs converged profitably. -
- 2016: +0.14%. Marginal positive.
All other 17 years were negative, ranging from -0.30% (2012) to -2.83% (2007). The loss is small and consistent. It doesn't look like volatility. It looks like a slow, steady drain.
The annualized volatility of the strategy is 1.17%. The S&P 500's is 17.04%. This is a near-zero-beta portfolio (beta = -0.009) that happens to lose a small amount every year from transaction costs.
Trade breakdown
| Metric | Value |
|---|---|
| Total trades (2005-2024) | 2,680 |
| Trades per year (avg) | 134 |
| Avg holding period | 15.4 days |
| Convergence rate | 86.6% |
| Time stop rate | 0.7% |
| Loss stop rate | 7.6% |
| Year-end exit rate | 5.0% |
| Avg trade return | -0.181% |
The loss stop rate of 7.6% confirms that some pairs diverge substantially. Those trades typically lose 4-5% before the stop triggers. Combined with the cost drag on converging trades, the blended average lands negative.
The Data
Annual returns (NYSE+NASDAQ+AMEX, 2005-2024)
| Year | Z-Score Pairs | S&P 500 | Excess |
|---|---|---|---|
| 2005 | -1.77% | +5.33% | -7.10% |
| 2006 | -1.16% | +13.84% | -15.00% |
| 2007 | -2.83% | +5.33% | -8.16% |
| 2008 | +0.07% | -36.23% | +36.30% |
| 2009 | +2.20% | +22.66% | -20.46% |
| 2010 | -1.49% | +13.13% | -14.63% |
| 2011 | -0.52% | +0.85% | -1.37% |
| 2012 | -0.30% | +14.17% | -14.46% |
| 2013 | -2.31% | +29.00% | -31.31% |
| 2014 | -0.51% | +14.56% | -15.07% |
| 2015 | -1.76% | +1.29% | -3.05% |
| 2016 | +0.14% | +13.58% | -13.44% |
| 2017 | -2.51% | +20.78% | -23.29% |
| 2018 | -1.84% | -5.25% | +3.41% |
| 2019 | -1.88% | +31.09% | -32.96% |
| 2020 | -1.05% | +17.23% | -18.28% |
| 2021 | -1.02% | +30.51% | -31.52% |
| 2022 | -1.59% | -18.65% | +17.06% |
| 2023 | -1.68% | +26.71% | -28.39% |
| 2024 | -2.52% | +25.59% | -28.11% |
Summary metrics
| Metric | Z-Score Pairs | S&P 500 (SPY) |
|---|---|---|
| CAGR (2005-2024) | -1.22% | +9.81% |
| Total return | -21.81% | +550.09% |
| Max drawdown | -21.81% | -36.23% |
| Annualized volatility | 1.17% | 17.04% |
| Sharpe ratio | -2.75 | 0.46 |
| Beta vs SPY | -0.009 | 1.00 |
| Cash periods | 0/20 | — |
The portfolio was invested in all 20 years. The near-zero beta confirms market neutrality. The -2.75 Sharpe is terrible but the low volatility means the absolute dollar losses are small: $100 invested in 2005 would be worth ~$78 in 2024.
The No-Cost Thought Experiment
If you remove transaction costs from this backtest, the average trade return would shift from -0.181% to approximately +0.2-0.3% (rough estimate: four 0.1% legs = 0.4% cost per trade, so removing it flips the sign). The strategy would likely show a small positive CAGR.
This is a real arbitrage opportunity, but one that requires essentially zero transaction costs to capture. Gatev, Goetzmann and Rouwenhorst (2006) documented strong returns from pairs trading in the 1962-2002 period. They found ~11% excess return annually. Transaction costs in the 1960s-1990s were different, and more importantly, algorithmic execution has compressed the remaining edge.
The practical implication: this strategy might be viable for a market maker or high-frequency shop with near-zero execution costs. For a retail or institutional investor paying standard commissions, the edge is gone.
Limitations
Survivorship bias. The universe uses currently active stocks (isActivelyTrading = true). Companies that went bankrupt, were acquired, or delisted during 2005-2024 are excluded. This biases results slightly upward.
Short-selling assumed. The strategy requires short-selling both legs of each trade. Borrow costs, availability constraints, and margin requirements aren't modeled.
Fixed annual beta. The hedge ratio is estimated once per year during pair formation. If the relationship between two stocks shifts mid-year, the spread becomes non-stationary and z-score signals degrade. Rolling beta would adapt but introduces estimation noise.
Half-life filter is AR(1), not ADF. The half-life is estimated from AR(1) regression on the spread, not a formal cointegration test. It filters out the worst pairs but doesn't guarantee cointegration.
Transaction costs are flat. The 0.1% per leg assumption is reasonable for US large caps but doesn't account for market impact, bid-ask spread variation across market conditions, or borrowing costs for the short leg.
Run It Yourself
The full backtest is in the open-source Ceta Research backtests repo. You need a Ceta Research API key to fetch the data.
# Clone the backtests repo
git clone https://github.com/ceta-research/backtests.git
cd backtests

# Set your API key
export CR_API_KEY="your_key_here"

# Run US backtest
python3 pairs-zscore/backtest.py

# Run all exchanges
python3 pairs-zscore/backtest.py --global --output results/exchange_comparison.json

# Screen current z-score signals
python3 pairs-zscore/screen.py
The core SQL query for pair formation and z-score computation is available on the Ceta Research Data Explorer. View live US pairs screen. It finds all same-sector pairs with correlation > 0.70, computes OLS beta, estimates AR(1) half-life, and returns the current z-score for each pair.
Takeaway
Z-score pairs trading on US large caps produced 86.6% convergence and -1.22% CAGR over 20 years. The spread reverts most of the time. The profit per converging trade is too small to cover the four-leg transaction cost.
This isn't a data quality issue or a backtest artifact. The same result appears on every exchange we tested (see the 7-exchange comparison). The strategy's logic is sound. Its economics aren't.
The convergence rate is a measure of how often the mean-reversion signal is correct. It isn't a measure of profitability. The gap between those two things is where the transaction costs live.
References
- Gatev, E., Goetzmann, W. & Rouwenhorst, K. (2006). "Pairs Trading: Performance of a Relative-Value Arbitrage Rule." Review of Financial Studies, 19(3), 797-827.
- Do, B. & Faff, R. (2010). "Does Simple Pairs Trading Still Work?" Financial Analysts Journal, 66(4), 83-95.
- Do, B. & Faff, R. (2012). "Are Pairs Trading Profits Robust to Trading Costs?" Journal of Financial Research, 35(2), 261-287.
Data: Ceta Research (FMP data warehouse). NYSE+NASDAQ+AMEX large caps, 2005-2024. Note: Past performance doesn't guarantee future results. This is educational content, not investment advice.


