
Working Capital Efficiency in Sweden: 8.8% CAGR With Strong Industrial Compounding

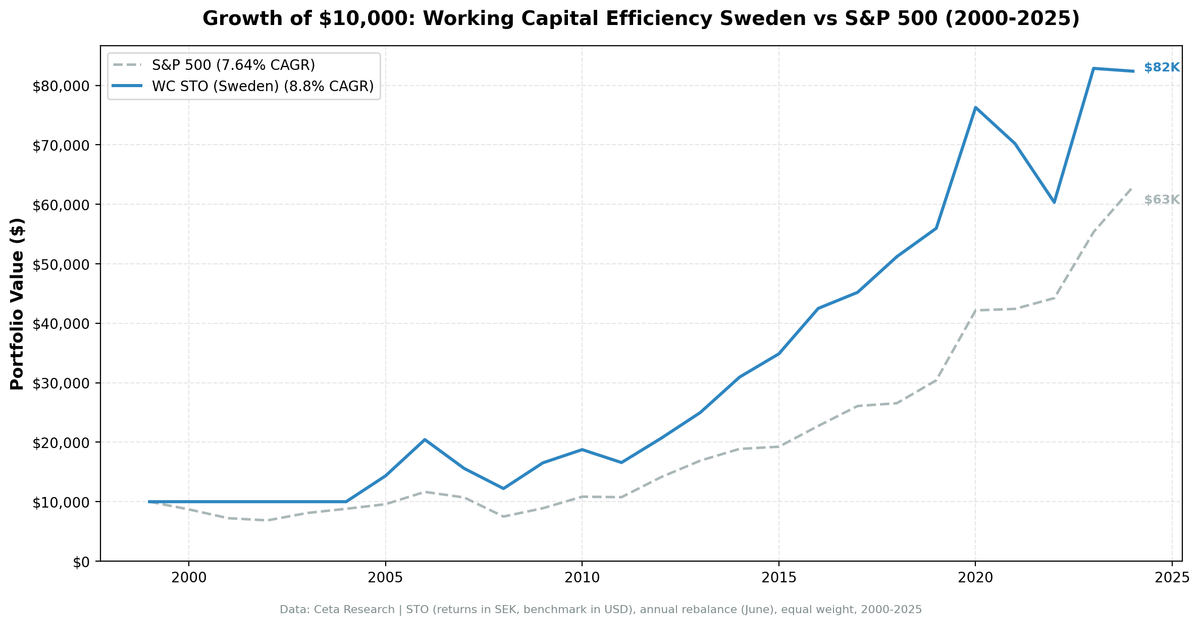
Sweden produced a solid working capital efficiency portfolio. The CAGR of 8.80% outperforms the S&P 500 by 1.17% per year. The Sharpe ratio of 0.350 and max drawdown of -40.27% reflect Sweden's more volatile market.
Contents
- Why Sweden?
- Methodology
- The Numbers
- What Drove the Returns
- Cash Periods
- Run It Yourself
- Limitations
- Part of a Series
The Swedish market is small but efficient. About 25 companies consistently qualified, and the portfolio won 52% of years against the S&P 500.
Why Sweden?
Sweden has an outsized number of high-quality industrial and technology companies for its market size. Companies like Atlas Copco, Hexagon, Alfa Laval, and Assa Abloy are global leaders in niche industrial segments. These companies run lean, capital-efficient operations with strong recurring revenue.
The Stockholm exchange (STO) also has relatively less sell-side coverage than US or UK markets, particularly for mid-cap industrials. The accrual anomaly predicts that less-followed markets offer more mispricing. Working capital efficiency captures that.
Methodology
Universe: STO (Stockholm Stock Exchange) Period: 2000-2025 (25 years, 25 annual periods) Portfolio: Top 30 by WC/Revenue ASC, equal weight. Cash if fewer than 10 qualify. Rebalancing: Annual (June) Costs: Size-tiered transaction costs applied Point-in-time: 45-day lag on financial data Data: Ceta Research (FMP financial data warehouse)
Note: Returns are in SEK (Swedish Krona). The benchmark is in USD. SEK depreciated from roughly 9.5/USD in 2000 to 11/USD in 2025, a modest decline. The currency effect is small but present.
Signal SQL:
SELECT b.symbol, p.companyName, p.exchange,
    ROUND((b.totalCurrentAssets - b.totalCurrentLiabilities) / i.revenue, 3)
        AS wc_to_revenue,
    ROUND(k.returnOnEquityTTM * 100, 1) AS roe_pct,
    ROUND(f.operatingProfitMarginTTM * 100, 1) AS opm_pct,
    ROUND(k.marketCap / 1e9, 2) AS mktcap_b
FROM balance_sheet b
JOIN income_statement i ON b.symbol = i.symbol
JOIN profile p ON b.symbol = p.symbol
JOIN key_metrics_ttm k ON b.symbol = k.symbol
JOIN financial_ratios_ttm f ON b.symbol = f.symbol
WHERE b.period = 'FY'
  AND b.totalCurrentAssets > b.totalCurrentLiabilities
  AND (b.totalCurrentAssets - b.totalCurrentLiabilities) / i.revenue < 0.50
  AND i.revenue > 0
  AND k.returnOnEquityTTM > 0.08
  AND f.operatingProfitMarginTTM > 0.10
  AND k.marketCap > 500000000
  AND p.exchange IN ('STO')
ORDER BY wc_to_revenue ASC
LIMIT 30
The Numbers
| Metric | WC Sweden | S&P 500 |
|---|---|---|
| CAGR | 8.80% | 7.64% |
| Excess CAGR | +1.17% | -- |
| Sharpe Ratio | 0.350 | 0.360 |
| Sortino Ratio | 0.803 | 0.671 |
| Max Drawdown | -40.27% | -35.60% |
| Annualized Volatility | 19.45% | 15.64% |
| Total Return | 724% | 529% |
| Beta | 0.886 | 1.0 |
| Down Capture | 77% | -- |
| Up Capture | 109% | -- |
| Win Rate | 52% | -- |
5 cash periods (20%), all in the early years (2000-2004). From 2005 onward, the portfolio was always invested, averaging 25.1 stocks.
The Sortino ratio of 0.803 outperforms SPY's 0.671, reflecting better return per unit of downside risk.
Annual returns:
| Year | Portfolio | S&P 500 | Excess |
|---|---|---|---|
| 2000 | 0.0% (cash) | -13.0% | +13.0% |
| 2001 | 0.0% (cash) | -17.0% | +17.0% |
| 2002 | 0.0% (cash) | -5.1% | +5.1% |
| 2003 | 0.0% (cash) | +18.1% | -18.1% |
| 2004 | 0.0% (cash) | +8.8% | -8.8% |
| 2005 | +43.4% | +8.7% | +34.7% |
| 2006 | +42.5% | +21.7% | +20.9% |
| 2007 | -23.7% | -8.1% | -15.6% |
| 2008 | -21.7% | -29.9% | +8.2% |
| 2009 | +35.4% | +18.6% | +16.8% |
| 2010 | +13.4% | +21.8% | -8.3% |
| 2011 | -11.6% | -0.7% | -10.9% |
| 2012 | +24.5% | +31.1% | -6.7% |
| 2013 | +21.0% | +19.7% | +1.3% |
| 2014 | +23.9% | +11.7% | +12.1% |
| 2015 | +12.7% | +1.9% | +10.8% |
| 2016 | +21.9% | +18.2% | +3.7% |
| 2017 | +6.4% | +14.7% | -8.4% |
| 2018 | +13.3% | +1.8% | +11.5% |
| 2019 | +9.3% | +14.5% | -5.2% |
| 2020 | +36.3% | +38.6% | -2.3% |
| 2021 | -8.0% | +0.6% | -8.6% |
| 2022 | -14.1% | +4.3% | -18.3% |
| 2023 | +37.3% | +25.1% | +12.2% |
| 2024 | -0.6% | +13.7% | -14.3% |
What Drove the Returns
The Nordic industrial boom (2005-2006, 2013-2016). Swedish industrials thrived during global expansion cycles. The portfolio returned +43.4% in 2005 and +42.5% in 2006. Then again, +23.9% in 2014. Swedish quality companies compound well when the global economy expands.
Financial crisis resilience (2008). -21.7% while the S&P 500 fell 29.9%. Swedish quality companies fell less than the US benchmark. The recovery in 2009 (+35.4%) was swift.
COVID recovery (2020, 2023). +36.3% in 2020 and +37.3% in 2023 (recovery from the 2022 drawdown). Swedish companies bounced hard when conditions normalized.
The 2022 drag. -14.1% while the S&P 500 returned +4.3%. Rising interest rates hit Swedish growth stocks and the krona weakened. The -18.3% excess was the worst year.
Cash Periods
2000-2004 were cash periods (5 of 25, 20%). FMP's Stockholm exchange data for the early 2000s was thinner. Fewer Swedish companies had the coverage depth for the quality filters to work. From 2005 onward, the portfolio was consistently invested.
The cash periods help the early numbers (the portfolio avoided the 2000-2002 downturn) but hurt 2003-2004, when the portfolio sat in cash during market rallies.
Run It Yourself
# Live screen (current Sweden stocks)
python3 working-capital/screen.py --preset sweden

# Historical backtest
python3 working-capital/backtest.py --preset sweden --output results/sweden.json --verbose
Limitations
Currency mismatch. Returns in SEK, benchmark in USD. The SEK depreciated modestly over the period, but the effect is smaller than for emerging market currencies.
Small market. 24.7 average stocks from a smaller exchange means individual company effects matter more. A few large Swedish industrials (Atlas Copco, Sandvik, Volvo) may dominate portfolio returns in certain years.
Cash periods in early years. 4 of 25 periods had no investment. This introduces uncertainty about how the strategy would have performed with full early data.
Concentration in industrials. Sweden's stock market is industrial-heavy. The working capital screen reinforces this by selecting the most efficient industrials. If the industrial sector undergoes a structural decline, the portfolio would be disproportionately affected.
Part of a Series
- Working Capital Efficiency in the US (flagship, full methodology)
- Working Capital Efficiency in India (best alpha, +8.9%/yr)
- Working Capital Efficiency in Canada (lowest drawdown, -22.3%)
- 13-Exchange Global Comparison
Data: Ceta Research (FMP financial data warehouse), STO, 2000-2025. Returns in SEK. Full methodology: METHODOLOGY.md


