
Working Capital Efficiency in India: 15.2% CAGR Over 25 Years (+2.9%/yr vs Sensex)

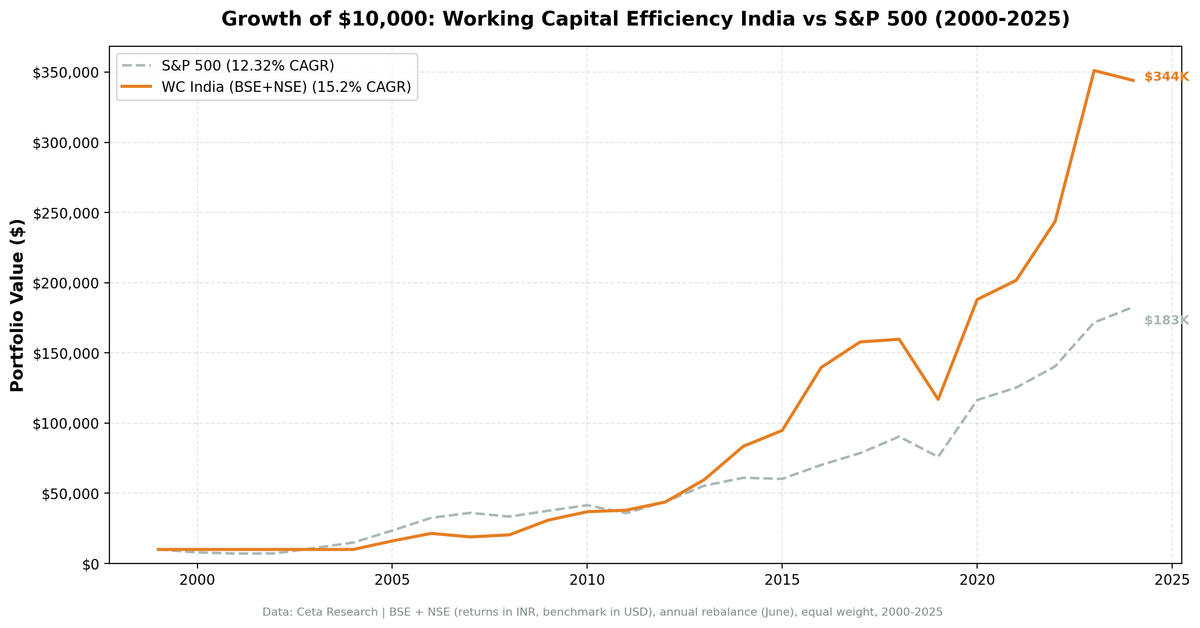
India produced strong absolute returns for working capital efficiency. Over 25 years, a portfolio of India's most capital-efficient companies returned 15.20% CAGR. The BSE Sensex returned 12.32% over the same period. That's +2.88% annual excess and a 60% win rate (15 out of 25 years beat the Sensex).
Contents
- Why India?
- Methodology
- The Numbers
- What Drove the Returns
- Cash Periods
- Run It Yourself
- Limitations
- Part of a Series
The strategy went to cash from 2000 through 2004 when too few Indian stocks qualified, then delivered strong returns through India's structural growth decades.
Why India?
Working capital efficiency screens for companies that convert revenue to cash without balance sheet buildup. India's growth economy from 2003 onward offered a large pool of companies doing exactly that: IT services firms with minimal inventory, consumer companies with strong collections, and industrial companies scaling efficiently.
Indian mid-caps had less analyst coverage through the 2000s and early 2010s. Pricing inefficiency was higher. The accrual anomaly (Sloan, 1996) predicts that markets misprice the difference between cash earnings and accrual-heavy earnings. Less coverage means more mispricing, which means a bigger signal for quality screens.
Methodology
Universe: BSE + NSE (Bombay Stock Exchange + National Stock Exchange of India) Period: 2000-2025 (25 years, 25 annual periods) Portfolio: Top 30 by WC/Revenue ASC, equal weight. Cash if fewer than 10 qualify. Rebalancing: Annual (June) Costs: Size-tiered transaction costs applied Point-in-time: 45-day lag on financial data Data: Ceta Research (FMP financial data warehouse)
Benchmark: BSE Sensex (^BSESN). Both portfolio and benchmark returns are in INR, making the comparison currency-neutral.
Signal SQL:
SELECT b.symbol, p.companyName, p.exchange,
    ROUND((b.totalCurrentAssets - b.totalCurrentLiabilities) / i.revenue, 3)
        AS wc_to_revenue,
    ROUND(k.returnOnEquityTTM * 100, 1) AS roe_pct,
    ROUND(f.operatingProfitMarginTTM * 100, 1) AS opm_pct,
    ROUND(k.marketCap / 1e9, 2) AS mktcap_b
FROM balance_sheet b
JOIN income_statement i ON b.symbol = i.symbol
JOIN profile p ON b.symbol = p.symbol
JOIN key_metrics_ttm k ON b.symbol = k.symbol
JOIN financial_ratios_ttm f ON b.symbol = f.symbol
WHERE b.period = 'FY'
  AND b.totalCurrentAssets > b.totalCurrentLiabilities
  AND (b.totalCurrentAssets - b.totalCurrentLiabilities) / i.revenue < 0.50
  AND i.revenue > 0
  AND k.returnOnEquityTTM > 0.08
  AND f.operatingProfitMarginTTM > 0.10
  AND k.marketCap > 500000000
  AND p.exchange IN ('BSE', 'NSE')
ORDER BY wc_to_revenue ASC
LIMIT 30
The Numbers
| Metric | WC India | Sensex |
|---|---|---|
| CAGR | 15.20% | 12.32% |
| Excess CAGR | +2.88% | -- |
| Sharpe Ratio | 0.373 | 0.275 |
| Sortino Ratio | 1.036 | 0.617 |
| Max Drawdown | -26.83% | -29.02% |
| Annualized Volatility | 23.32% | 21.19% |
| Total Return | 3,341% | 1,727% |
| Beta | 0.631 | 1.0 |
| Down Capture | 4% | -- |
| Up Capture | 103% | -- |
| Win Rate | 60% | -- |
The 4% down capture means the portfolio barely moved when the Sensex fell. Five cash periods (2000-2004) helped early, but from 2005 onward the portfolio outperformed the Sensex in most years.
Annual returns:
| Year | Portfolio | Sensex | Excess |
|---|---|---|---|
| 2000 | 0.0% (cash) | -21.4% | +21.4% |
| 2001 | 0.0% (cash) | -9.6% | +9.6% |
| 2002 | 0.0% (cash) | +1.4% | -1.4% |
| 2003 | 0.0% (cash) | +53.6% | -53.6% |
| 2004 | 0.0% (cash) | +35.2% | -35.2% |
| 2005 | +60.7% | +57.0% | +3.7% |
| 2006 | +33.4% | +38.7% | -5.3% |
| 2007 | -11.7% | +10.8% | -22.5% |
| 2008 | +7.8% | -7.4% | +15.2% |
| 2009 | +51.4% | +12.6% | +38.8% |
| 2010 | +19.5% | +10.5% | +9.0% |
| 2011 | +2.9% | -13.5% | +16.4% |
| 2012 | +15.3% | +22.7% | -7.3% |
| 2013 | +36.3% | +25.9% | +10.4% |
| 2014 | +39.8% | +10.1% | +29.7% |
| 2015 | +13.6% | -1.3% | +14.8% |
| 2016 | +47.3% | +16.5% | +30.8% |
| 2017 | +13.0% | +12.0% | +1.1% |
| 2018 | +1.2% | +15.0% | -13.8% |
| 2019 | -26.8% | -16.0% | -10.8% |
| 2020 | +60.9% | +53.3% | +7.6% |
| 2021 | +7.3% | +7.7% | -0.4% |
| 2022 | +20.8% | +12.1% | +8.8% |
| 2023 | +44.1% | +22.3% | +21.8% |
| 2024 | -2.0% | +6.4% | -8.4% |
What Drove the Returns
India's growth decade (2005-2009). GDP growth of 7-9% annually. IT outsourcing exploded. The consumer economy expanded. The BSE Sensex went from 6,000 in mid-2005 to 20,000 by early 2008. The portfolio delivered +60.7% in its first invested year (2005), closely tracking the Sensex's +57.0%.
2008-2009: crisis resilience. The portfolio returned +7.8% while the Sensex fell 7.4%. Then +51.4% in the recovery year vs the Sensex's +12.6%. That +38.8% excess in 2009 is the best single-year outperformance in the dataset.
The Modi rally (2013-2014). +36.3% and +39.8%. The Sensex was up +25.9% and +10.1%. India's reform expectations drove a massive re-rating. Companies with strong operational efficiency were the primary beneficiaries, delivering +10.4% and +29.7% excess.
COVID and recovery (2020-2023). +60.9% in 2020 (Sensex +53.3%), then steady outperformance: +20.8% vs +12.1% in 2022, +44.1% vs +22.3% in 2023. India's digital economy acceleration, combined with structural reforms, powered quality companies.
The 2019 drawdown. -26.8% while the Sensex returned -16.0%. India's NBFC credit crisis, slowing corporate earnings, and emerging market outflows hit working capital efficient stocks harder than the broad index, with -10.8% excess.
Cash Periods
From 2000 through 2004, the portfolio held cash. Too few Indian large-caps with FMP financial data qualified to build a portfolio of 10 stocks. The Indian market was smaller then, fewer companies met the size threshold, and FMP's early India coverage was thinner.
5 of 25 periods (20%) were cash periods, all concentrated at the start. From 2005 onward, the portfolio was always invested.
This hurts the results in bull markets: the portfolio sat in cash during the Sensex's +53.6% in 2003 and +35.2% in 2004. But it also avoided the 2000-2001 declines. The results from 2005-2025 (20 continuous invested years) stand on their own.
Run It Yourself
# Live screen (current India stocks)
python3 working-capital/screen.py --preset india

# Historical backtest
python3 working-capital/backtest.py --preset india --output results/india.json --verbose
Limitations
Volatility is high. 23.32% annualized volatility. Max drawdown of -26.83%. The 2019 drawdown of -26.8% happened in a single year. This strategy required holding through significant drawdowns, though the max drawdown was actually shallower than the Sensex's -29.02%.
Five cash periods reduce invested history. The 2000-2004 cash position means the backtest only captures India returns from 2005. The strategy missed the Sensex's +53.6% in 2003 and +35.2% in 2004. The CAGR reflects these missed years.
Excess is moderate vs the local index. The +2.88% annual excess vs Sensex is meaningful but not dramatic. The Sensex itself returned 12.32% CAGR, so the strategy's 15.20% represents incremental alpha on top of a strong base market.
Point-in-time data limitations. FMP data for India before 2005 is thinner than for post-2010. Early annual returns carry higher data uncertainty.
Part of a Series
- Working Capital Efficiency in the US (flagship, full methodology)
- Working Capital Efficiency in Canada (lowest drawdown)
- Working Capital Efficiency in Sweden
- 15-Exchange Global Comparison
Data: Ceta Research (FMP financial data warehouse), BSE+NSE, 2000-2025. Returns in INR, benchmarked against Sensex. Full methodology: METHODOLOGY.md


