EV/EBITDA
EV/EBITDA Sector Discount on US Stocks: 25 Years of Data
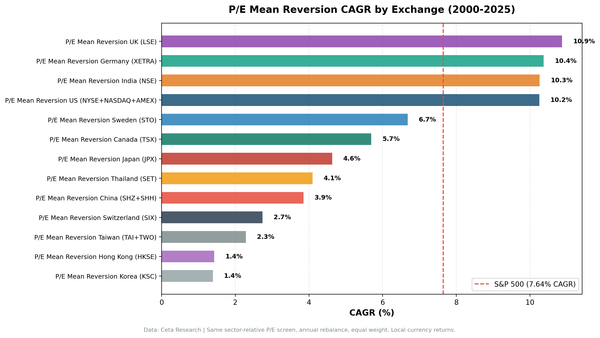
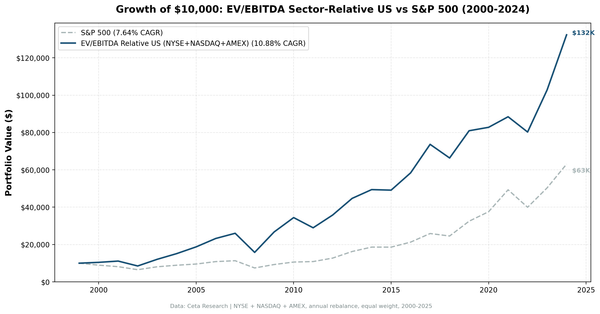
We tested a sector-relative EV/EBITDA screen on 25 years of US stock data. When a profitable company's EV/EBITDA falls 30%+ below its sector peers, it tends to mean-revert. 10.88% CAGR vs 7.64% for the S&P 500, with 73.0% down capture and zero cash periods across 25 years.