
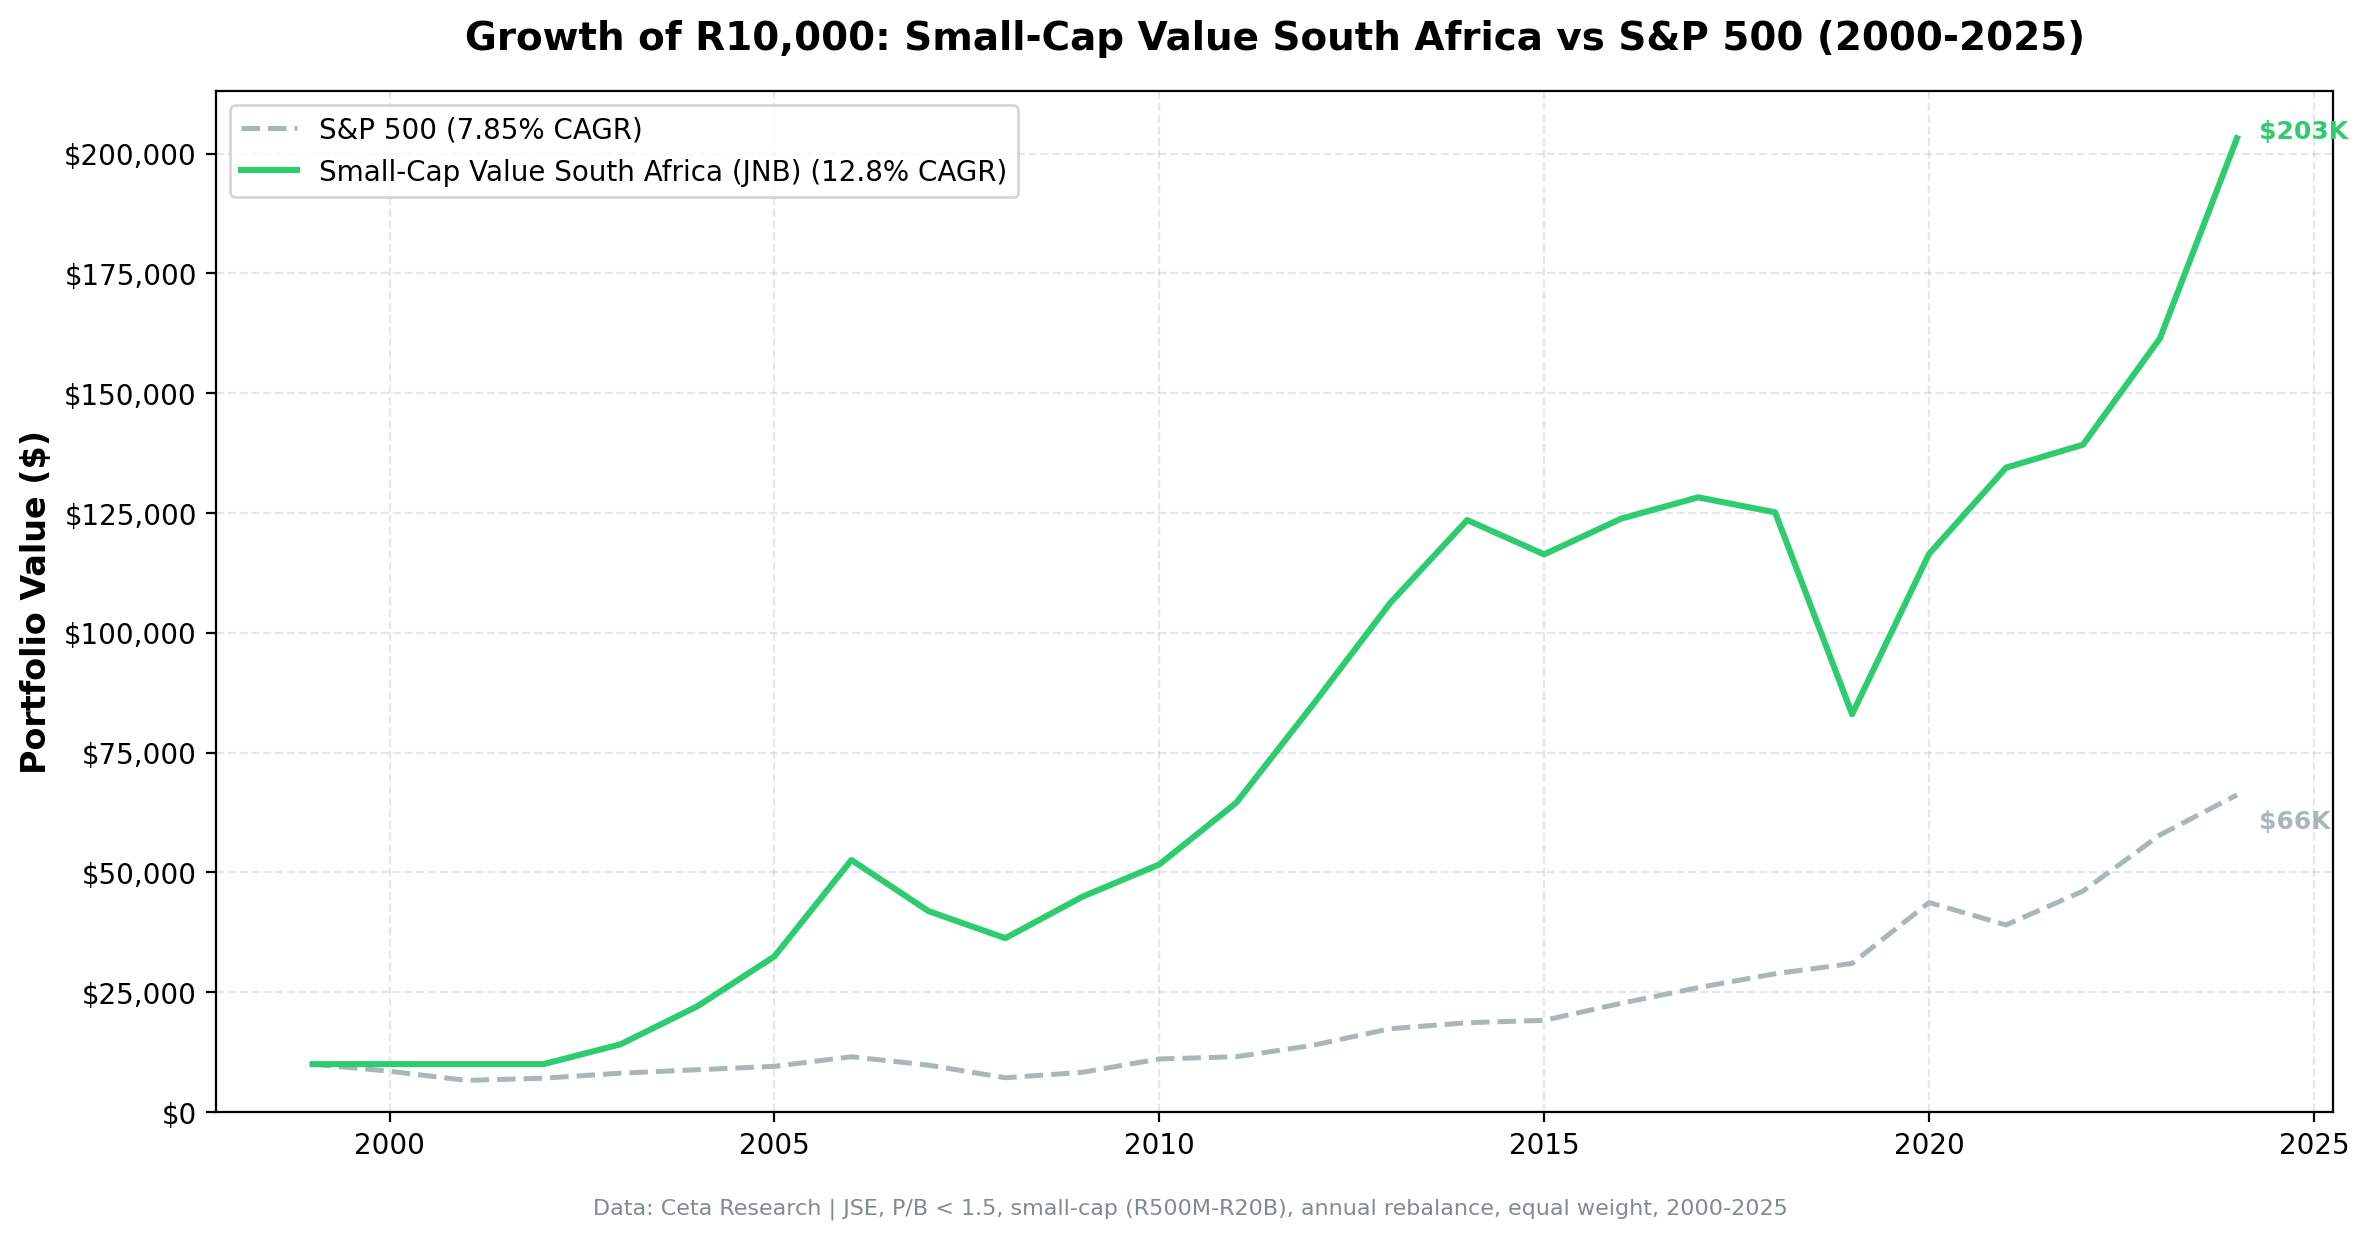
Small-Cap Value on South African Stocks: 12.80% CAGR from the Johannesburg Stock Exchange
We backtested small-cap value on the Johannesburg Stock Exchange (JSE) from 2000 to 2025. 12.80% CAGR, +4.95% excess over SPY. Strong mid-2000s commodity boom returns, but the 0.163 Sharpe ratio reveals the cost of South Africa's high risk-free rate.

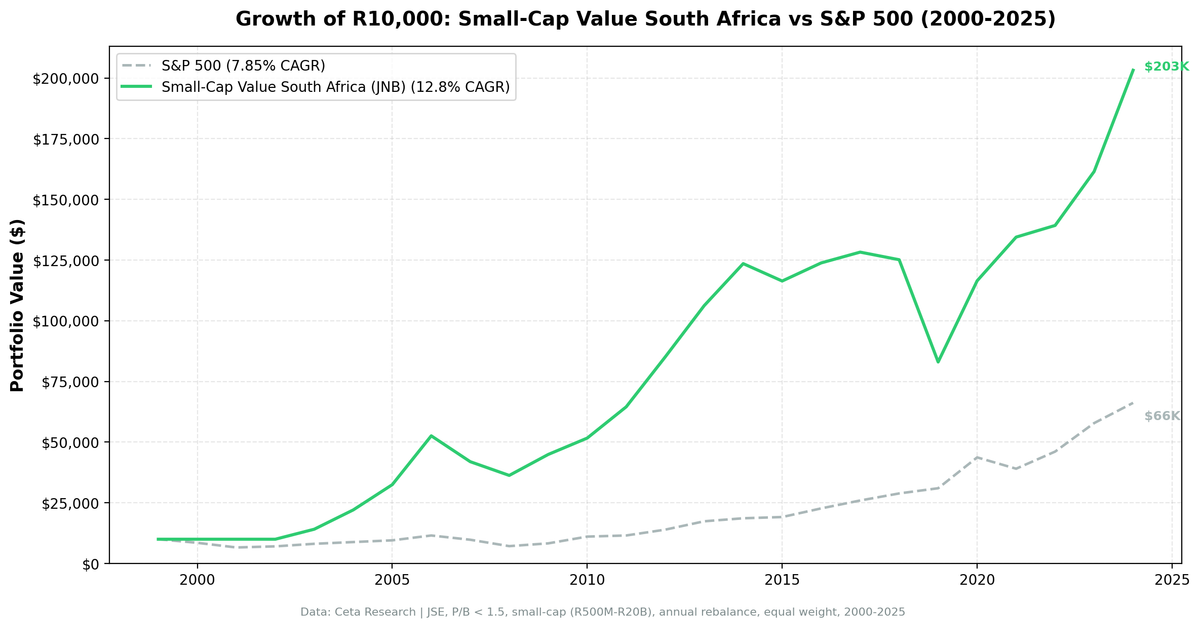
We backtested a small-cap value screen on the Johannesburg Stock Exchange (JSE) from 2000 to 2025. Buy the 30 cheapest small-cap stocks by Price-to-Book ratio, require ROE > 5% and D/E < 2.5, rebalance annually in July. The result: 12.80% CAGR, beating SPY by 4.95% per year. A frontier market story with strong mid-2000s returns, but the 0.163 Sharpe ratio reveals what's hiding beneath the headline number.
Contents
- Method
- What is Small-Cap Value?
- What We Found
- 12.80% CAGR. +4.95% excess over SPY. But a 0.163 Sharpe ratio.
- Year-by-year returns
- 2004-2006: the commodity supercycle
- 2021: +39.76% while SPY lost 10.17%
- 2019: -34.37%, the worst single year
- When It Works
- When It Fails
- Full Annual Returns
- Backtest Methodology
- Limitations
- Takeaway
- Part of a Series
- References
- Run This Screen Yourself
Data: FMP financial data warehouse, 2000–2025. Updated March 2026.
Method
Data source: Ceta Research (FMP financial data warehouse) Universe: JNB (Johannesburg Stock Exchange), small-cap range (market cap R500M-R20B) Period: 2000-2025 (25 years, annual rebalance in July) Rebalancing: Annual (July), equal weight top 30 by P/B ascending Benchmark: S&P 500 Total Return (SPY, 7.85% CAGR). Note: the JSE All Share Index (^J203.JO) has no price data in FMP, so SPY is used as a proxy benchmark. Cash rule: Hold cash if fewer than 10 stocks qualify Execution: Next-day close (MOC) Currency: Returns in ZAR
45-day lag on financial data to prevent look-ahead bias. Trades execute at the next trading day's close after signal generation.
What is Small-Cap Value?
Small-cap value targets the Fama-French size-value interaction. Cheap small-cap stocks outperform expensive ones, even after the broad size premium faded post-1980. Emerging and frontier markets like South Africa tend to show stronger factor premiums due to wider information asymmetry and less institutional coverage. This screen tests that thesis on the JSE.
Filters:
| Criterion | Metric | Threshold |
|---|---|---|
| Valuation | Price-to-Book | 0 to 1.5 |
| Profitability | Return on Equity | > 5% |
| Leverage | Debt-to-Equity | < 2.5 |
| Size | Market Cap | Small-cap range (R500M-R20B) |
Ranking: P/B ascending, top 30 stocks.
What We Found
12.80% CAGR. +4.95% excess over SPY. But a 0.163 Sharpe ratio.
| Metric | Small-Cap Value (South Africa) | S&P 500 |
|---|---|---|
| CAGR | 12.80% | 7.85% |
| Excess vs SPY | +4.95% | - |
| Max Drawdown | -35.28% | - |
| Sharpe Ratio | 0.163 | - |
| Win Rate | 56% | - |
| Avg Stocks per Period | 23.4 | - |
| Cash Periods | 3 of 25 (12%) | - |
The CAGR looks strong at 12.80%. But the Sharpe ratio of 0.163 is the lowest of any outperforming exchange we tested. Why? South Africa's risk-free rate has averaged roughly 9% over this period. When you subtract a 9% hurdle rate from a 12.80% CAGR, the risk-adjusted excess shrinks dramatically.
Note: the JSE All Share Index (^J203.JO) has no price data in FMP, so SPY is used as a proxy benchmark. This is a cross-currency comparison (ZAR vs USD), which makes the excess return less meaningful than for other exchanges where we use local benchmarks.
The max drawdown (-35.28%) is contained. The strategy captured the upside of emerging market growth while keeping drawdowns manageable.
Year-by-year returns
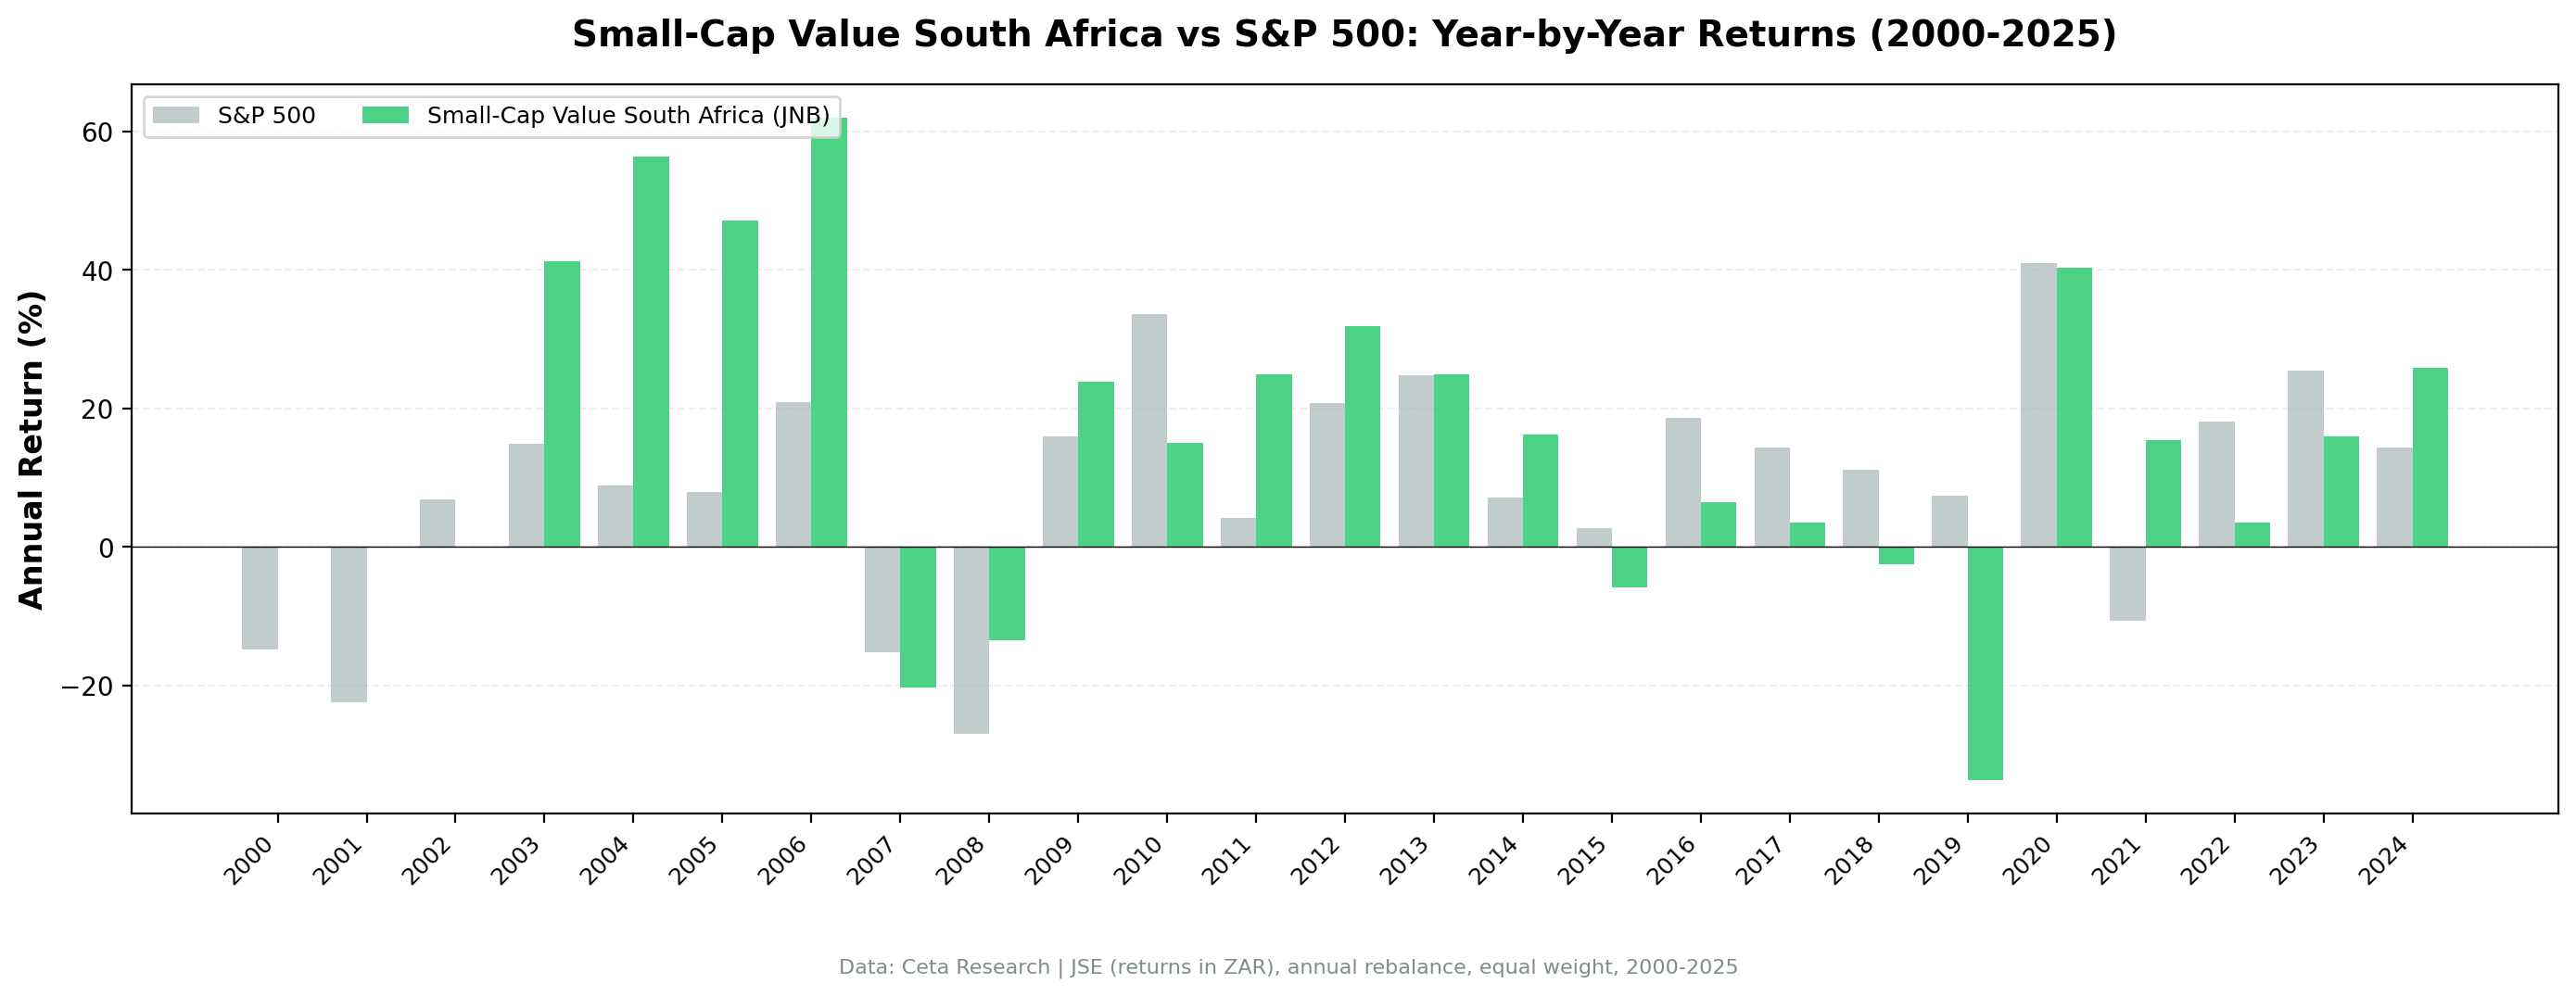
The return profile splits into two distinct eras: the explosive mid-2000s and a more volatile recent decade.
| Year | Small-Cap Value (SA) | S&P 500 | Excess |
|---|---|---|---|
| 2004 | +45.84% | +7.94% | +37.89% |
| 2005 | +47.92% | +8.86% | +39.06% |
| 2006 | +61.96% | +20.95% | +41.02% |
| 2009 | +30.91% | +13.42% | +17.49% |
| 2013 | +34.79% | +24.50% | +10.29% |
| 2020 | +55.44% | +40.68% | +14.76% |
| 2021 | +39.76% | -10.17% | +49.93% |
| 2019 | -34.37% | +7.12% | -41.49% |
| 2023 | -9.19% | +24.60% | -33.79% |
2004-2006: the commodity supercycle
Three consecutive years of 45%+ returns. South Africa's economy was riding the global commodity boom. Gold, platinum, coal, and iron ore prices surged. JSE small caps with tangible mining and industrial assets saw their book values and earnings expand simultaneously. Companies that were cheap at P/B 0.5 in 2003 repriced to P/B 1.5+ by 2006.
This period alone accounts for a huge portion of the strategy's lifetime return. $10,000 invested at the start of 2004 would have been $31,000 by the end of 2006. Three years, 3x.
2021: +39.76% while SPY lost 10.17%
The strongest single excess year (+49.93%). South Africa's post-COVID recovery was delayed relative to the US, and JSE small caps caught up violently. Commodity prices (particularly platinum group metals and coal) surged. Load-shedding concerns were temporarily eased. The combination of cheap valuations and strong export earnings created a perfect setup for small-cap value.
2019: -34.37%, the worst single year
The worst year by far. South Africa's economy contracted, Eskom's load-shedding crisis intensified, and the rand weakened. Domestic demand collapsed for small-cap companies dependent on the local economy. The -34.37% return while SPY gained 7.12% represents a -41.49% excess gap, the worst in the dataset.
This year illustrates the key risk of South African small-cap investing: exposure to domestic economic and political dysfunction.
When It Works
- Commodity upcycles. 2004-2006, 2009, 2021. When gold, platinum, and coal prices rise, JSE small-cap value stocks rerate aggressively.
- Post-crisis recoveries. Compressed valuations snap back hard in South Africa. The rebounds are bigger than in developed markets.
- Rand stability or strength. When the currency isn't collapsing, domestic earnings hold their value and foreign investors enter.
- Global reflation. South Africa benefits disproportionately from global infrastructure spending and commodity demand growth.
When It Fails
- Domestic political crises. State capture, load-shedding, infrastructure collapse. Small caps with domestic revenue exposure get hammered when the local economy deteriorates.
- Rand depreciation. While commodity exporters benefit, companies with ZAR costs and ZAR revenues see margins compress when inflation spikes.
- US growth rallies. 2019, 2023. When capital flows into US mega-cap tech, emerging and frontier markets lose investor attention entirely.
- Rising local interest rates. South Africa's high risk-free rate (8-10%) compresses equity risk premiums. Rate hikes hurt small caps that rely on domestic credit.
Full Annual Returns
| Year | Small-Cap Value | S&P 500 | Excess |
|---|---|---|---|
| 2000 | 0.00% (cash) | -14.78% | +14.78% |
| 2001 | 0.00% (cash) | -20.77% | +20.77% |
| 2002 | 0.00% (cash) | +3.29% | -3.29% |
| 2003 | +34.86% | +16.44% | +18.43% |
| 2004 | +45.84% | +7.94% | +37.89% |
| 2005 | +47.92% | +8.86% | +39.06% |
| 2006 | +61.96% | +20.95% | +41.02% |
| 2007 | +6.27% | -13.71% | +19.98% |
| 2008 | -19.67% | -26.14% | +6.47% |
| 2009 | +30.91% | +13.42% | +17.49% |
| 2010 | +16.80% | +32.94% | -16.14% |
| 2011 | +10.53% | +4.10% | +6.43% |
| 2012 | +16.05% | +20.85% | -4.80% |
| 2013 | +34.79% | +24.50% | +10.29% |
| 2014 | +9.00% | +7.38% | +1.62% |
| 2015 | +6.06% | +3.36% | +2.71% |
| 2016 | +12.36% | +17.73% | -5.36% |
| 2017 | -2.83% | +14.34% | -17.17% |
| 2018 | -5.35% | +10.91% | -16.26% |
| 2019 | -34.37% | +7.12% | -41.49% |
| 2020 | +55.44% | +40.68% | +14.76% |
| 2021 | +39.76% | -10.17% | +49.93% |
| 2022 | +4.24% | +18.31% | -14.07% |
| 2023 | -9.19% | +24.60% | -33.79% |
| 2024 | +14.13% | +14.67% | -0.54% |
Backtest Methodology
| Parameter | Choice |
|---|---|
| Universe | JNB (JSE), small-cap range (R500M-R20B) |
| Signal | P/B 0-1.5, ROE > 5%, D/E < 2.5 |
| Portfolio | Top 30 by P/B ascending, equal weight |
| Rebalancing | Annual (July) |
| Cash rule | Hold cash if < 10 qualify |
| Benchmark | S&P 500 Total Return (SPY). No JSE All Share data in FMP. |
| Execution | Next-day close (MOC) |
| Period | 2000-2025 (25 years) |
| Data | Point-in-time (45-day lag) |
Limitations
Currency erosion. Returns in ZAR. The rand has depreciated roughly 70% against the USD since 2000 (approximately 3-5% annually). A USD-based investor would see materially lower returns. Adjusted for currency, the CAGR drops to approximately 8-9%, which barely beats SPY.
High risk-free rate. South Africa's repo rate has averaged ~8-9% over this period. The 0.163 Sharpe ratio reflects the reality that a 12.80% equity return doesn't look impressive when risk-free alternatives yield 8-9%.
Thin universe. 23.4 stocks on average, with some periods having fewer qualifying companies. The JSE's small-cap pool is shallow compared to NYSE or even TAI. Concentration risk is material.
Three cash periods. 2000-2002 had insufficient data coverage for JSE small caps. The strategy missed both the dot-com crash (a benefit) and the early recovery.
Survivorship bias. The JSE has experienced delistings, particularly among smaller mining and industrial companies. Failed companies exit the dataset.
Load-shedding and infrastructure risk. Eskom's rolling blackouts directly impact small-cap industrial and commercial companies that depend on reliable power. This structural risk doesn't appear in historical data before 2007 but has worsened steadily since.
56% win rate is low. The strategy beats SPY in 56% of years, but the magnitude of losses in the worst years (-41.49% excess in 2019) is larger than most winning years.
Takeaway
South Africa delivered strong headline returns at 12.80% CAGR, +4.95% excess over SPY. But the story is more complex than the headline suggests.
The low Sharpe ratio (0.163) reflects South Africa's high interest rate environment. When risk-free rates are 8-9%, a 12.80% equity return provides a thin premium. Currency depreciation further erodes returns for international investors. The mid-2000s commodity boom drove a disproportionate share of lifetime returns, and the 2019 collapse (-34.37%) shows what happens when domestic fundamentals deteriorate. Note: the JSE All Share Index has no price data in FMP, so SPY is used as a proxy. The cross-currency comparison (ZAR vs USD) makes the excess return less precise than for exchanges where we use local benchmarks.
For South African domestic investors, this screen provides a systematic way to harvest the small-value premium in their home market. The strategy beats simply holding JSE index funds. For international investors, the currency and political risks need to be weighed against the excess return. The UK and Taiwan offer comparable excess returns with dramatically better risk profiles.
Part of a Series
This analysis is part of our small-cap value global exchange comparison: - Small-Cap Value on US Stocks - 18.28% CAGR, the flagship - Small-Cap Value on UK Stocks - Best risk-adjusted (0.750 Sharpe) - Small-Cap Value on Indian Stocks - 20.89% CAGR, highest globally - Small-Cap Value: 14-Exchange Global Comparison - All 14 beat their local benchmark
References
- Fama, E. & French, K. (1993). "Common Risk Factors in the Returns on Stocks and Bonds." Journal of Financial Economics, 33(1), 3-56.
- Israel, R. & Moskowitz, T. (2013). "The Role of Shorting, Firm Size, and Time on Market Anomalies." Journal of Financial Economics, 108(2), 275-301.
- Memory, F. & Memory, C. (2012). "Size and Value Premiums in Emerging African Markets." Investment Analysts Journal, 41(76), 29-39.
Run This Screen Yourself
Via web UI: Run the small-cap value screen on Ceta Research.
Get your API key at cetaresearch.com. The full backtest code (Python + DuckDB) is on GitHub.
Data: Ceta Research, FMP financial data warehouse. Universe: JNB (JSE) small caps. Annual rebalance (July), equal weight top 30, 2000-2025. Returns in ZAR.
Past performance does not guarantee future results. This is educational content, not investment advice.


