
Sector-Adjusted Momentum on US: 6.20% CAGR — Why Removing Sector

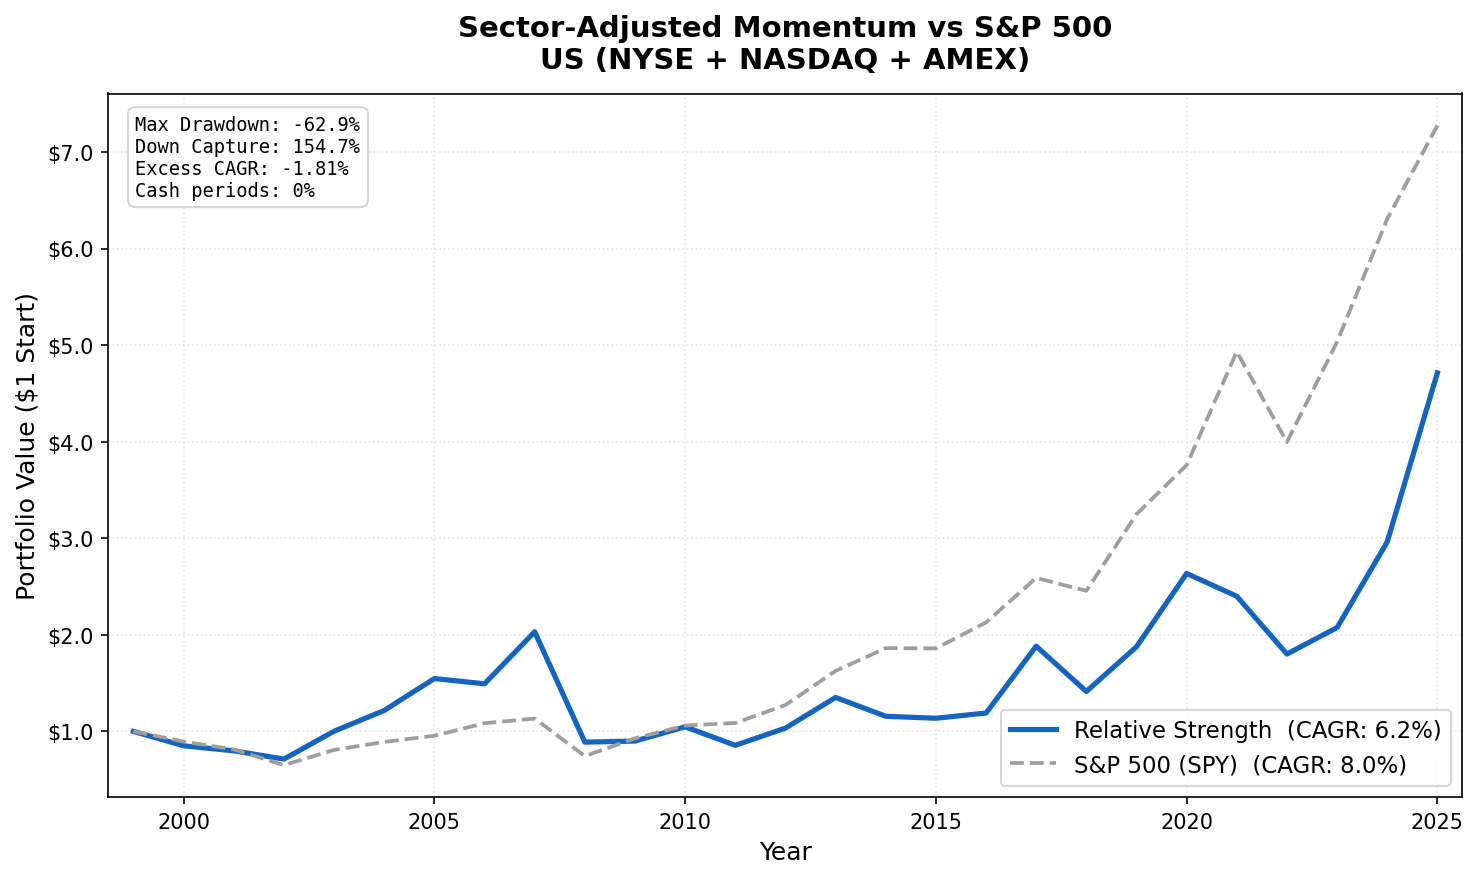
We backtested the Sector-Adjusted Momentum strategy on US stocks (NYSE, NASDAQ, AMEX) from 2000 to 2025. The strategy buys stocks outperforming their own sector peers, stripping out sector-level trends to isolate company-specific momentum. The result: 6.20% annually versus the market's 8.01%. That's a 1.81 percentage point annual shortfall, compounding to a significant gap over 25 years.
Contents
- Method
- Performance
- Why It Underperforms in the US
- Comparison to Raw Momentum in the US
- The Current Screen
- By the Numbers
- Academic Basis
The US is the most interesting case in a 14-exchange study. Zero cash periods, 29.7 average stocks, 8.5 average active sectors, the signal fires every quarter without fail. But it underperforms consistently. This page explains why, and what it means for momentum investors.
Method
- Data source: Ceta Research (FMP financial data warehouse)
- Universe: NYSE + NASDAQ + AMEX stocks, market cap > $1B USD
- Period: 2000–2025 (25 years, 103 quarterly periods)
- Rebalancing: Quarterly (January, April, July, October), equal weight
- Benchmark: S&P 500 Total Return (SPY), 8.01% CAGR over this period
- Transaction costs: 0.1% one-way (large-cap tier for US market)
- Cash rule: Hold cash if fewer than 10 stocks qualify at a rebalance date
Signal construction: 1. Compute each stock's 12-month return, skipping the most recent month (12M-1M per Jegadeesh & Titman 1993) 2. Compute the equal-weighted sector average across qualifying US stocks 3. Relative strength = stock return minus sector average return 4. Buy top 30 by relative strength, equal weight
Data quality guards: Minimum price $1.00, maximum raw signal 500% (filters split-adjustment artifacts), maximum single-period return 200%.
Zero of 103 quarters were cash periods. The US has the largest, deepest equity market in the dataset.
Performance

| Metric | Strategy | SPY |
|---|---|---|
| CAGR (2000–2025) | 6.20% | 8.01% |
| Excess CAGR | -1.81% | — |
| Sharpe Ratio | 0.144 | 0.354 |
| Max Drawdown | -62.89% | — |
| Down Capture | 154.7% | 100% |
| Cash Periods | 0/103 (0%) | — |
| Avg Stocks Held | 29.7 | — |
| Avg Active Sectors | 8.5 | — |
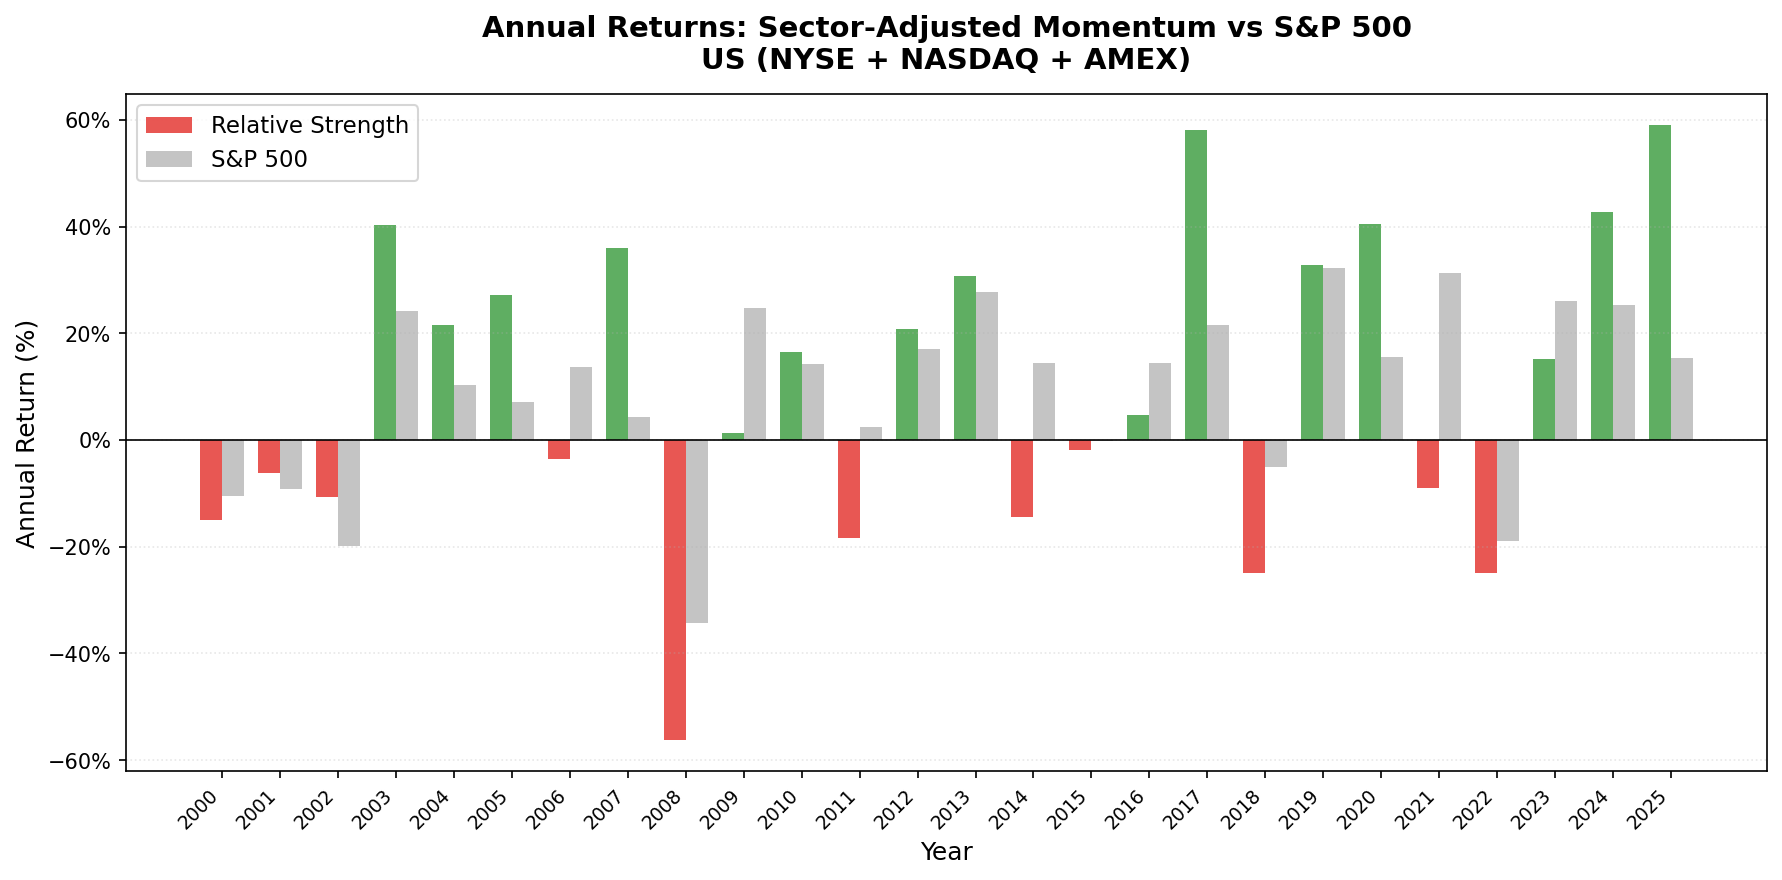
The down capture of 154.7% is the most striking number. During quarters when the S&P 500 fell, this portfolio fell harder, absorbing one and a half times the market's bear market losses. This is the momentum crash problem: stocks that had been strongly outperforming their sectors tend to get hit disproportionately in sharp market-wide selloffs.
Why It Underperforms in the US
The result is counterintuitive: better signal construction produces worse results. The reason is that the Moskowitz-Grinblatt finding cuts both ways.
Their 1999 paper showed that about half of US momentum profits come from sector-level trends. If you run a raw 12-month momentum strategy in the US, roughly half your alpha comes from rotating into hot sectors. The other half comes from picking winners within sectors. Both halves are profitable.
The RS strategy strips out the sector half. You're left with only the company-specific momentum. In the world's most efficient equity market, the company-specific component alone isn't strong enough to overcome market friction. The sector component turns out to be the more reliable source of momentum alpha in US markets, not noise to be removed, but signal in its own right.
The 154.7% down capture confirms this. When sectors fall, the stocks that had been outperforming their sector peers fall hardest. Raw momentum crashes are well-documented. Sector-adjusted momentum doesn't fix that problem, in the US, it makes it slightly worse, because the stocks selected have the most sector-adjusted momentum but not necessarily the strongest absolute momentum.
This is the Moskowitz-Grinblatt finding in reverse: their decomposition showed that stripping industry effects leaves real momentum profits. In a more efficient, more covered market with 2025-era information speeds, the industry component has become the stronger signal. Removing it removes real alpha.
Comparison to Raw Momentum in the US
The US raw 12-month momentum strategy (buying top decile by 12M-1M return, equal weight) consistently delivers 10–12% CAGR in academic research using similar periods. The sector adjustment reduces that by removing the sector component. The result confirms: in the US, sector momentum contributes more to overall momentum profits than it subtracts through concentration risk.
For US investors who want a momentum exposure, raw momentum or risk-adjusted momentum outperforms sector-adjusted momentum. The sector adjustment is most valuable in emerging markets and mid-sized developed markets (Germany, UK, Canada) where sector effects are less dominant.
The Current Screen
Despite the backtest underperformance, the screen identifies US stocks with the strongest company-specific momentum, stocks winning within their sectors. This is useful context even if the portfolio-level alpha is negative.
WITH universe AS (
    SELECT p.symbol, p.companyName, p.exchange, p.sector,
           k.marketCap / 1e9 AS market_cap_billions
    FROM profile p
    JOIN key_metrics_ttm k ON p.symbol = k.symbol
    WHERE k.marketCap > 1000000000           -- $1B USD
      AND p.isActivelyTrading = true
      AND p.sector IS NOT NULL AND p.sector != ''
      AND p.exchange IN ('NYSE', 'NASDAQ', 'AMEX')
),
price_1m_ago AS (
    SELECT symbol, adjClose AS price_1m,
           ROW_NUMBER() OVER (PARTITION BY symbol
               ORDER BY ABS(CAST(dateEpoch AS BIGINT) -
                   CAST(EXTRACT(EPOCH FROM (CURRENT_DATE - INTERVAL '30' DAY))::BIGINT AS BIGINT))
           ) AS rn
    FROM stock_eod
    WHERE date BETWEEN CURRENT_DATE - INTERVAL '45' DAY AND CURRENT_DATE - INTERVAL '15' DAY
      AND adjClose > 1.0
),
price_12m_ago AS (
    SELECT symbol, adjClose AS price_12m,
           ROW_NUMBER() OVER (PARTITION BY symbol
               ORDER BY ABS(CAST(dateEpoch AS BIGINT) -
                   CAST(EXTRACT(EPOCH FROM (CURRENT_DATE - INTERVAL '365' DAY))::BIGINT AS BIGINT))
           ) AS rn
    FROM stock_eod
    WHERE date BETWEEN CURRENT_DATE - INTERVAL '395' DAY AND CURRENT_DATE - INTERVAL '335' DAY
      AND adjClose > 1.0
),
raw_momentum AS (
    SELECT u.symbol, u.companyName, u.exchange, u.sector, u.market_cap_billions,
           ROUND((p1m.price_1m - p12.price_12m) / p12.price_12m * 100, 1) AS raw_mom_pct
    FROM universe u
    JOIN price_12m_ago p12 ON u.symbol = p12.symbol AND p12.rn = 1
    JOIN price_1m_ago p1m  ON u.symbol = p1m.symbol  AND p1m.rn = 1
    WHERE p12.price_12m > 1.0 AND p1m.price_1m > 1.0
),
sector_avg AS (
    SELECT sector, COUNT(*) AS sector_count, AVG(raw_mom_pct) AS sector_avg_mom
    FROM raw_momentum
    GROUP BY sector
    HAVING COUNT(*) >= 5
)
SELECT m.symbol, m.companyName, m.exchange, m.sector,
       ROUND(m.market_cap_billions, 2) AS market_cap_billions,
       m.raw_mom_pct,
       ROUND(s.sector_avg_mom, 1) AS sector_avg_pct,
       ROUND(m.raw_mom_pct - s.sector_avg_mom, 1) AS relative_strength_pct,
       s.sector_count
FROM raw_momentum m
JOIN sector_avg s ON m.sector = s.sector
ORDER BY relative_strength_pct DESC
LIMIT 30
Run it on the Ceta Research Data Explorer.
By the Numbers
- Period: 2000–2025 (25 years, 103 quarterly periods)
- Strategy CAGR: 6.20%
- SPY benchmark CAGR: 8.01%
- Excess CAGR: -1.81%
- Sharpe ratio: 0.144
- Max drawdown: -62.89%
- Down capture: 154.7% (absorbed 154.7% of S&P 500 bear market losses)
- Cash periods: 0 of 103 (0%)
- Average stocks held: 29.7 of 30 target
- Average active sectors: 8.5
Academic Basis
Moskowitz, T. & Grinblatt, M. (1999). "Do Industries Explain Momentum?" Journal of Finance, 54(4), 1249-1290. The paper that established industry momentum as roughly half of total momentum profits in US markets. The RS strategy's underperformance in the US is a direct consequence of this finding.
Jegadeesh, N. & Titman, S. (1993). "Returns to Buying Winners and Selling Losers." Journal of Finance, 48(1), 65-91. The foundational momentum paper. Established the 12M skip-1M lookback to avoid short-term reversal contamination.
Data: Ceta Research (FMP financial data warehouse). Backtest period 2000–2025 on NYSE, NASDAQ, AMEX.


