
Quality at Reasonable Price: A Seven-Factor Screen Tested on 25 Years of US Stock Data

We built a systematic quality-value screen using seven quantitative criteria and backtested it across all US exchanges (NYSE, NASDAQ, AMEX) from 2000 to 2025. QARP returned 10.42% annually vs 7.77% for the S&P 500, with zero cash periods over 25 years. The portfolio held 44 stocks on average at every rebalance. During the dot-com bust, QARP gained 15% while the market lost 35%.
Contents
- Method
- What is QARP?
- The Screens
- QARP Screen (SQL)
- What We Found
- 25 years of data. 2.65% annual alpha over the S&P 500.
- Year-by-year returns
- The dot-com era: QARP's best period
- Crisis performance
- Where QARP struggles: momentum-driven markets
- Exchange breakdown: NYSE vs NASDAQ
- Backtest Methodology
- Limitations
- Takeaway
- Part of a Series
- References
- Run This Screen Yourself
Method
Data source: Ceta Research (FMP financial data warehouse) Universe: All US exchanges (NYSE, NASDAQ, AMEX), market cap > $1B USD Period: 2000-2025 (25 years, 51 semi-annual periods) Rebalancing: Semi-annual (January, July), equal weight all qualifying Benchmark: S&P 500 Total Return (SPY) Cash rule: Hold cash if fewer than 10 stocks qualify
Piotroski F-Scores computed from raw financial statements (income statement, balance sheet, cash flow statement) at each rebalance date. No pre-computed scores. 45-day lag on financial data to prevent look-ahead bias.
What is QARP?
QARP stands for Quality at Reasonable Price. It combines Buffett's documented investment principles into a quantitative screen with seven criteria.
Quality Filters (5):
| Criterion | Metric | Threshold |
|---|---|---|
| Capital efficiency | Return on Equity | > 15% |
| Balance sheet safety | Debt-to-Equity | < 0.5 |
| Liquidity | Current Ratio | > 1.5 |
| Cash-backed earnings | Income Quality (OCF/NI) | > 1.0 |
| Fundamental health | Piotroski F-Score | >= 7 of 9 |
Valuation Filter (1):
| Criterion | Metric | Threshold |
|---|---|---|
| Reasonable price | P/E Ratio | Between 5 and 25 |
Size Filter (1):
| Criterion | Metric | Threshold |
|---|---|---|
| Institutional grade | Market Cap | > $1B USD |
Seven total criteria. Stocks must pass all seven to enter the portfolio. Equal weight, rebalanced every six months.
The Screens
QARP Screen (SQL)
SELECT
    k.symbol,
    p.companyName,
    k.returnOnEquityTTM * 100 as roe_pct,
    f.debtToEquityRatioTTM as debt_to_equity,
    k.currentRatioTTM,
    k.incomeQualityTTM,
    s.piotroskiScore,
    f.priceToEarningsRatioTTM as pe_ratio,
    k.marketCap / 1e9 as market_cap_billions
FROM key_metrics_ttm k
JOIN financial_ratios_ttm f ON k.symbol = f.symbol
JOIN scores s ON k.symbol = s.symbol
JOIN profile p ON k.symbol = p.symbol
WHERE
    k.returnOnEquityTTM > 0.15           -- ROE > 15%
    AND f.debtToEquityRatioTTM >= 0
    AND f.debtToEquityRatioTTM < 0.5     -- D/E < 0.5
    AND k.currentRatioTTM > 1.5          -- Current Ratio > 1.5
    AND k.incomeQualityTTM > 1           -- Income Quality > 1
    AND s.piotroskiScore >= 7            -- Piotroski >= 7
    AND f.priceToEarningsRatioTTM > 5    -- P/E 5-25
    AND f.priceToEarningsRatioTTM < 25
    AND k.marketCap > 1e9                -- Market cap > $1B USD
ORDER BY s.piotroskiScore DESC, k.returnOnEquityTTM DESC
Run this query on Ceta Research
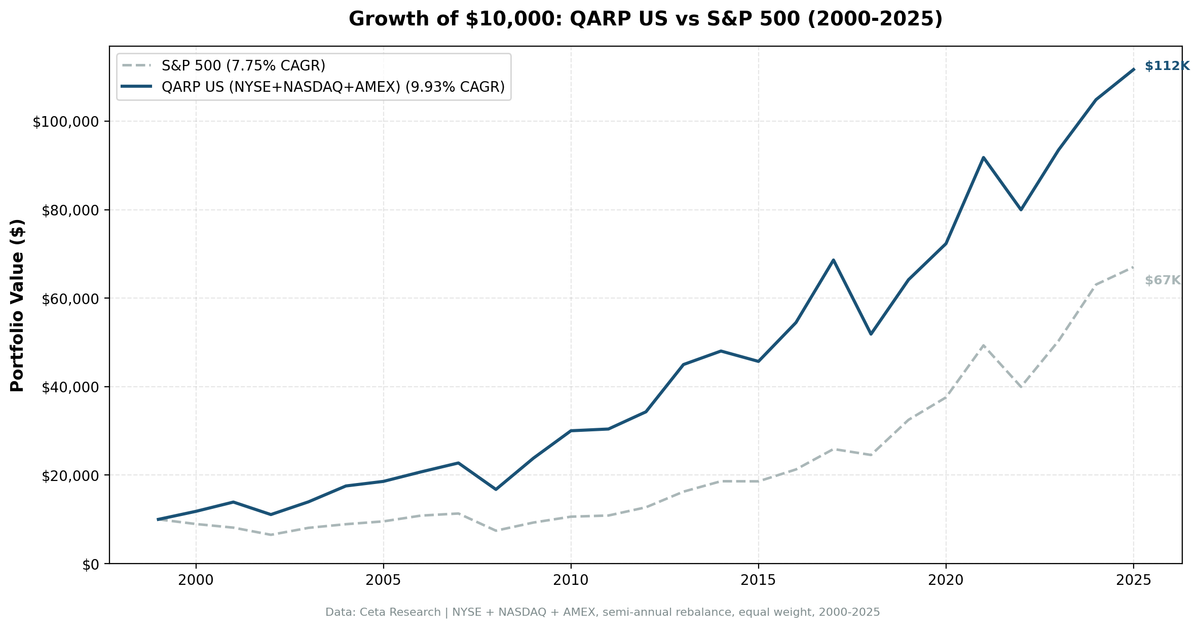
What We Found
25 years of data. 2.65% annual alpha over the S&P 500.
| Metric | QARP (US) | S&P 500 |
|---|---|---|
| CAGR | 10.42% | 7.77% |
| Total Return | 1151% | 570% |
| Volatility | 16.8% | 15.3% |
| Max Drawdown | -27.1% | -38.0% |
| Sharpe Ratio | 0.50 | 0.376 |
| Win Rate (semi-annual) | 49% | - |
| Avg Stocks per Period | 44.3 | - |
| Cash Periods | 0 of 51 | - |
QARP turned $10,000 into $125,100. The S&P 500 turned it into $67,030. The strategy was fully invested every single period, averaging 44 stocks. No cash drag.
The Sharpe ratio tells the real story: 0.50 vs 0.376. QARP delivered more return per unit of risk, with a shallower max drawdown (-27.1% vs -38.0%).
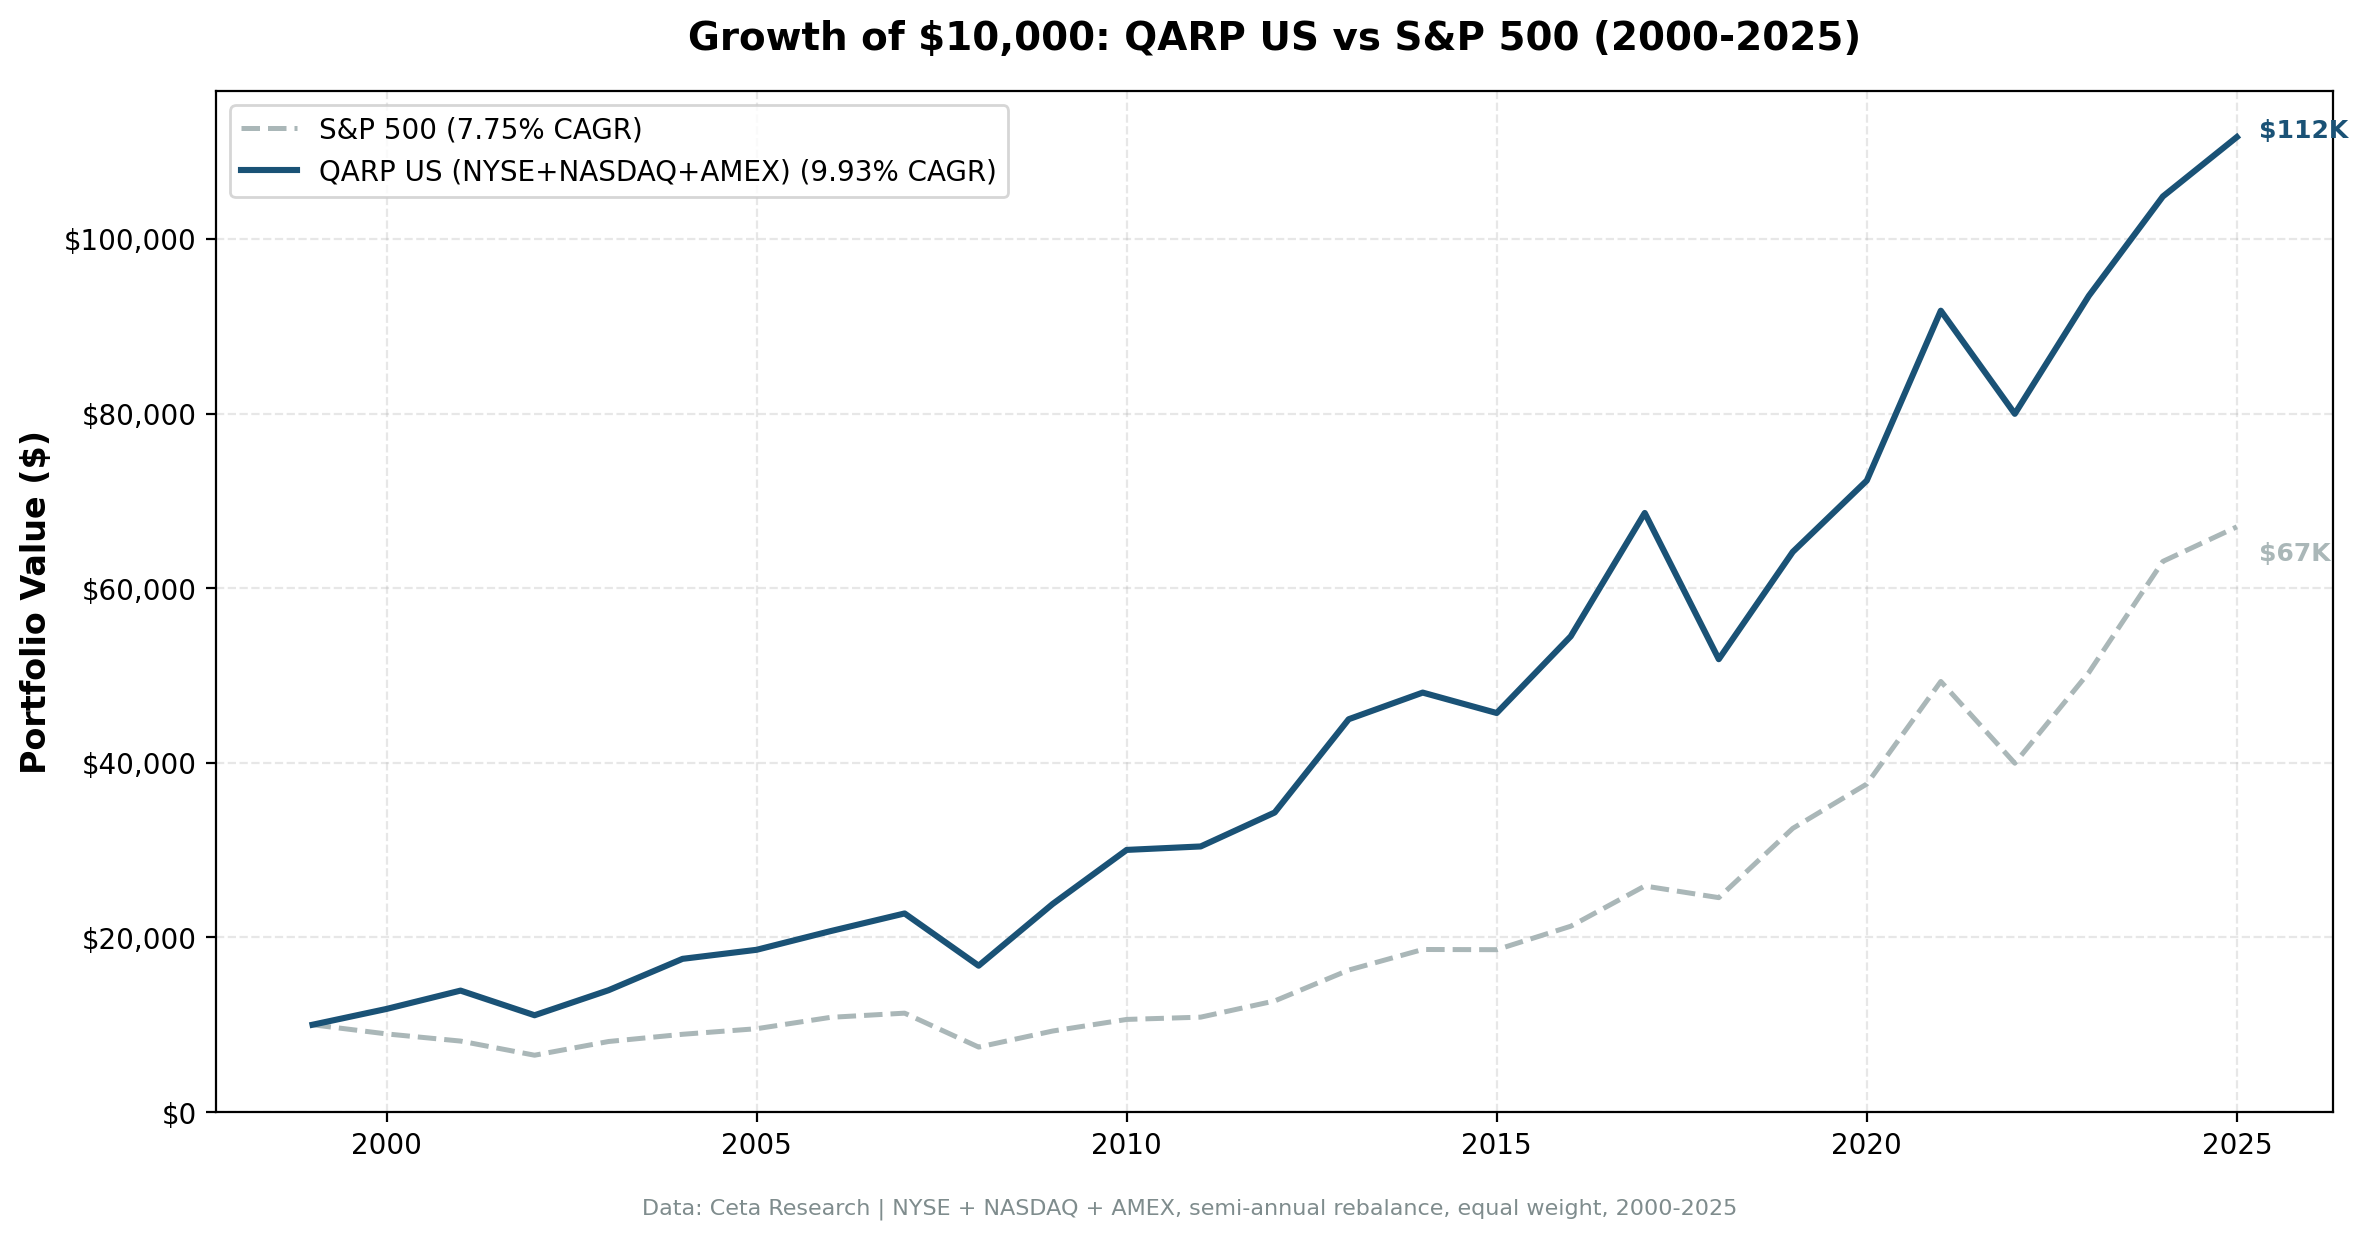
Year-by-year returns
| Year | QARP | S&P 500 | Excess |
|---|---|---|---|
| 2000 | +19.2% | -10.5% | +29.7% |
| 2001 | +17.8% | -9.2% | +26.9% |
| 2002 | -18.4% | -19.9% | +1.6% |
| 2003 | +24.6% | +24.1% | +0.5% |
| 2004 | +24.5% | +10.2% | +14.3% |
| 2005 | +5.7% | +7.2% | -1.5% |
| 2006 | +11.5% | +13.7% | -2.1% |
| 2007 | +9.8% | +4.4% | +5.3% |
| 2008 | -23.9% | -34.3% | +10.4% |
| 2009 | +47.2% | +24.7% | +22.5% |
| 2010 | +27.3% | +14.3% | +13.0% |
| 2011 | +1.3% | +2.5% | -1.2% |
| 2012 | +12.9% | +17.1% | -4.2% |
| 2013 | +31.7% | +27.8% | +4.0% |
| 2014 | +7.0% | +14.5% | -7.5% |
| 2015 | -4.8% | -0.1% | -4.7% |
| 2016 | +20.8% | +14.4% | +6.4% |
| 2017 | +25.9% | +21.6% | +4.3% |
| 2018 | -24.4% | -5.2% | -19.3% |
| 2019 | +24.7% | +32.3% | -7.6% |
| 2020 | +11.8% | +15.6% | -3.9% |
| 2021 | +27.3% | +31.3% | -4.0% |
| 2022 | -12.3% | -19.0% | +6.7% |
| 2023 | +16.9% | +26.0% | -9.1% |
| 2024 | +11.6% | +25.3% | -13.7% |
| 2025 | +6.5% | +6.8% | -0.3% |
The dot-com era: QARP's best period
| Year | QARP | S&P 500 | Excess |
|---|---|---|---|
| 2000 | +19.2% | -10.5% | +29.7% |
| 2001 | +17.8% | -9.2% | +26.9% |
| 2002 | -18.4% | -19.9% | +1.6% |
| Cumulative | +14.6% | -34.9% | +49.5% |
While the S&P 500 lost 35% over three years, QARP gained 15%. A +49.5 percentage point gap. The quality filters kept overvalued tech companies out of the portfolio entirely. The P/E cap (< 25) was the key: it excluded dot-com stocks trading at triple-digit multiples.
2004 and 2009-2010 were also strong: the screen loaded up on beaten-down quality companies after market crashes.
Crisis performance
| Event | QARP | S&P 500 | Gap |
|---|---|---|---|
| Dot-com (2000-02) | +14.6% | -34.9% | +49.5% |
| Financial Crisis (2008) | -23.9% | -34.3% | +10.4% |
| COVID (2020) | +11.8% | +15.6% | -3.9% |
| 2022 Bear | -12.3% | -19.0% | +6.7% |
QARP protected capital in every major downturn except COVID. Even then, the underperformance was small (-3.9%). The low-leverage, low-P/E bias acts as a natural hedge during fear-driven sell-offs.
Where QARP struggles: momentum-driven markets
2018-2024 was tough. QARP lagged the S&P 500 in 5 of 7 years. The culprit: growth stocks with P/E ratios above 25 drove most of the market's gains. NVIDIA, Microsoft, Apple, Amazon all failed QARP's valuation filter during their biggest runs.
This isn't a bug. It's the strategy's design. QARP will always miss parabolic growth stocks. The tradeoff is less drawdown during corrections.
Exchange breakdown: NYSE vs NASDAQ
QARP works much better on NYSE than NASDAQ:
| Exchange | CAGR | Excess | Avg Stocks | Cash |
|---|---|---|---|---|
| NYSE | 9.19% | +1.44% | 29.3 | 1/50 |
| NASDAQ | 6.09% | -1.66% | 19.4 | 13/50 |
| Combined (US_MAJOR) | 10.42% | +2.65% | 44.3 | 0/51 |
NASDAQ-listed companies tend to be growth-oriented with higher P/E ratios and more leverage. The QARP filters systematically exclude them. NYSE stocks (more industrials, healthcare, consumer staples) pass at higher rates. Combining both exchanges gives the best result: zero cash periods and the highest alpha.
Backtest Methodology
| Parameter | Choice |
|---|---|
| Universe | NYSE + NASDAQ + AMEX, Market Cap > $1B USD |
| Signal | Piotroski >= 7, ROE > 15%, D/E < 0.5, CR > 1.5, IQ > 1.0, P/E 5-25 |
| Portfolio | All qualifying, equal weight |
| Rebalancing | Semi-annual (January, July) |
| Cash rule | Hold cash if < 10 qualify |
| Benchmark | S&P 500 Total Return (SPY) |
| Period | 2000-2025 (25 years, 51 periods) |
| Data | Point-in-time (45-day lag for financial statements) |
Limitations
Recent underperformance. QARP trailed the S&P 500 in 5 of the last 7 years (2018-2024). Growth-dominated markets are QARP's weakness. The strategy requires patience through these cycles.
Concentrated sectors. The screen doesn't balance sectors. Some periods skew heavily toward industrials or healthcare. Single-sector risk exists.
Low leverage bias. The D/E < 0.5 filter excludes airlines, REITs, and most financials. These sectors can generate strong returns but fail QARP's balance sheet test.
Piotroski Signal 7 approximation. We use totalStockholdersEquity as a proxy for share dilution since shares outstanding isn't reliably available in the data. Equity can increase from retained earnings (good) or new issuance (bad). Imperfect but standard.
Survivorship bias. Exchange membership uses current profiles, not historical. IPOs and delistings aren't tracked over time.
Transaction costs not included in published results. The backtest framework supports size-tiered transaction costs (0.1-0.5% one-way based on market cap), but published QARP results use the no-cost baseline for comparability with academic literature. With semi-annual rebalancing and 30-50 large-cap stocks, cost drag is approximately 0.2-0.4% annually.
Takeaway
The QARP screen works on US stocks. 10.42% CAGR over 25 years, 2.65% alpha above the S&P 500, zero cash periods. The best feature isn't the raw return. It's the drawdown protection: -27.1% max drawdown vs -38.0% for the benchmark.
The strategy's edge is structural. Quality filters avoid companies that blow up. Valuation filters avoid paying too much for the ones that don't. Combined, they produce a portfolio that captures most of the market's upside while cutting a meaningful chunk of the downside.
The cost is clear: you'll miss growth rallies. 2018-2024 was a stretch of underperformance, and the next growth cycle will produce another one. QARP is a strategy for investors who can hold through those periods. The 25-year track record suggests the math eventually works in your favor.
Part of a Series
This analysis is part of our QARP global exchange comparison. We tested the same seven-factor screen on 12 exchanges worldwide: - QARP on Indian Stocks (BSE + NSE) - 9.2% CAGR, lower risk than Sensex - QARP on German Stocks (XETRA) - 8.75% CAGR, +3.69% vs DAX - QARP on Chinese Stocks (SHZ + SHH) - SHH beats SSE Composite - QARP on Hong Kong Stocks (HKSE) - +2.71% vs Hang Seng - QARP: 12-Exchange Global Comparison - full comparison table
References
- Piotroski, J. (2000). "Value Investing: The Use of Historical Financial Statement Information to Separate Winners from Losers." Journal of Accounting Research, 38 (suppl.), 1-41.
- Novy-Marx, R. (2013). "The Other Side of Value: The Gross Profitability Premium." Journal of Financial Economics, 108(1), 1-28.
- Asness, C., Frazzini, A. & Pedersen, L. (2019). "Quality Minus Junk." Review of Accounting Studies, 24(1), 34-112.
Run This Screen Yourself
Via web UI: Run the QARP screen on Ceta Research. The query is pre-loaded. Hit "Run" and see what passes today.
Via Python:
import requests, time

API_KEY = "your_api_key"  # get one at cetaresearch.com
BASE = "https://tradingstudio.finance/api/v1"

# Submit the QARP screen query
resp = requests.post(f"{BASE}/data-explorer/execute", headers={
    "X-API-Key": API_KEY, "Content-Type": "application/json"
}, json={
    "query": """
        SELECT k.symbol, p.companyName, s.piotroskiScore,
            k.returnOnEquityTTM * 100 as roe_pct,
            f.priceToEarningsRatioTTM as pe_ratio,
            k.marketCap / 1e9 as market_cap_billions
        FROM key_metrics_ttm k
        JOIN financial_ratios_ttm f ON k.symbol = f.symbol
        JOIN scores s ON k.symbol = s.symbol
        JOIN profile p ON k.symbol = p.symbol
        WHERE k.returnOnEquityTTM > 0.15
            AND f.debtToEquityRatioTTM >= 0 AND f.debtToEquityRatioTTM < 0.5
            AND k.currentRatioTTM > 1.5 AND k.incomeQualityTTM > 1
            AND s.piotroskiScore >= 7
            AND f.priceToEarningsRatioTTM > 5 AND f.priceToEarningsRatioTTM < 25
            AND k.marketCap > 1e9
        ORDER BY s.piotroskiScore DESC
    """,
    "options": {"format": "json", "limit": 100}
})
task_id = resp.json()["taskId"]

# Poll until complete
while True:
    result = requests.get(f"{BASE}/tasks/data-query/{task_id}",
                          headers={"X-API-Key": API_KEY}).json()
    if result["status"] in ("completed", "failed"):
        break
    time.sleep(2)

for r in result["result"]["rows"][:10]:
    print(f"{r['symbol']:8s} F={r['piotroskiScore']} ROE={r['roe_pct']:.1f}% P/E={r['pe_ratio']:.1f}")
Get your API key at cetaresearch.com. The full backtest code (Python + DuckDB) is on GitHub.
Data: Ceta Research, FMP financial data warehouse. Universe: NYSE + NASDAQ + AMEX. Semi-annual rebalance, equal weight, 2000-2025.


