Price-to-Book on Brazilian Stocks: 16.12% CAGR, Highest Alpha in 18 Markets
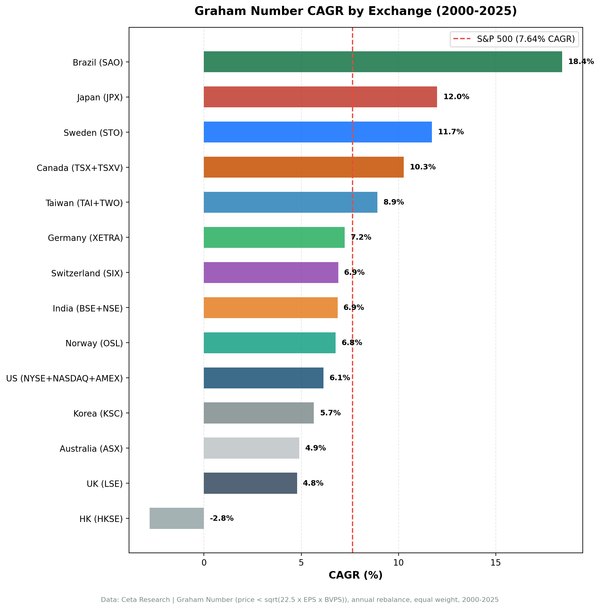
Brazil's B3 returned 16.12% CAGR on a low P/B screen over 25 years. 8.47% annual alpha over the S&P 500, the highest across all 18 exchanges tested. Down capture of just 7.5%. Returns in BRL; currency adjustment reduces but doesn't eliminate the alpha.

Price-to-Book on Brazilian Stocks: 16.12% CAGR and the Highest Alpha in 18 Markets
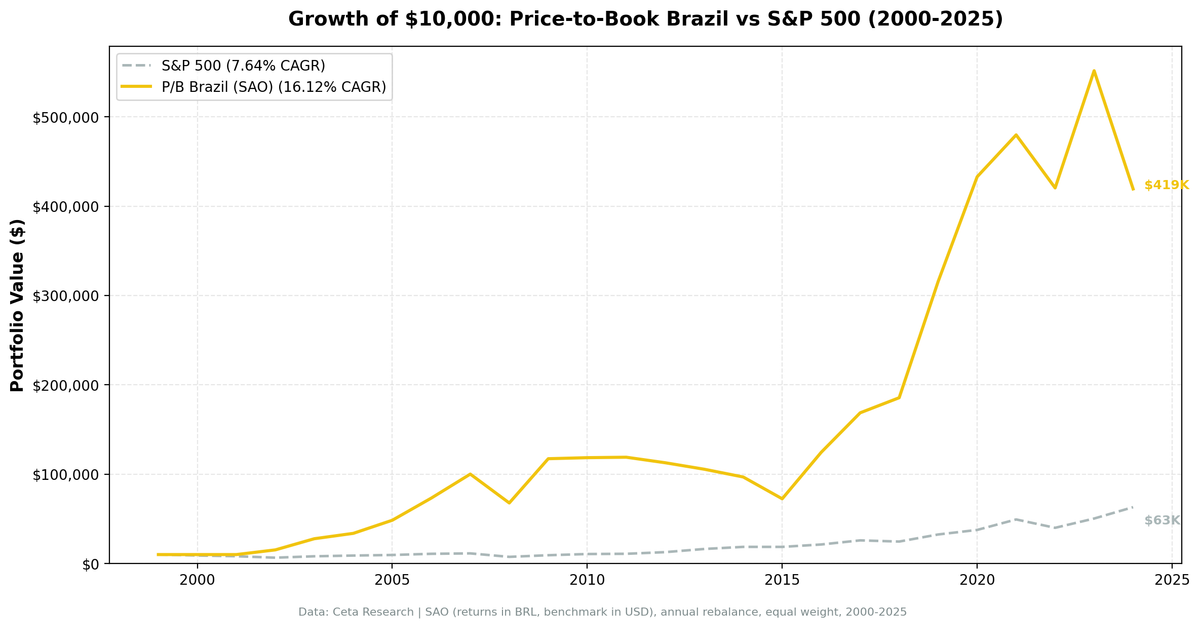
Brazil's B3 exchange delivered 16.12% CAGR on a low P/B screen from 2000 to 2025. That's 8.47% annual excess return over the S&P 500, the highest absolute alpha across all 18 exchanges we tested. Win rate against the S&P 500 was 68%: 17 of 25 years beat the benchmark.
Contents
- Method
- What Research Shows
- The Simple Screen
- The Advanced Screen
- Backtest Results
- When It Works
- When It Fails
- Sector Concentration
- Limitations
- Takeaway
- Part of a Series
- Run This Screen
- References
These are BRL returns. The Brazilian Real lost significant value against the US dollar over this period, and that matters. But even after a rough currency adjustment, the alpha remains substantial. For a Brazilian investor, the numbers are even more striking.
The academic textbooks say P/B works. Brazil is the place where the textbooks still hold.
Method
Data source: Ceta Research (FMP financial data warehouse) Universe: SAO (B3/Bovespa), market cap above exchange threshold Period: 2000–2025 (25 years, 25 annual rebalance periods) Portfolio: Top 30 stocks by lowest P/B ratio, equal weight Rebalancing: Annual (January) Signal filters: P/B between 0 and 1.5, ROE > 8% Cash rule: Hold cash if fewer than 10 stocks qualify Average stocks per period: 22.9 Cash periods: 2 of 25 (2000 and 2001, data too thin) Benchmark: SPY (S&P 500 ETF)
Currency note: All returns are in BRL (Brazilian Real). The BRL depreciated substantially against the USD from 2000 to 2025. A rough estimate suggests roughly 3–5% annual currency drag for a USD-based investor over the full period. Individual years can swing dramatically more. A USD-based investor comparing these returns directly to SPY is mixing currencies. The comparison is still informative for understanding the strategy's behavior, but alpha in USD terms is lower.
What Research Shows
P/B is the most academically documented value metric in finance. Fama and French's 1992 paper established it as a core factor in the cross-section of expected returns. Their 1998 international extension confirmed the premium held across 13 non-US markets.
Emerging markets are where the signal tends to be strongest. The reasoning is market efficiency: fewer analysts per stock, less institutional coverage, more behavioral overreaction to distress. Stocks get cheap on a book value basis and stay cheap longer than they would in a deeper, more followed market.
Rosenberg, Reid and Lanstein documented the US P/B premium in 1985. Gray and Vogel's 2012 comparison found P/B underperformed EBIT/EV on a risk-adjusted basis, but the premium was still present, particularly in asset-heavy sectors. Brazil's B3 is dominated by exactly those sectors: banks, commodity producers, state-owned enterprises.
The theory says P/B should work here. Twenty-five years of data confirms it.
The Simple Screen
Find every B3 stock currently trading below 1.5x book with a market cap above the exchange threshold:
SELECT
    k.symbol,
    p.companyName,
    ROUND(k.priceToBookRatioTTM, 3) AS pb_ratio,
    ROUND(k.marketCap / 1e9, 2) AS mktcap_b
FROM key_metrics_ttm k
JOIN profile p ON k.symbol = p.symbol
WHERE k.priceToBookRatioTTM > 0
  AND k.priceToBookRatioTTM < 1.5
  AND k.marketCap > 500000000
  AND p.exchange = 'SAO'
ORDER BY k.priceToBookRatioTTM ASC
LIMIT 30
Run this screen on Ceta Research →
The output is typically a mix of banks (Itaú, Bradesco, Banco do Brasil), commodity producers (Vale, Petrobras), and consumer staples. These are asset-heavy businesses where book value is a real number, not an accounting fiction.
The Advanced Screen
Add the ROE filter to separate genuinely cheap stocks from deteriorating ones:
SELECT
    k.symbol,
    p.companyName,
    ROUND(k.priceToBookRatioTTM, 3) AS pb_ratio,
    ROUND(k.returnOnEquityTTM * 100, 1) AS roe_pct,
    ROUND(k.marketCap / 1e9, 2) AS mktcap_b
FROM key_metrics_ttm k
JOIN profile p ON k.symbol = p.symbol
WHERE k.priceToBookRatioTTM > 0
  AND k.priceToBookRatioTTM < 1.5
  AND k.returnOnEquityTTM > 0.08
  AND k.marketCap > 500000000
  AND p.exchange = 'SAO'
ORDER BY k.priceToBookRatioTTM ASC
LIMIT 30
In Brazil this filter does real work. The simple screen catches some state-owned enterprises that are cheap for structural reasons: chronic underinvestment, political interference, or inflated wage bills. The ROE > 8% filter removes the ones where cheapness reflects genuine dysfunction rather than temporary mispricing.
Backtest Results
Summary metrics:
| Metric | P/B Brazil (SAO) | S&P 500 (SPY) |
|---|---|---|
| CAGR | 16.12% | 7.64% |
| Excess CAGR | +8.47% | — |
| Sharpe Ratio | 0.168 | — |
| Max Drawdown | -39.1% | -34.9% |
| Win Rate vs SPY | 68% (17/25 years) | — |
| Up Capture | 159.69% | — |
| Down Capture | 7.5% | — |
| Avg Stocks | 22.9 | — |
| Cash Periods | 2 / 25 | — |
The Sharpe ratio (0.168) looks low. That's because BRL volatility is enormous. Annual swings of 20-40% are common in an emerging market with Brazil's macro history. The CAGR tells a different story. 16.12% over 25 years, compounded, is extraordinary.
Annual returns:
| Year | P/B Brazil (BRL) | S&P 500 (USD) | Excess |
|---|---|---|---|
| 2000 | 0.0% (cash) | -10.5% | — |
| 2001 | 0.0% (cash) | -9.17% | — |
| 2002 | +52.49% | -19.92% | +72.4pp |
| 2003 | +81.91% | +24.12% | +57.8pp |
| 2004 | +21.67% | +10.24% | +11.4pp |
| 2005 | +43.48% | +7.17% | +36.3pp |
| 2006 | +51.19% | +13.65% | +37.5pp |
| 2007 | +36.69% | +4.4% | +32.3pp |
| 2008 | -32.3% | -34.31% | +2.0pp |
| 2009 | +73.13% | +24.73% | +48.4pp |
| 2010 | +0.99% | +14.31% | -13.3pp |
| 2011 | +0.42% | +2.46% | -2.0pp |
| 2012 | -5.2% | +17.09% | -22.3pp |
| 2013 | -6.43% | +27.77% | -34.2pp |
| 2014 | -8.23% | +14.5% | -22.7pp |
| 2015 | -25.19% | -0.12% | -25.1pp |
| 2016 | +71.8% | +14.45% | +57.3pp |
| 2017 | +35.53% | +21.64% | +13.9pp |
| 2018 | +10.01% | -5.15% | +15.2pp |
| 2019 | +70.16% | +32.31% | +37.8pp |
| 2020 | +37.1% | +15.64% | +21.5pp |
| 2021 | +10.83% | +31.26% | -20.4pp |
| 2022 | -12.38% | -18.99% | +6.6pp |
| 2023 | +31.21% | +26.0% | +5.2pp |
| 2024 | -23.99% | +25.28% | -49.3pp |
When It Works
Emerging market booms. The 2002–2007 run was extraordinary. Six consecutive years of returns above 20% in BRL. Brazil was in a commodity supercycle: iron ore exports to China, soybean demand, oil discoveries. Low P/B stocks on B3 (banks, miners, energy) were priced for distress and delivered cyclical upside. The strategy returned +52%, +82%, +21%, +43%, +51%, and +37% in six straight years.
Post-crisis recoveries. 2009 (+73.13%) and 2016 (+71.8%) are the two largest single years. Both followed periods of severe distress. When valuations get crushed and then normalize, the low-P/B portfolio recovers violently. It owns the beaten-down names at the lows and rides the mean reversion.
Down capture. The 7.5% down capture is the second-lowest across all 18 exchanges in our study (Canada's 8.02% is slightly higher). When the S&P 500 had a bad year, the Brazil P/B portfolio usually didn't follow. 2002 (+52% vs -19.92%), 2008 (-32% vs -34%, outperforming in a crash), 2018 (+10% vs -5%), 2022 (-12% vs -19%). The portfolio held up better than the US benchmark in most down markets.
When It Fails
The Dilma recession (2012–2015). Four years of poor results: -5.2%, -6.4%, -8.2%, -25.2%. Brazil's economy contracted under President Dilma Rousseff. GDP fell, inflation exceeded 10%, the Selic rate hit 14.25%, the Real collapsed, and Petrobras became the center of the Lava Jato corruption scandal. This wasn't bad stock selection. It was the entire economy deteriorating. No low-P/B screen can survive that.
Tech-driven US rallies. 2013 (-6.43% vs +27.77%), 2021 (+10.83% vs +31.26%), 2024 (-23.99% vs +25.28%). When US mega-cap technology dominates, Brazil gets none of it. The B3 low-P/B screen owns banks and commodity producers. It structurally misses the secular growth drivers of US market performance in tech-dominated years.
Currency collapse years. 2024 was the worst recent year: -23.99% vs +25.28% SPY, a 49-point gap. BRL depreciation against the USD was severe. Even if the underlying BRL equity returns looked adequate, a USD-based investor saw double damage: equity losses plus currency losses simultaneously.
Sector Concentration
The SAO low-P/B screen has two dominant sectors throughout the backtest:
Banks (Financials). Itaú Unibanco, Bradesco, Banco do Brasil, Santander Brasil, and Caixa are all asset-heavy institutions that frequently trade below 1.5x book. They maintain ROE above 8% through most of the cycle. Financials typically represent 30–50% of the portfolio in any given year.
Commodities (Energy, Materials). Petrobras, Vale, Suzano, and similar resource companies appear regularly. Brazil is a commodity exporter at scale. When commodity prices are high, these companies earn substantial ROE and trade at compressed P/B. When prices fall, they get cheaper still and stay in the portfolio. This creates the boom-bust pattern visible in the annual returns.
Together, these two sectors drive almost all the performance. The concentration is a feature in upcycles and a risk in downcycles.
Limitations
Currency mismatch. This is the most important caveat. Returns are in BRL. The S&P 500 benchmark is in USD. The BRL lost roughly 60–70% of its value against the Dollar over the 25-year period, implying roughly 3–5% annual drag in dollar-adjusted terms. The reported 8.47% excess CAGR drops meaningfully for a USD-based investor. The exact number depends on hedging, timing of investments, and which BRL/USD rate you use for conversions.
BRL volatility. Beyond the direction, the Real swings dramatically year to year. Annual moves of 15–25% against the Dollar are common. This adds a layer of volatility for USD-based investors that isn't captured in the BRL return numbers.
Political and macro risk. The 2012–2015 drawdown was driven by governance failures, not investment errors. Lava Jato, fiscal mismanagement, and political instability devastated corporate earnings across the market. Quantitative screens can't anticipate or avoid these events.
Survivorship bias. The universe uses current company profiles. Brazilian companies that delisted, merged, or went bankrupt during the 25-year period aren't fully captured. OGX's collapse in 2013 is an example of a high-profile failure that screening data may not fully reflect.
Thin early data. The portfolio was in cash for 2000 and 2001 because fewer than 10 stocks passed the filters. As coverage improved, the 22.9-stock average filled in from 2002 onward. Early period results are less statistically meaningful.
Transaction costs. Returns are gross. Annual rebalancing of 30 stocks in an emerging market has real costs, particularly for smaller-cap positions.
Takeaway
Brazil is the highest-alpha P/B market in our 18-exchange study. 16.12% CAGR, 8.47% excess return over SPY, 68% annual win rate. The academic case for P/B, buying assets cheap in markets where mispricing persists, holds in Brazil more than almost anywhere else we tested.
The structural reasons are clear. B3 is dominated by asset-heavy businesses (banks, commodity companies, state-owned enterprises) where book value is real. The market has historically had lower analyst coverage per stock than US exchanges, creating more persistent mispricing. Brazil's economic cycles create wide valuation swings that the low-P/B screen captures on the recovery.
Two realities temper the headline numbers. First, the currency. BRL-denominated returns overstate alpha for a USD-based investor by roughly 3–5% annually. Second, the political risk. The 2012–2015 recession showed that three consecutive losing years are possible when macro and governance factors overwhelm fundamentals. You have to hold through those periods to capture the recoveries that follow.
For a BRL-based investor, the track record here is among the strongest we've seen for a systematic value strategy. For a USD-based investor, the strategy still produces meaningful alpha after currency adjustment, but with substantially higher volatility and political risk than a developed-market alternative.
Part of a Series
This is part of our Price-to-Book global exchange series:
- P/B in the US → (flagship, full methodology)
- P/B in Sweden →
- P/B in Canada →
- P/B in Brazil → (this post)
- Global Comparison →
Run This Screen
Via web: Run the P/B Brazil screen on Ceta Research →
Via Python:
# Clone the backtest repo
git clone https://github.com/ceta-research/backtests.git
cd backtests

# Run the screen (requires CR_API_KEY)
export CR_API_KEY="your-api-key"
python3 price-to-book/screen.py --exchange SAO

# Run the backtest
python3 price-to-book/backtest.py --exchange SAO --verbose
Get your API key at cetaresearch.com.
References
- Fama, E. & French, K. (1992). "The Cross-Section of Expected Stock Returns." Journal of Finance, 47(2), 427–465.
- Fama, E. & French, K. (1998). "Value versus Growth: The International Evidence." Journal of Finance, 53(6), 1975–1999.
- Rosenberg, B., Reid, K. & Lanstein, R. (1985). "Persuasive Evidence of Market Inefficiency." Journal of Portfolio Management, 11(3), 9–16.
- Gray, W. & Vogel, J. (2012). "Analyzing Valuation Measures: A Performance Horse-Race over the Past 40 Years." Journal of Portfolio Management, 39(1), 112–121.
Data: Ceta Research (FMP financial data warehouse). Universe: SAO/B3, 2000–2025. Annual rebalance (January), equal weight, top 30 by P/B ASC. Filters: P/B 0–1.5, ROE > 8%, market cap above exchange threshold. Returns in BRL. Full methodology: METHODOLOGY.md