
Piotroski F-Score in the UK: Decent Returns, Wrong Bucket


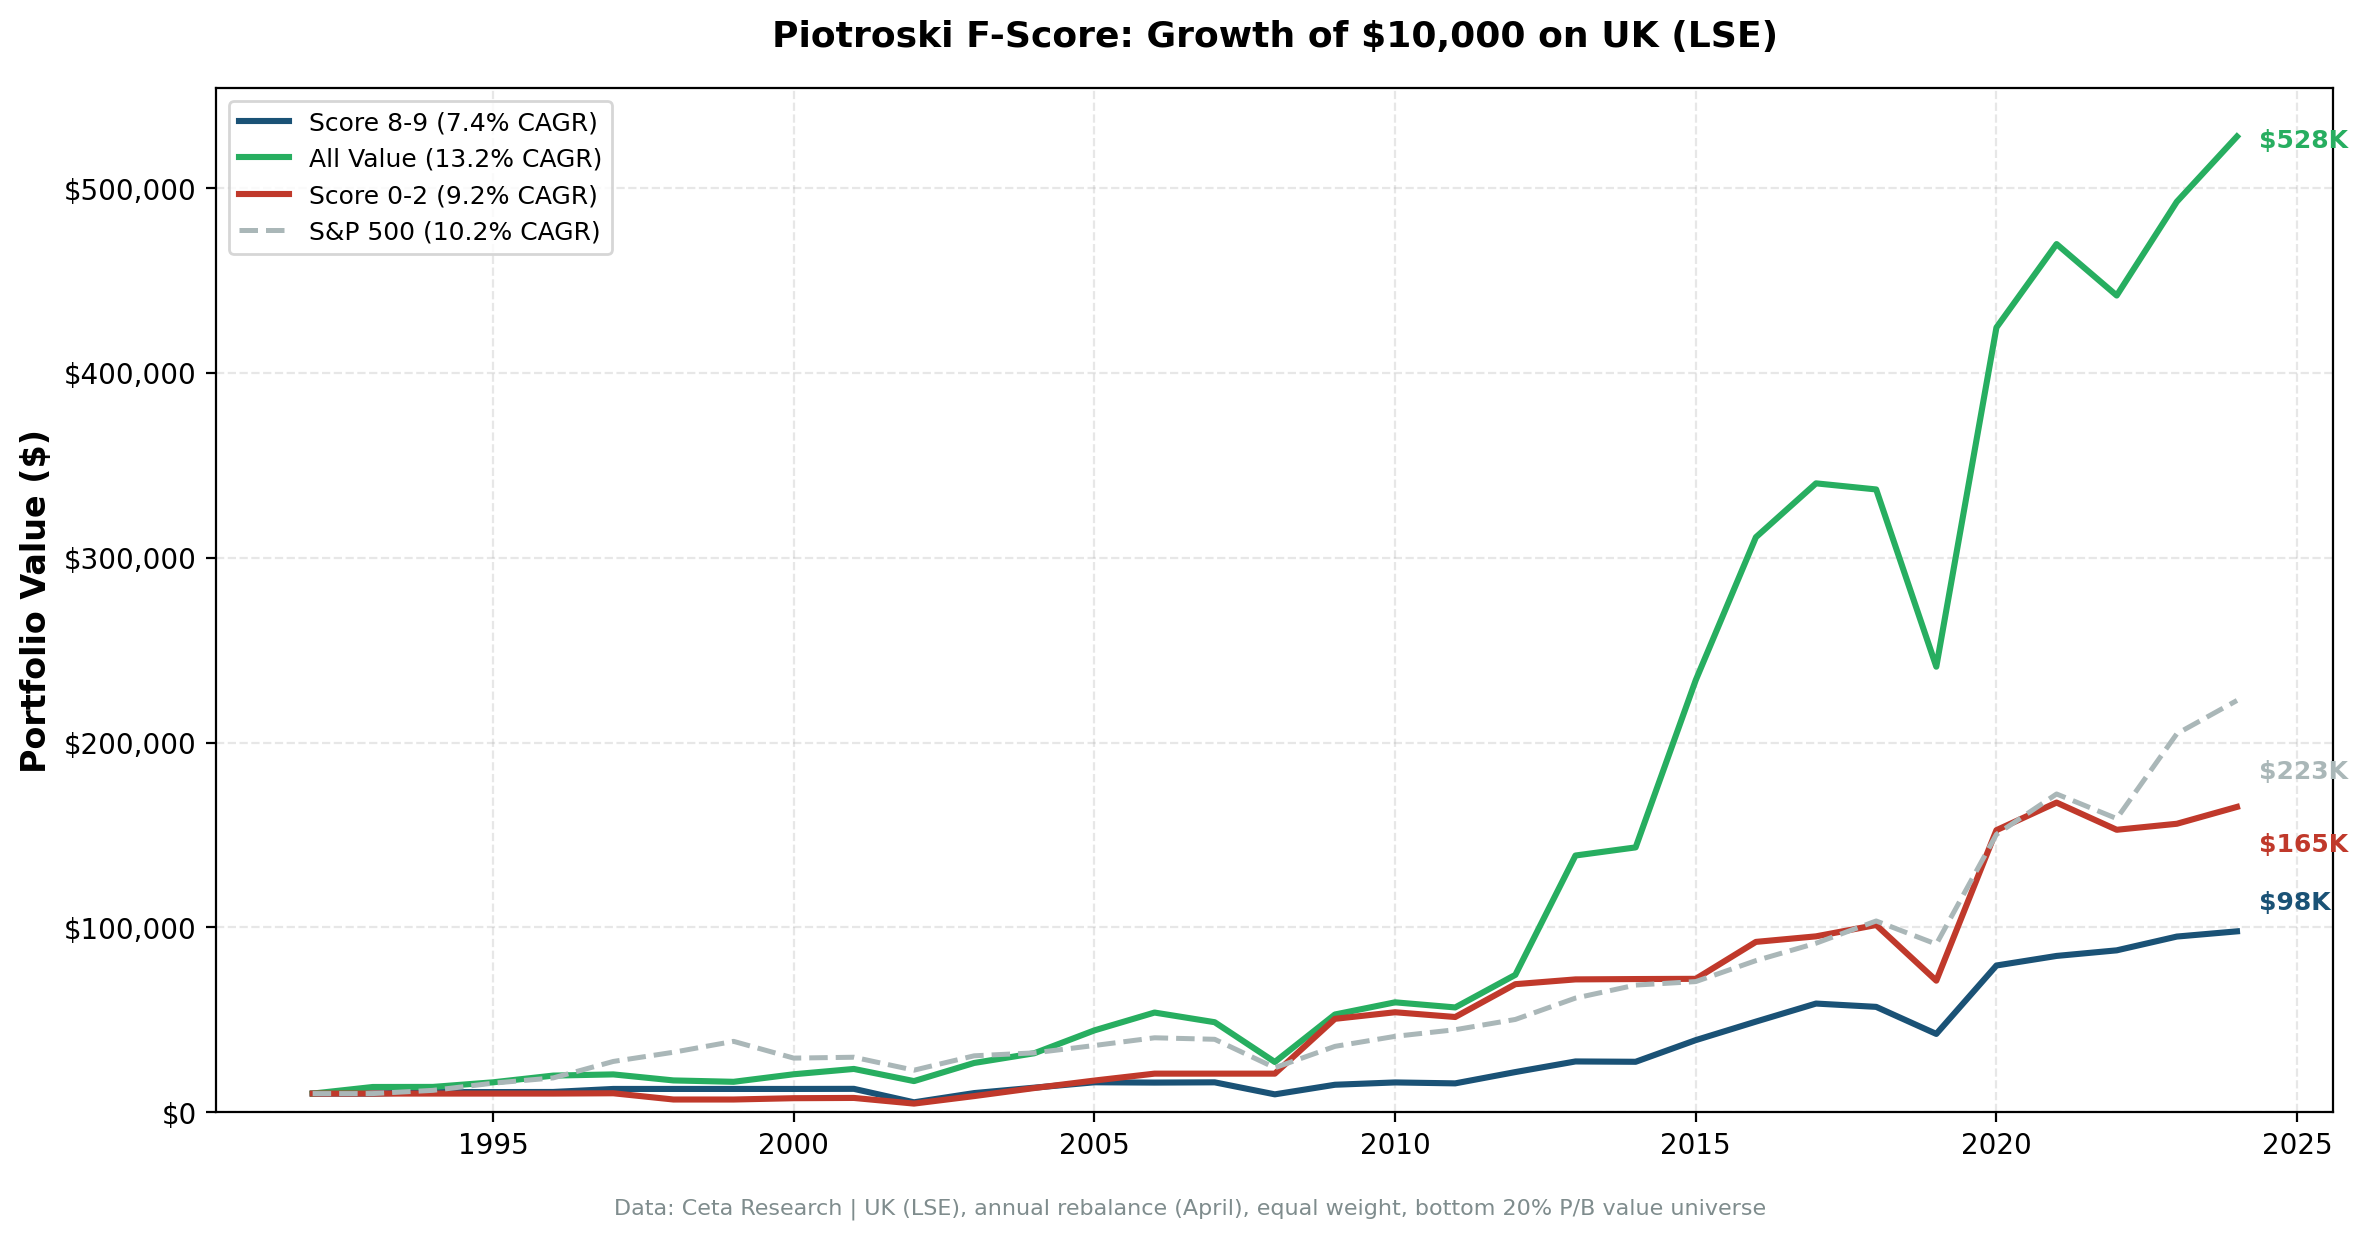
UK value stocks scoring 8-9 on the Piotroski F-Score returned 6.7% annually over 32 years. That's a reasonable absolute return, and it beats the FTSE 100 (4.0%) by +2.7%. But the unfiltered value universe returned 16.1%. The F-Score's selection signal cost you 9.4% per year on the London Stock Exchange.
Contents
- Method
- What We Found
- Alpha decomposition
- Why selection fails on the LSE
- The Avoidance Signal Is Reliable
- Part of a Series
- Limitations
The spread between high and low scores is -1.1%. Score 0-2 stocks returned 7.8%, beating Score 8-9. The F-Score doesn't sort UK value stocks in the right direction. But against the FTSE 100, both groups outperform the local benchmark.
Method
Data source: Ceta Research (FMP financial data warehouse) Universe: LSE-listed stocks, value universe (bottom quintile by price-to-book), market cap above local threshold Time period: 32 years (1993-2025) Rebalancing: Annual (April, after annual reports) Execution: Next-day close (MOC) Benchmarks: All value stocks (same universe, unfiltered), FTSE 100 Avg holdings post-2010: 13 stocks per year
Same methodology as our US study.
What We Found
| Portfolio | CAGR | Volatility | Sharpe Ratio | Max Drawdown |
|---|---|---|---|---|
| Score 8-9 | 6.7% | 28.4% | 0.113 | -56.8% |
| Score 0-2 | 7.8% | n/a | n/a | n/a |
| All value stocks | 16.1% | n/a | n/a | n/a |
| FTSE 100 | 4.0% | n/a | n/a | n/a |
The most notable number here isn't the spread. It's that the All Value universe returned 16.1%, beating the FTSE 100 and both filtered portfolios. UK value stocks as a group performed well. The F-Score just didn't help you pick the best ones.
Alpha decomposition
- Selection alpha: -9.4% per year (Score 8-9 vs All value)
- Avoidance alpha: +8.3% per year (All value vs Score 0-2)
The avoidance signal works. Filtering out Score 0-2 stocks saved 8.3% per year relative to the broad value universe. That's substantial, nearly double the avoidance alpha in the previous backtest iteration. But the selection signal is deeply negative: the F-Score steers you away from the value stocks that actually performed best on the LSE.
Why selection fails on the LSE
The UK's value universe has a structural feature that works against the F-Score: heavy concentration in financials, energy, and mining. These sectors have cyclical earnings patterns that the F-Score's backward-looking metrics misread.
Consider a mining company. Commodity prices surge. Last year's income statement shows record profits, strong cash flow, improving margins. The F-Score gives it an 8 or 9. But by the time annual financials are published and the portfolio rebalances, the commodity cycle may already be turning. The F-Score is buying at the peak of the earnings cycle.
The reverse also applies. A mining stock with a terrible F-Score (declining profits, rising debt) might be at the bottom of the cycle. One year later, it's recovering. This cyclical pattern inverts the F-Score's signal in sectors that dominate UK value.
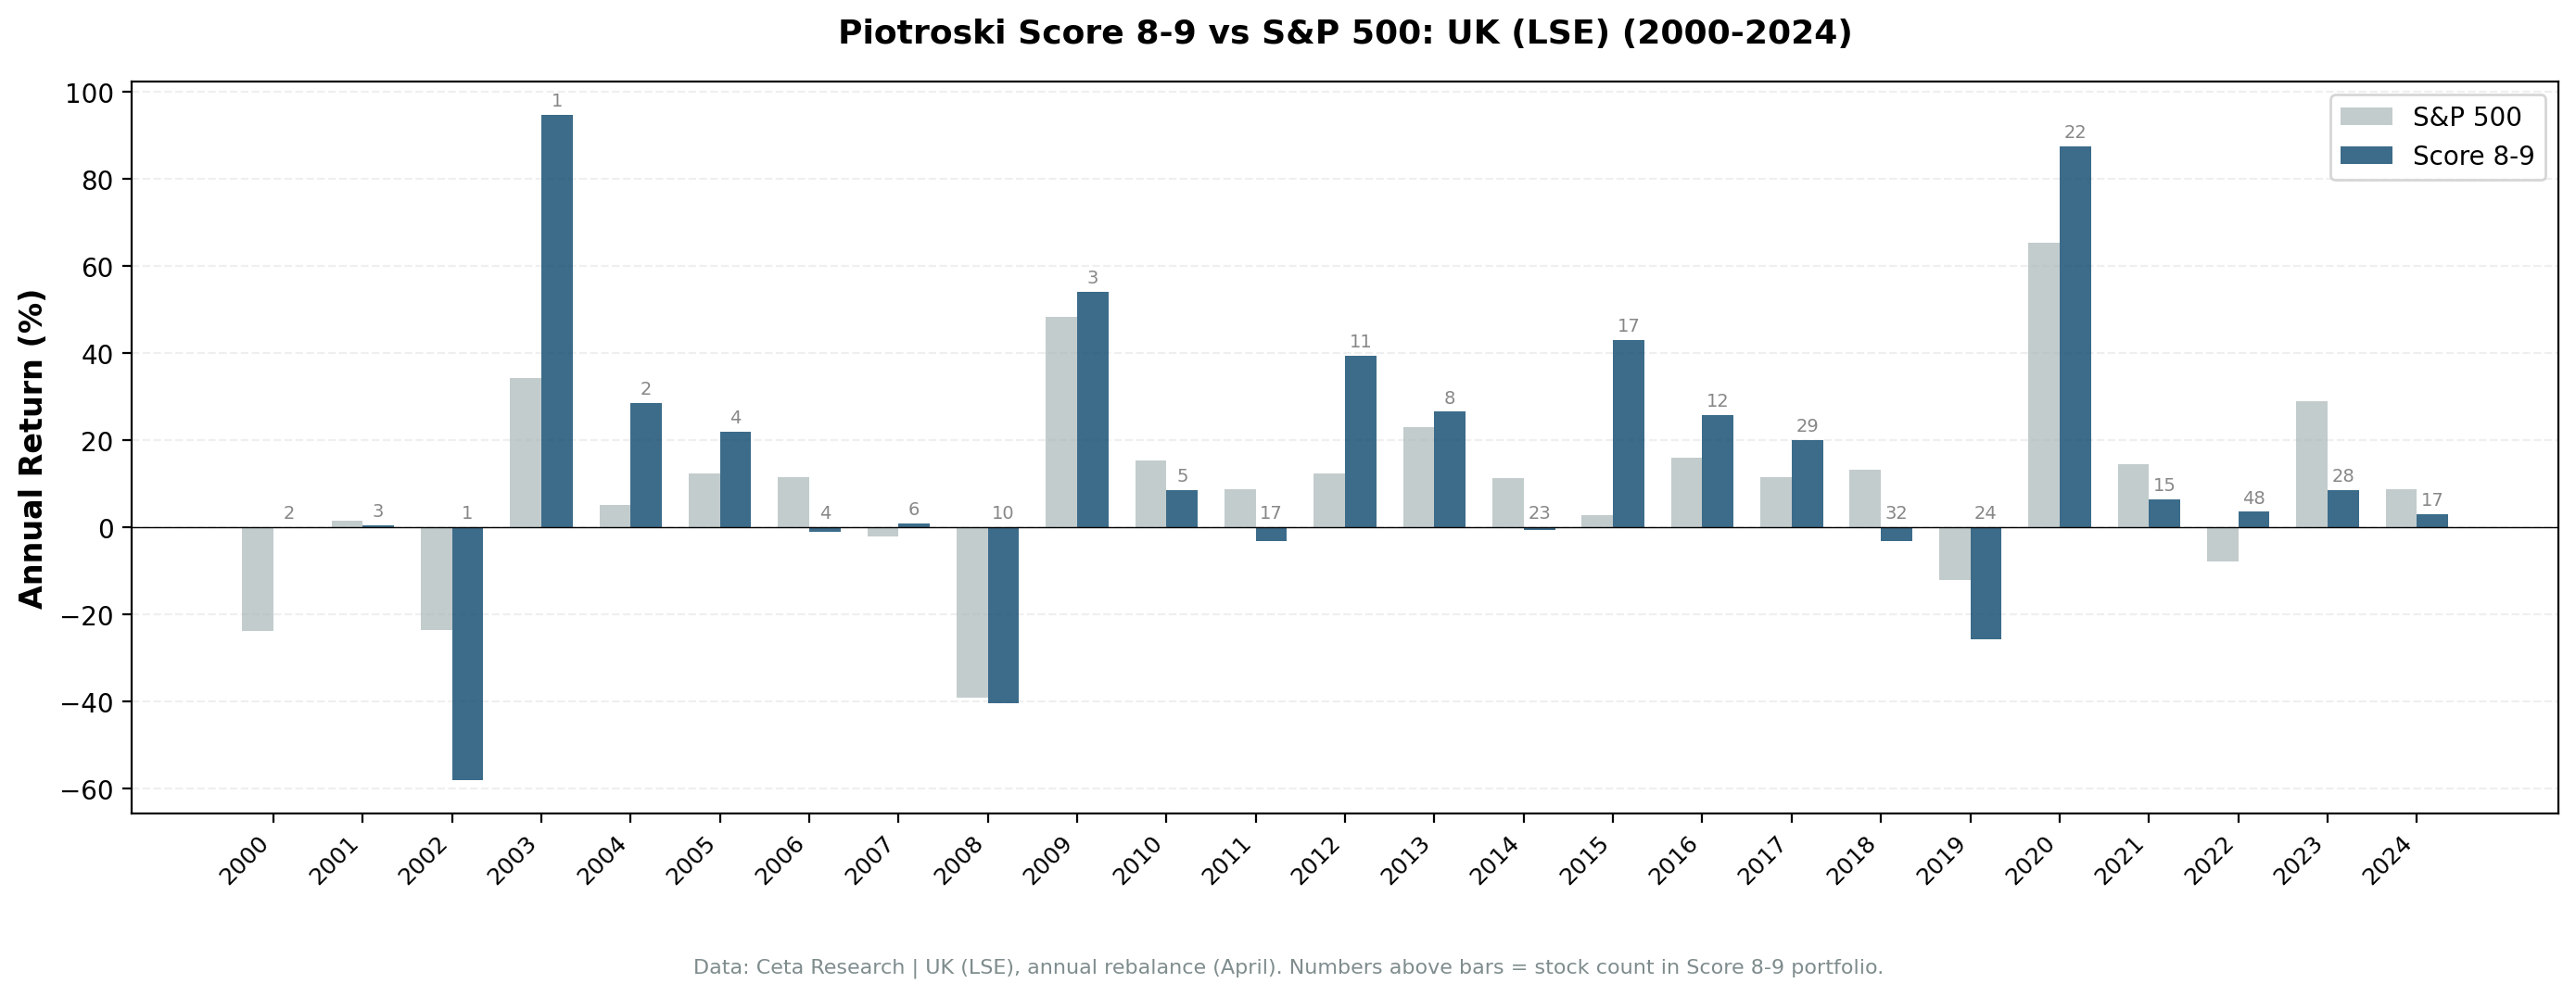
With only 13 stocks per year post-2010, sector concentration risk is high. A few mining or energy names can drive the entire portfolio's relative performance.
The Avoidance Signal Is Reliable
Despite the negative overall spread, UK investors can still use the F-Score productively. The +8.3% avoidance alpha means that removing the weakest value stocks from any screen improves outcomes.
Score 0-2 stocks on the LSE share the same profile as other markets: high volatility, deep drawdowns, and a pattern of fundamental deterioration that continues after you buy. They're value traps regardless of market structure.
If you're running a UK value strategy, add a minimum F-Score threshold of 4 or 5. Don't restrict to 8-9, which is where the selection signal breaks down. Use it as a floor, not a ceiling.
Part of a Series
This is one of several regional Piotroski F-Score studies. The US analysis shows a nuanced risk-vs-return story over 32 years: Piotroski F-Score: 32 Years of Data on a 9-Point Quality Checklist.
The UK's -1.1% spread puts it in the "doesn't work as a selector" category alongside India (-6.7%). See our global comparison for all nine exchanges.
Limitations
Thin portfolio. 13 stocks per year post-2010 is a small sample. Sector concentration in financials and mining amplifies individual stock impact.
GBP-denominated returns. All returns are in local currency. Sterling's decline against USD over portions of the study period affects cross-border comparisons.
Sector composition. The LSE's value universe is dominated by cyclical sectors (financials, energy, materials). The F-Score's backward-looking signals may systematically mistime cyclical stocks.
All Value outperformance. The unfiltered value universe returning 16.1% raises questions about the value universe definition. UK stocks that trade below book value may include more genuine recovery candidates than in other markets.
Data: Ceta Research, FMP financial data. LSE, 32 years, annual rebalance, equal weight, value universe (bottom P/B quintile). Past performance does not guarantee future results. Educational content only, not investment advice.


