
Piotroski F-Score in India: The Score That Doesn't Work

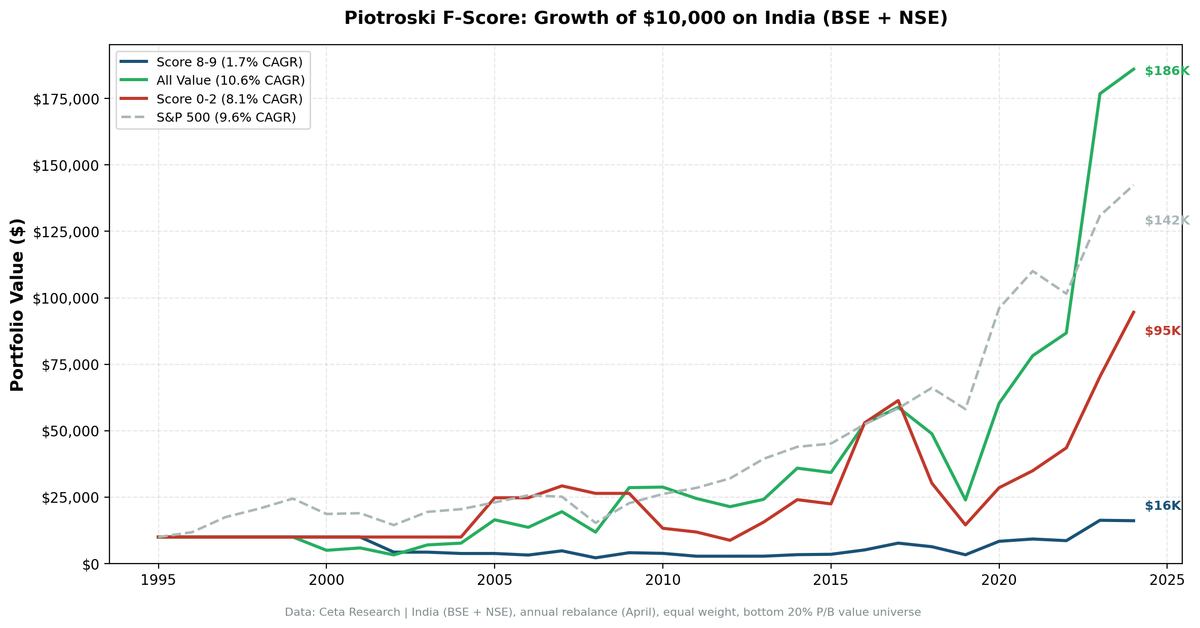
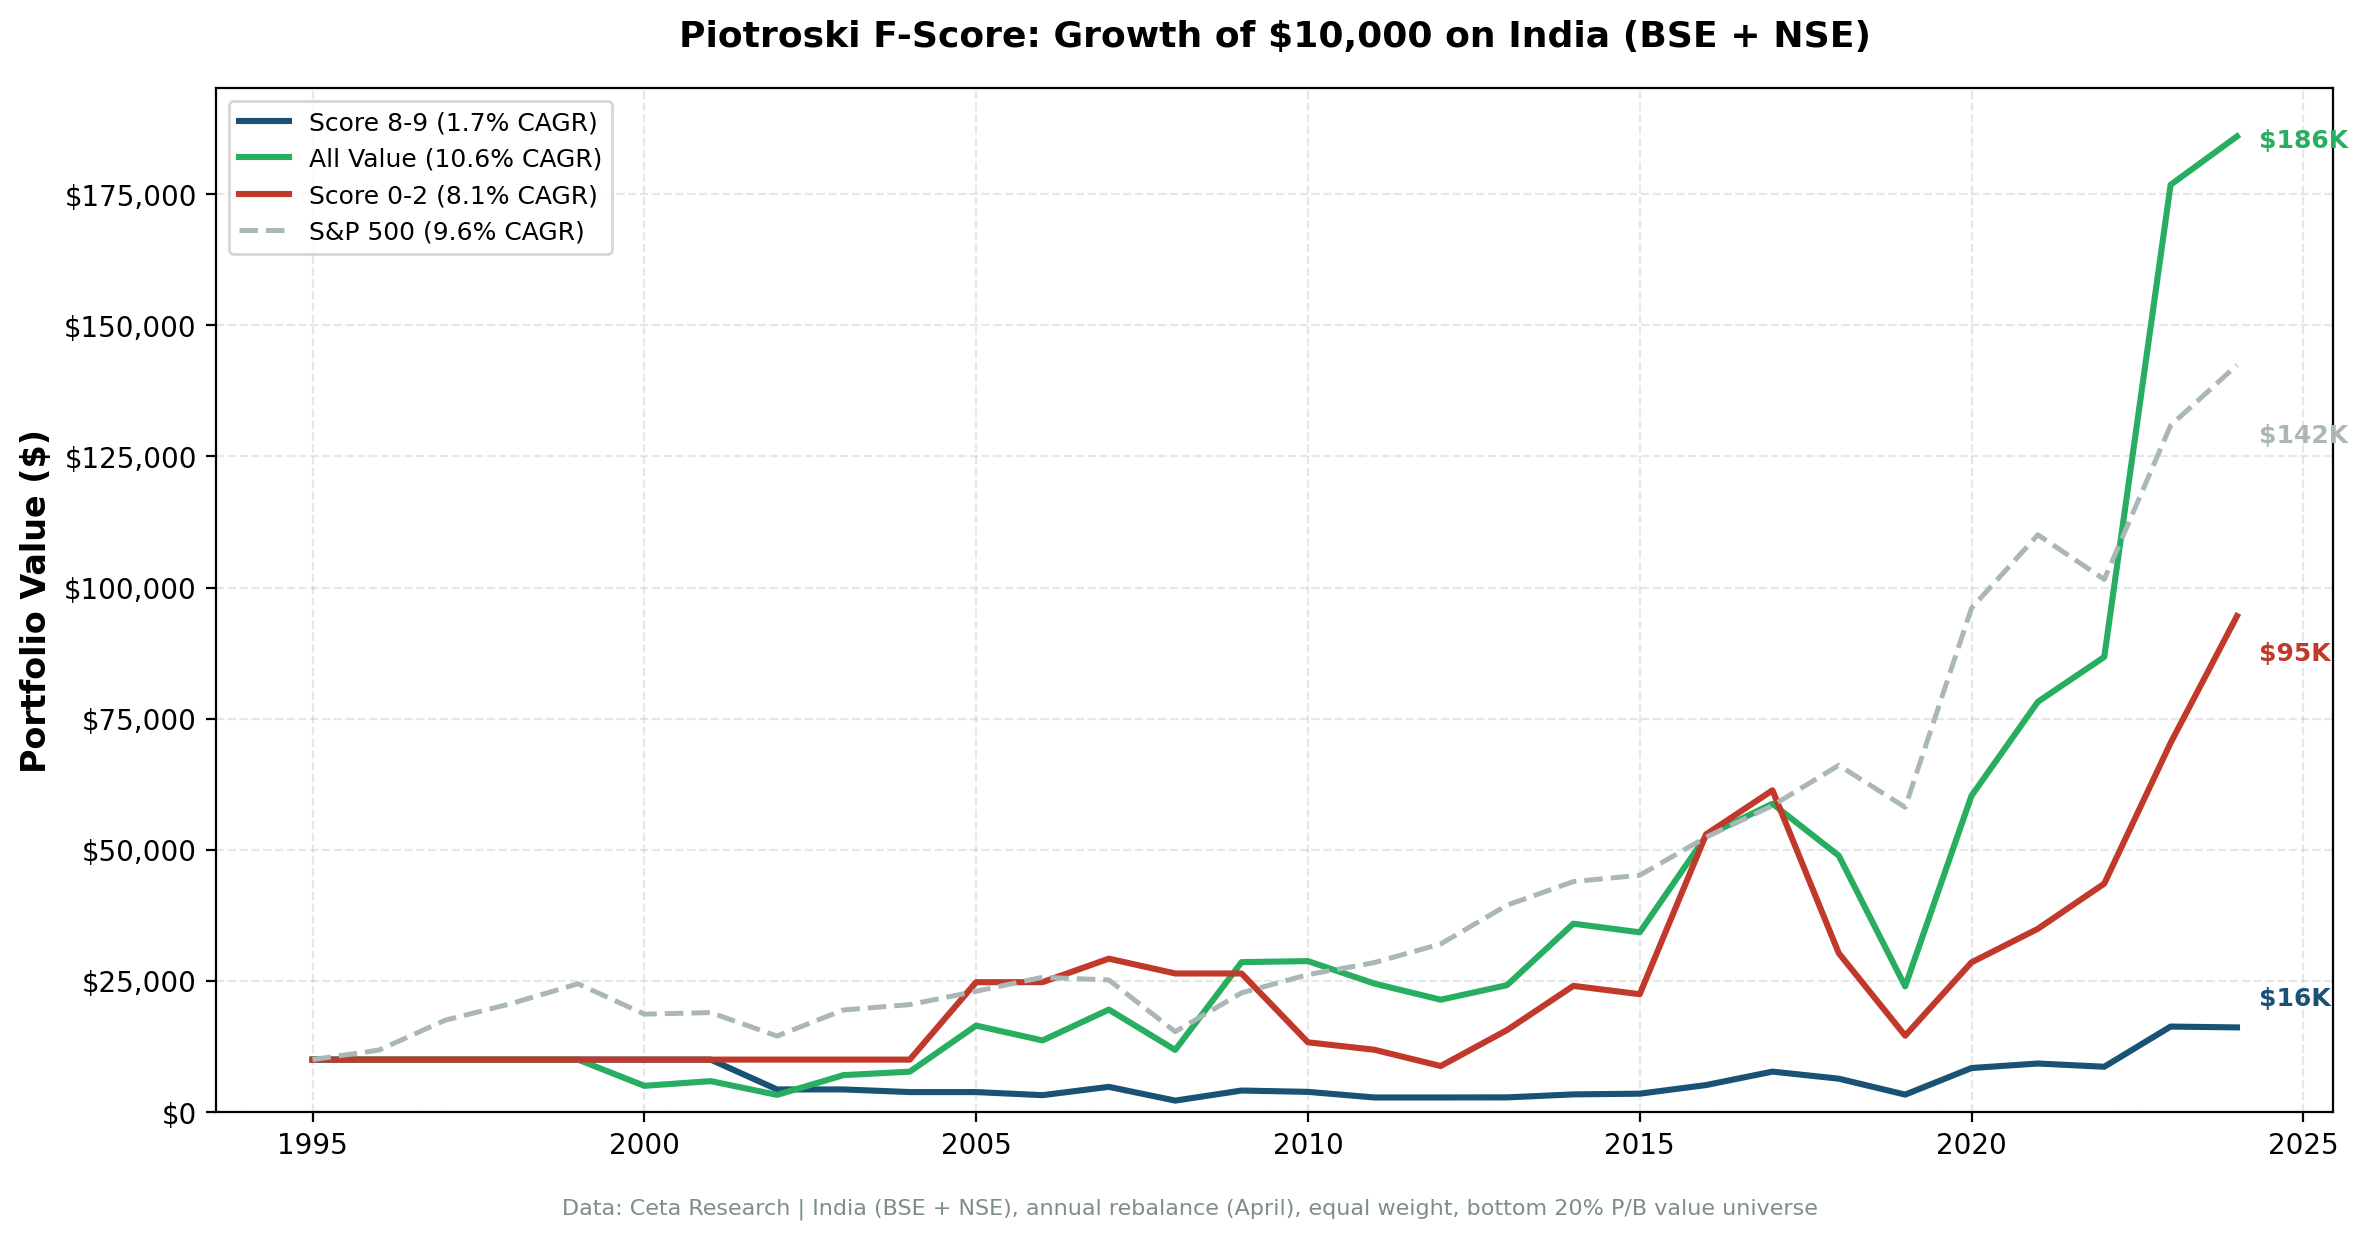
We'll be direct: the Piotroski F-Score does not work in India. Over 29 years on BSE and NSE, high-scoring value stocks (8-9) returned just 1.9% annually. Low-scoring stocks (0-2) returned 8.6%. The spread is negative: -6.7%.
Contents
- Method
- What We Found
- Alpha decomposition
- Why the F-Score fails in India
- The Avoidance Signal Still Has Value
- Part of a Series
- Limitations
This isn't a marginal failure. The strategy inverts. Buying the "best" value stocks by Piotroski criteria produced worse returns than buying the "worst."
Method
Data source: Ceta Research (FMP financial data warehouse) Universe: BSE and NSE-listed stocks, value universe (bottom quintile by price-to-book), market cap above local threshold Time period: 29 years (1996-2025) Rebalancing: Annual (April, after annual reports) Execution: Next-day close (MOC) Benchmarks: All value stocks (same universe, unfiltered), Sensex Avg holdings post-2010: 16 stocks per year
Same nine-signal methodology as our US study.
What We Found
| Portfolio | CAGR | Volatility | Sharpe Ratio | Max Drawdown |
|---|---|---|---|---|
| Score 8-9 | 1.9% | 43.3% | -0.107 | -76.8% |
| Score 0-2 | 8.6% | 47.9% | 0.044 | -75.0% |
| All value stocks | 10.8% | 54.3% | 0.079 | -66.2% |
| Sensex | 11.3% | 31.3% | 0.154 | -38.3% |
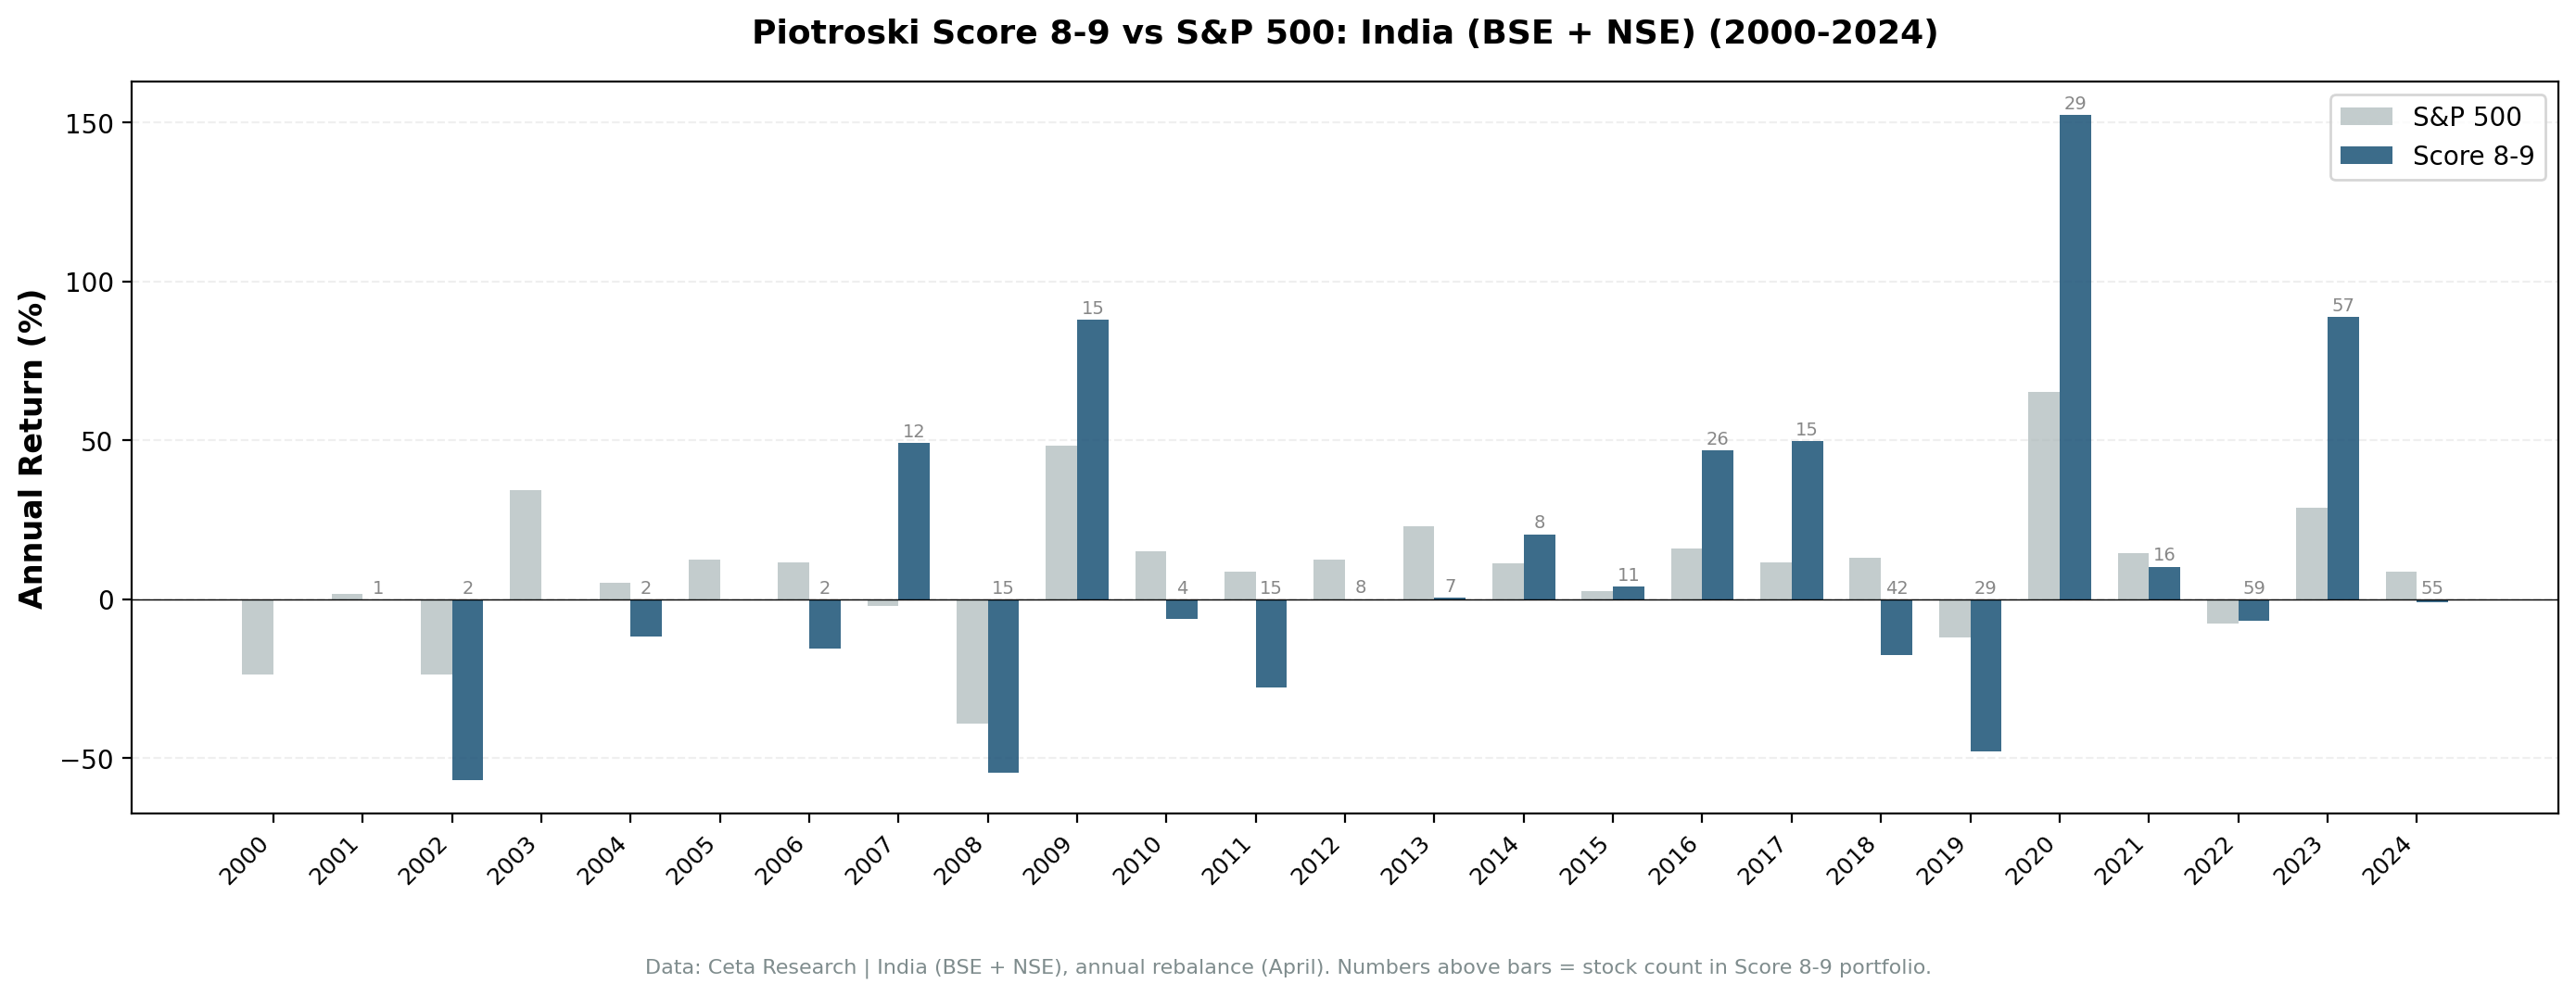
The results are striking. Score 8-9 stocks had a negative Sharpe ratio (-0.107), meaning the risk-free rate beat them after adjusting for volatility. Maximum drawdown hit -76.8%. Volatility ran at 43.3%.
Meanwhile, Score 0-2 stocks returned 8.6%, and the unfiltered value universe returned 10.8%. Even the Sensex returned 11.3%, making the F-Score's high-quality picks the worst option in the Indian market.
Alpha decomposition
- Selection alpha: -9.0% per year (Score 8-9 vs All value)
- Avoidance alpha: +2.2% per year (All value vs Score 0-2)
The avoidance signal still provides modest value. Filtering out the lowest-scoring stocks saved 2.2% per year. But the selection signal is deeply negative. The F-Score actively steers you toward the worst-performing segment of Indian value stocks.
Why the F-Score fails in India
Several structural factors explain the inversion.
Small sample, high concentration. With only 16 qualifying stocks per year post-2010, a handful of names can dominate returns. India's value universe is thinner than the US or Japan, and the 8-9 score threshold creates a very concentrated portfolio.
Growth-driven market. India's equity market rewards growth and momentum. Companies with improving fundamentals (which is what the F-Score measures) are often already re-priced by the time annual financials are published. The value universe's best returns come from turnaround stories that start at rock-bottom scores and re-rate sharply. These are exactly the stocks the F-Score tells you to avoid.
Data quality. Indian financial reporting standards and FMP coverage have improved dramatically over the study period. Earlier years carry more noise in the financial statement inputs that drive the nine signals.
Volatility penalty. At 43.3% annual volatility, the Score 8-9 portfolio is whipsawed by India's periodic market dislocations. The worst drawdown hit -76.8%. A concentrated portfolio of "fundamentally improving" small-cap value stocks in India couldn't survive that kind of drawdown path.
The Avoidance Signal Still Has Value
Even with the inverted overall result, there's a useful finding. The broad value universe (10.8%) beat Score 0-2 stocks (8.6%) by 2.2% per year. If you're running any value strategy in India, filtering out the lowest F-Scores provides some downside protection. It's not as strong as in the US or Japan, but it's positive.
The F-Score in India works better as a "remove the bottom" filter than as a "buy the top" signal.
Part of a Series
This is one of several regional Piotroski F-Score studies. The US analysis covers 32 years and shows a nuanced risk-vs-return story: Piotroski F-Score: 32 Years of Data on a 9-Point Quality Checklist.
India's -6.7% spread is the worst of any market we tested. See our global comparison for the full breakdown across nine exchanges.
Limitations
Thin portfolio. 16 stocks per year post-2010 is a small sample. Individual stock outcomes can swing annual returns by double digits. Results are less statistically robust than markets with deeper coverage.
Rupee-denominated returns. All returns are in local currency. India's rupee has depreciated against USD over most of the study period, which affects international comparisons.
Survivorship. Indian exchanges have seen significant delisting and restructuring. While delisted stocks are included where data exists, earlier periods may have survivorship bias.
No sector balancing. India's value universe concentrates heavily in financials and materials. The F-Score results may partly reflect sector-specific dynamics rather than a pure quality signal.
Data: Ceta Research, FMP financial data. BSE+NSE, 29 years, annual rebalance, equal weight, value universe (bottom P/B quintile). Past performance does not guarantee future results. Educational content only, not investment advice.


