
Piotroski F-Score Backtest: What 32 Years of US Data Actually Show

An accounting professor created a nine-point checklist to separate winning value stocks from future bankruptcies. We ran it on US equities from 1985 to 2025. The high-quality basket (Score 8-9) returned 10.6% annually with a Sharpe of 0.297. The low-quality basket (Score 0-2) returned 10.9% with a Sharpe of 0.193 and a max drawdown of -66.0%. The F-Score doesn't boost returns. It manages risk.
Contents
- Method
- What is the Piotroski F-Score?
- The Screens
- Simple F-Score Screen
- Advanced Screen (Value + Quality)
- What We Found
- The headline: the raw return spread is slightly negative.
- The F-Score is a risk filter, not a return booster.
- The avoidance signal matters more than the selection signal.
- The value factor itself works.
- Decade breakdown
- Score 8-9 vs the S&P 500
- Portfolio concentration
- When It Works and When It Struggles
- Run This Screen Yourself
- Reproduce the backtest
- Limitations
- References
Method
| Parameter | Value |
|---|---|
| Data source | FMP via Ceta Research warehouse |
| Universe | US-listed (NYSE, NASDAQ, AMEX), bottom 20% by price-to-book, market cap > $1B |
| Period | 1985-2025 (32 years) |
| Rebalancing | Annual (April 1, after annual reports) |
| Weighting | Equal weight |
| Transaction costs | 0.1-0.5% per trade (size-tiered) |
| Execution | Next-day close (MOC) |
| Benchmark | S&P 500 (SPY) |
Piotroski scores computed from raw financial statements (income statement, balance sheet, cash flow statement) at each rebalance date. No pre-computed scores used in the backtest. Point-in-time data to avoid look-ahead bias.
What is the Piotroski F-Score?
Joseph Piotroski published his research in 2000 while at the University of Chicago. He wanted to answer a specific question: among cheap stocks, which ones recover and which ones fail?
His answer: a nine-point binary checklist using only financial statement data. One point for each criterion met.
Profitability (4 points): 1. Positive net income 2. Positive operating cash flow 3. Return on assets improved from last year 4. Cash flow exceeds net income (quality earnings)
Leverage and Liquidity (3 points): 5. Long-term debt decreased 6. Current ratio improved 7. No new shares issued (no dilution)
Operating Efficiency (2 points): 8. Gross margin improved 9. Asset turnover improved
Score 9 = fundamentally strong. Score 0 = red flags across the board.
The Screens
Simple F-Score Screen
-- Piotroski F-Score: Simple Screen
-- Run at: cetaresearch.com/data-explorer

SELECT
    s.symbol,
    p.companyName,
    s.piotroskiScore,
    f.priceToBookRatioTTM as price_to_book,
    k.marketCap / 1000000000 as market_cap_billions
FROM scores s
JOIN key_metrics_ttm k ON s.symbol = k.symbol
JOIN financial_ratios_ttm f ON s.symbol = f.symbol
JOIN profile p ON s.symbol = p.symbol
WHERE
    s.piotroskiScore >= 8
    AND k.marketCap > 1000000000
    AND p.exchange IN ('NYSE', 'NASDAQ', 'AMEX')
ORDER BY s.piotroskiScore DESC, f.priceToBookRatioTTM ASC
LIMIT 50
Finds all US-listed stocks scoring 8 or 9 with market cap above $1B. The pre-calculated score saves you from running nine separate queries.
Run this query on Ceta Research
Advanced Screen (Value + Quality)
-- Piotroski F-Score: Value + Quality Screen
-- Run at: cetaresearch.com/data-explorer

SELECT
    s.symbol,
    p.companyName,
    s.piotroskiScore,
    f.priceToBookRatioTTM as price_to_book,
    f.priceToEarningsRatioTTM as pe_ratio,
    k.currentRatioTTM,
    f.debtToEquityRatioTTM as debt_to_equity,
    k.returnOnEquityTTM * 100 as roe_pct,
    k.marketCap / 1000000000 as market_cap_billions
FROM scores s
JOIN key_metrics_ttm k ON s.symbol = k.symbol
JOIN financial_ratios_ttm f ON s.symbol = f.symbol
JOIN profile p ON s.symbol = p.symbol
WHERE
    s.piotroskiScore >= 7
    AND f.priceToBookRatioTTM > 0
    AND f.priceToBookRatioTTM < 1.5
    AND f.priceToEarningsRatioTTM > 0
    AND f.priceToEarningsRatioTTM < 20
    AND k.marketCap > 1000000000
    AND p.exchange IN ('NYSE', 'NASDAQ', 'AMEX')
    AND p.sector NOT IN ('Financial Services')
ORDER BY s.piotroskiScore DESC, f.priceToBookRatioTTM ASC
LIMIT 30
Adds price-to-book and P/E filters to match Piotroski's original value stock focus. Excludes financials where book value comparisons are less meaningful.
Run this query on Ceta Research
What We Found

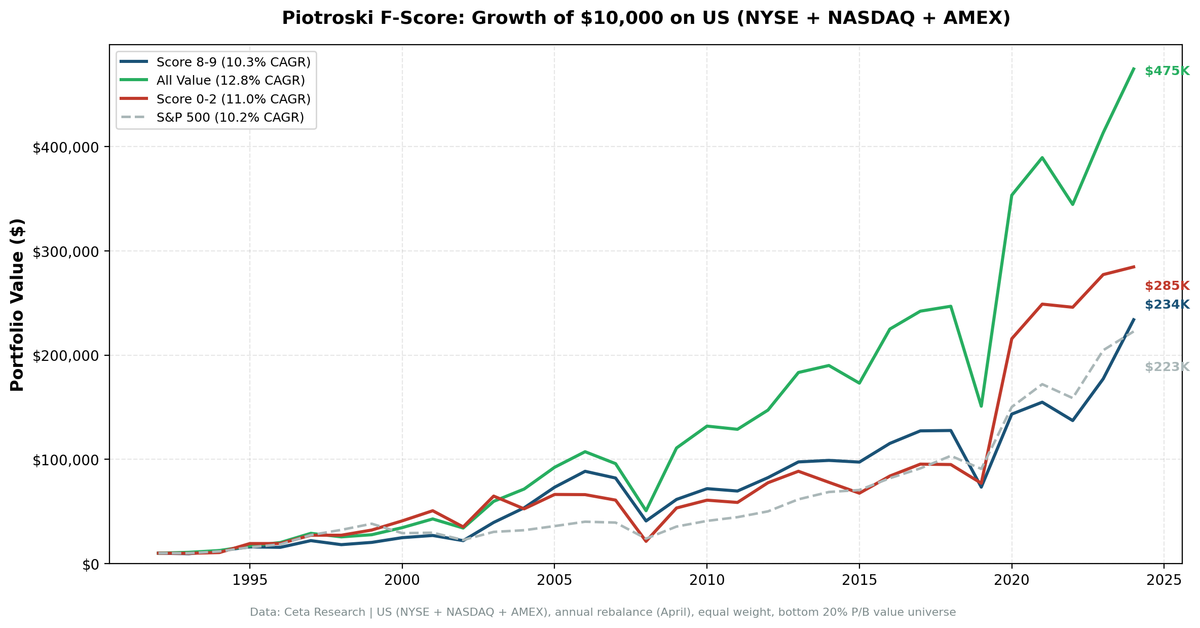
Growth of $1: Score 8-9 (high quality value), Score 0-2 (low quality value), All Value (bottom 20% P/B), and S&P 500. 1985-2025.
The headline: the raw return spread is slightly negative.
Score 8-9 stocks returned 10.6% annually. Score 0-2 stocks returned 10.9%. That's a -0.3% spread. If you stopped there, you'd dismiss the F-Score entirely. That would be a mistake.
| Portfolio | CAGR | Volatility | Sharpe | Sortino | Max Drawdown | % Negative Years |
|---|---|---|---|---|---|---|
| Score 8-9 | 10.6% | 29.0% | 0.297 | 0.657 | -51.6% | 30% |
| All Value | 12.8% | 35.1% | 0.306 | 0.867 | -50.5% | 25% |
| Score 0-2 | 10.9% | 46.2% | 0.193 | 0.615 | -66.0% | 38% |
| S&P 500 | 10.3% | 20.6% | 0.402 | 0.851 | -39.3% | 19% |
Three things stand out when you look beyond the CAGR line.
First: the risk profiles are dramatically different. Score 8-9 runs at 29.0% volatility. Score 0-2 runs at 46.2%. That's 59% more volatility for 0.3% more return. The Sharpe tells the real story: 0.297 for high scores vs 0.193 for low scores. Per unit of risk taken, high-quality value stocks deliver 54% more return.
Second: the drawdowns. Score 8-9's worst drawdown was -51.6%. Score 0-2 hit -66.0%. That's 14 extra percentage points of peak-to-trough loss. In 2008, a 14-point difference in drawdown is the difference between painful and catastrophic.
Third: negative years. Score 8-9 had negative returns 30% of the time. Score 0-2 was negative 38% of the time, with up to 3 consecutive losing years compared to 2 for high scores.
The F-Score is a risk filter, not a return booster.
This is the central finding. The F-Score doesn't reliably pick stocks that go up more. It picks stocks that go down less violently. In a value universe that already screens for cheapness, the F-Score separates the cheap-and-recovering from the cheap-and-deteriorating.
The avoidance signal matters more than the selection signal.
Breaking down the alpha relative to the all-value basket:
- Selection alpha (Score 8-9 vs All Value): -2.1% per year
- Avoidance alpha (All Value vs Score 0-2): +1.8% per year
The all-value basket beat both Score 8-9 and Score 0-2 on raw CAGR (12.8%). But Score 0-2 stocks came with 46.2% volatility and -66.0% max drawdown. Avoiding those stocks isn't about return. It's about survival. Low-score value stocks are classic value traps: cheap and getting worse.
The value factor itself works.
Before debating high vs low F-Scores, note that the all-value basket (bottom 20% P/B, market cap > $1B) returned 12.8% annually vs 10.3% for the S&P 500. That's +2.5% per year over 32 years. The value premium is alive in this data. The F-Score question is about filtering within that value universe.
Decade breakdown
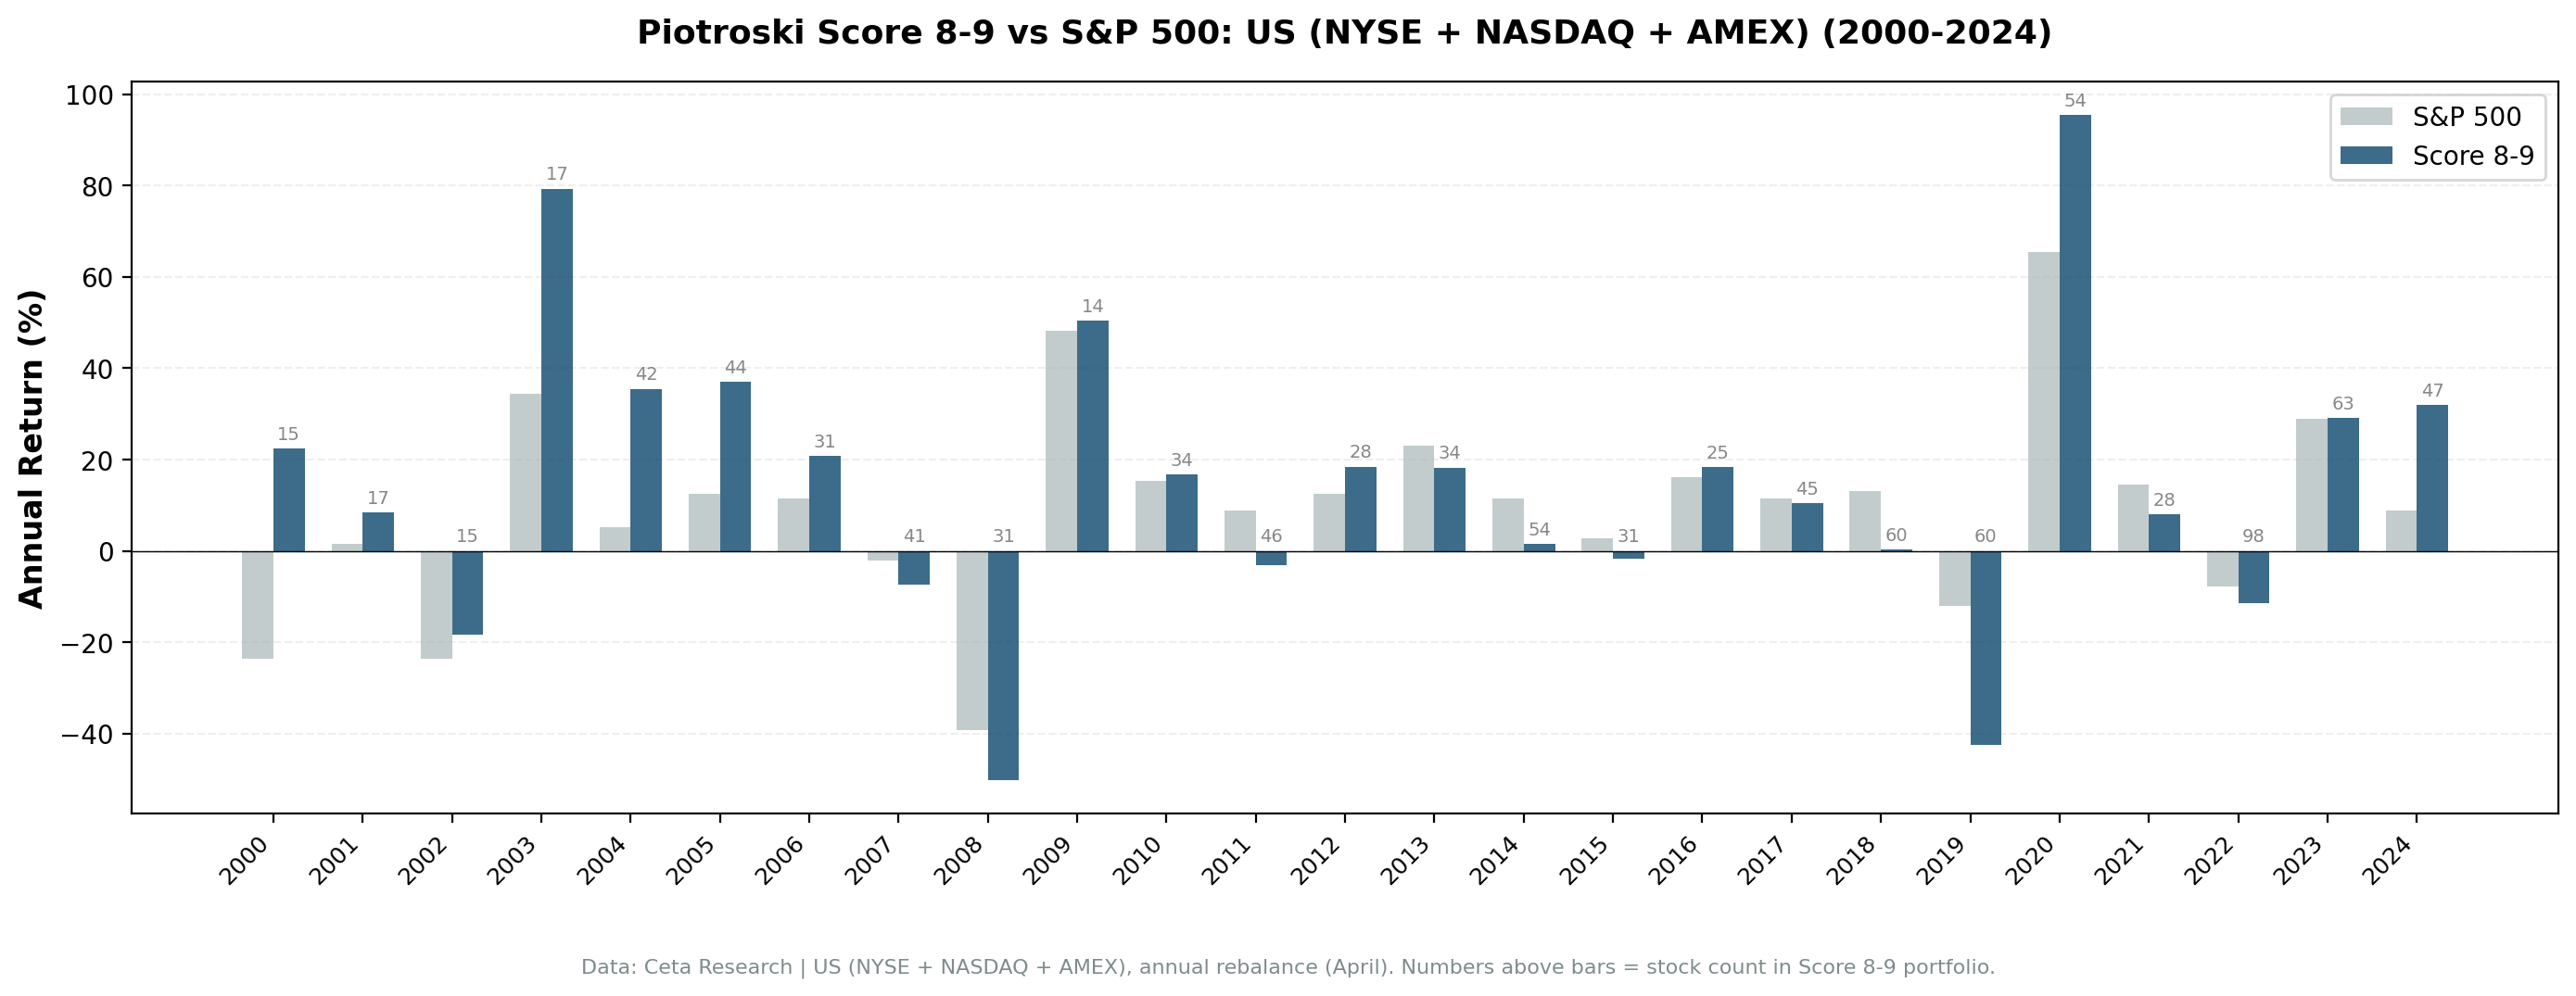
Annual returns by year. The spread between Score 8-9 and Score 0-2 varies widely, and Score 0-2 frequently wins on raw returns while taking far more risk.
| Decade | Score 8-9 Avg | Score 0-2 Avg | Spread |
|---|---|---|---|
| 1990s | 13.9% | 20.4% | -6.4% |
| 2000s | 17.6% | 17.2% | +0.4% |
| 2010s | 3.1% | 5.1% | -2.0% |
| 2020-25 | 30.8% | 42.5% | -11.7% |
The spread is negative in three of four decades. Score 0-2 stocks usually deliver higher average returns. But look at what happens in the bad years. In 2008, Score 8-9 lost -48.2% while Score 0-2 lost -62.9%. In 2019, Score 8-9 dropped -42.0% vs -17.7% for Score 0-2 (a rare reversal). The pattern isn't clean, and that's the point. Raw returns favor low scores. Risk-adjusted returns favor high scores.
The 2020-25 period tells the story clearly. Score 0-2 averaged 42.5% annually. Score 8-9 averaged 30.8%. But Score 0-2's path included wild swings: +181.1% in 2020 followed by -3.0% in 2022. Score 8-9 was more measured: +94.8% in 2020, then -11.3% in 2022.
Score 8-9 vs the S&P 500
| Metric | Value |
|---|---|
| Excess CAGR | +0.35% |
| Up Capture | 113.6% |
| Down Capture | 98.4% |
| Beta | 1.068 |
| Alpha | -0.21% |
Score 8-9 edges out the S&P 500 on raw return (+0.35% per year). The up capture of 113.6% vs down capture of 98.4% means the portfolio captures more of the upside and slightly less downside than SPY. The beta of 1.068 means you're taking slightly more market risk. The negative alpha (-0.21%) means after adjusting for that higher beta, you're roughly flat. This is a fair trade, not a free lunch.
Portfolio concentration
Post-2010, the Score 8-9 basket averaged about 25 stocks per year. Over the full period, the average was about 15 stocks per year. Earlier decades had fewer qualifying stocks because the value universe with the $1B market cap floor was smaller. This low stock count means the strategy carries meaningful concentration risk, especially in earlier periods.
When It Works and When It Struggles
Works well: - Bear markets and recoveries (2002-2005, 2008-2010). Financially sound cheap stocks survive and recover. Weak ones don't. - Flat or choppy markets where fundamental quality separates winners from losers within a cheap universe.
Struggles: - Speculative rallies (2009, 2020). After sharp crashes, the lowest-quality stocks bounce hardest because they fell the most. Score 0-2 stocks returned +134.7% in 2009 vs +45.2% for Score 8-9. The junkiest names have the most room to recover. - Sustained bull markets where everything goes up and quality doesn't matter.
The market cap constraint matters. Piotroski's original research focused on small and micro-cap value stocks, where the F-Score effect was strongest. Our $1B market cap threshold restricts the universe to large-cap value, where the effect is documented to be weakest. Institutional coverage, analyst attention, and market efficiency all reduce the informational advantage of the F-Score in large caps.
Run This Screen Yourself
The current Piotroski screen for US stocks is live on Ceta Research:
cetaresearch.com/data-explorer
The screen runs on live FMP data. Results update as new annual filings come in.
Reproduce the backtest
Full backtest code is on GitHub: ceta-research/backtests
git clone https://github.com/ceta-research/backtests.git
cd backtests
pip install -r requirements.txt
export CR_API_KEY="your_key_here"

# Run the Piotroski screen on current data
python3 piotroski/screen.py

# Run the full backtest
python3 piotroski/backtest.py --preset us --verbose
Limitations
Large-cap bias. The $1B market cap floor puts this squarely in large-cap territory. Piotroski's original edge was strongest in small and micro caps where information asymmetry is greatest. Our results understate the effect as documented in the academic literature.
Backward-looking. The F-Score measures what happened last year. It doesn't predict disruption, regulatory changes, or competitive shifts.
Equal weighting of criteria. A 0.1% improvement in gross margin gets the same point as doubling cash flow. Not all improvements are equal.
Negative raw spread. The -0.3% CAGR spread (Score 8-9 vs Score 0-2) means the F-Score doesn't generate return alpha in large-cap US value. The case rests entirely on risk reduction. If you care only about maximizing CAGR and can stomach 46.2% volatility and -66.0% drawdowns, the F-Score isn't helping you.
Concentration risk. With an average of about 15 stocks per year (25 post-2010), the portfolio is concentrated. Single-stock outcomes can move the annual return substantially.
No sector balancing. The screen doesn't control for sector concentration. Some years may over-weight a single industry.
References
- Piotroski, J. (2000). "Value Investing: The Use of Historical Financial Statement Information to Separate Winners from Losers." Journal of Accounting Research, 38 (suppl.), 1-41.
- Asness, C., Frazzini, A. & Pedersen, L. (2019). "Quality Minus Junk." Review of Financial Studies, 32(4), 1474-1515.
- Fama, E. & French, K. (1993). "Common Risk Factors in the Returns on Stocks and Bonds." Journal of Financial Economics, 33(1), 3-56.
Data: Ceta Research, FMP financial data. US exchanges (NYSE, NASDAQ, AMEX). Backtest: 1985-2025 (32 years), annual rebalance (April 1), equal weight, value universe (bottom 20% P/B, market cap > $1B). Transaction costs: 0.1-0.5% per trade (size-tiered).


