
Piotroski F-Score in Australia: Weak Signal, Strong Avoidance

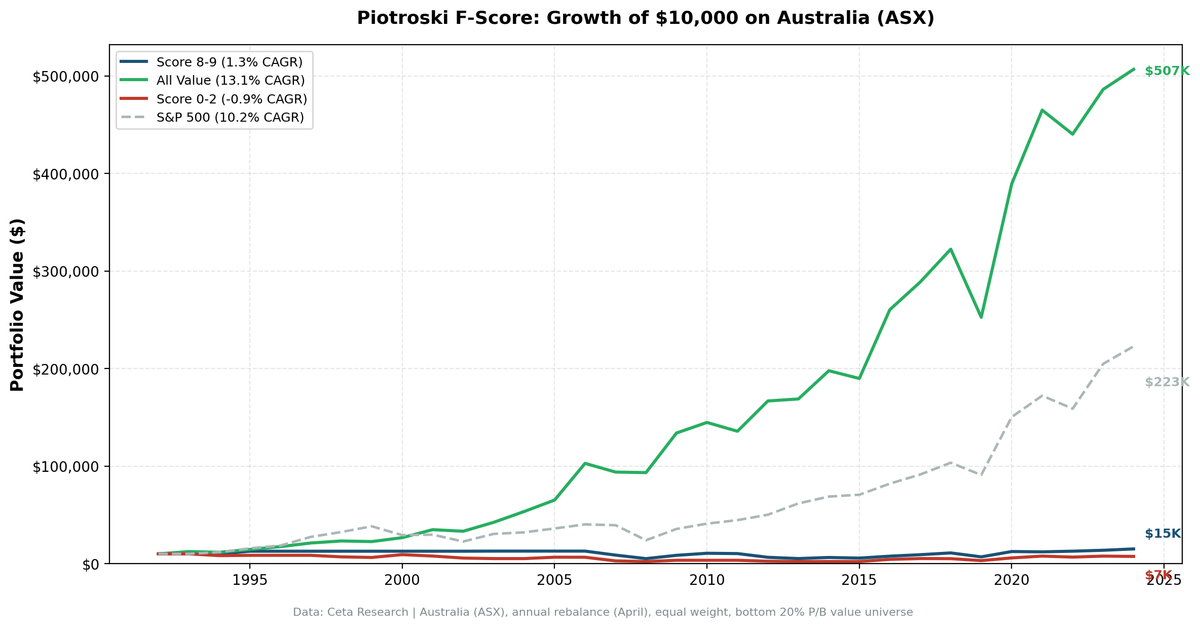
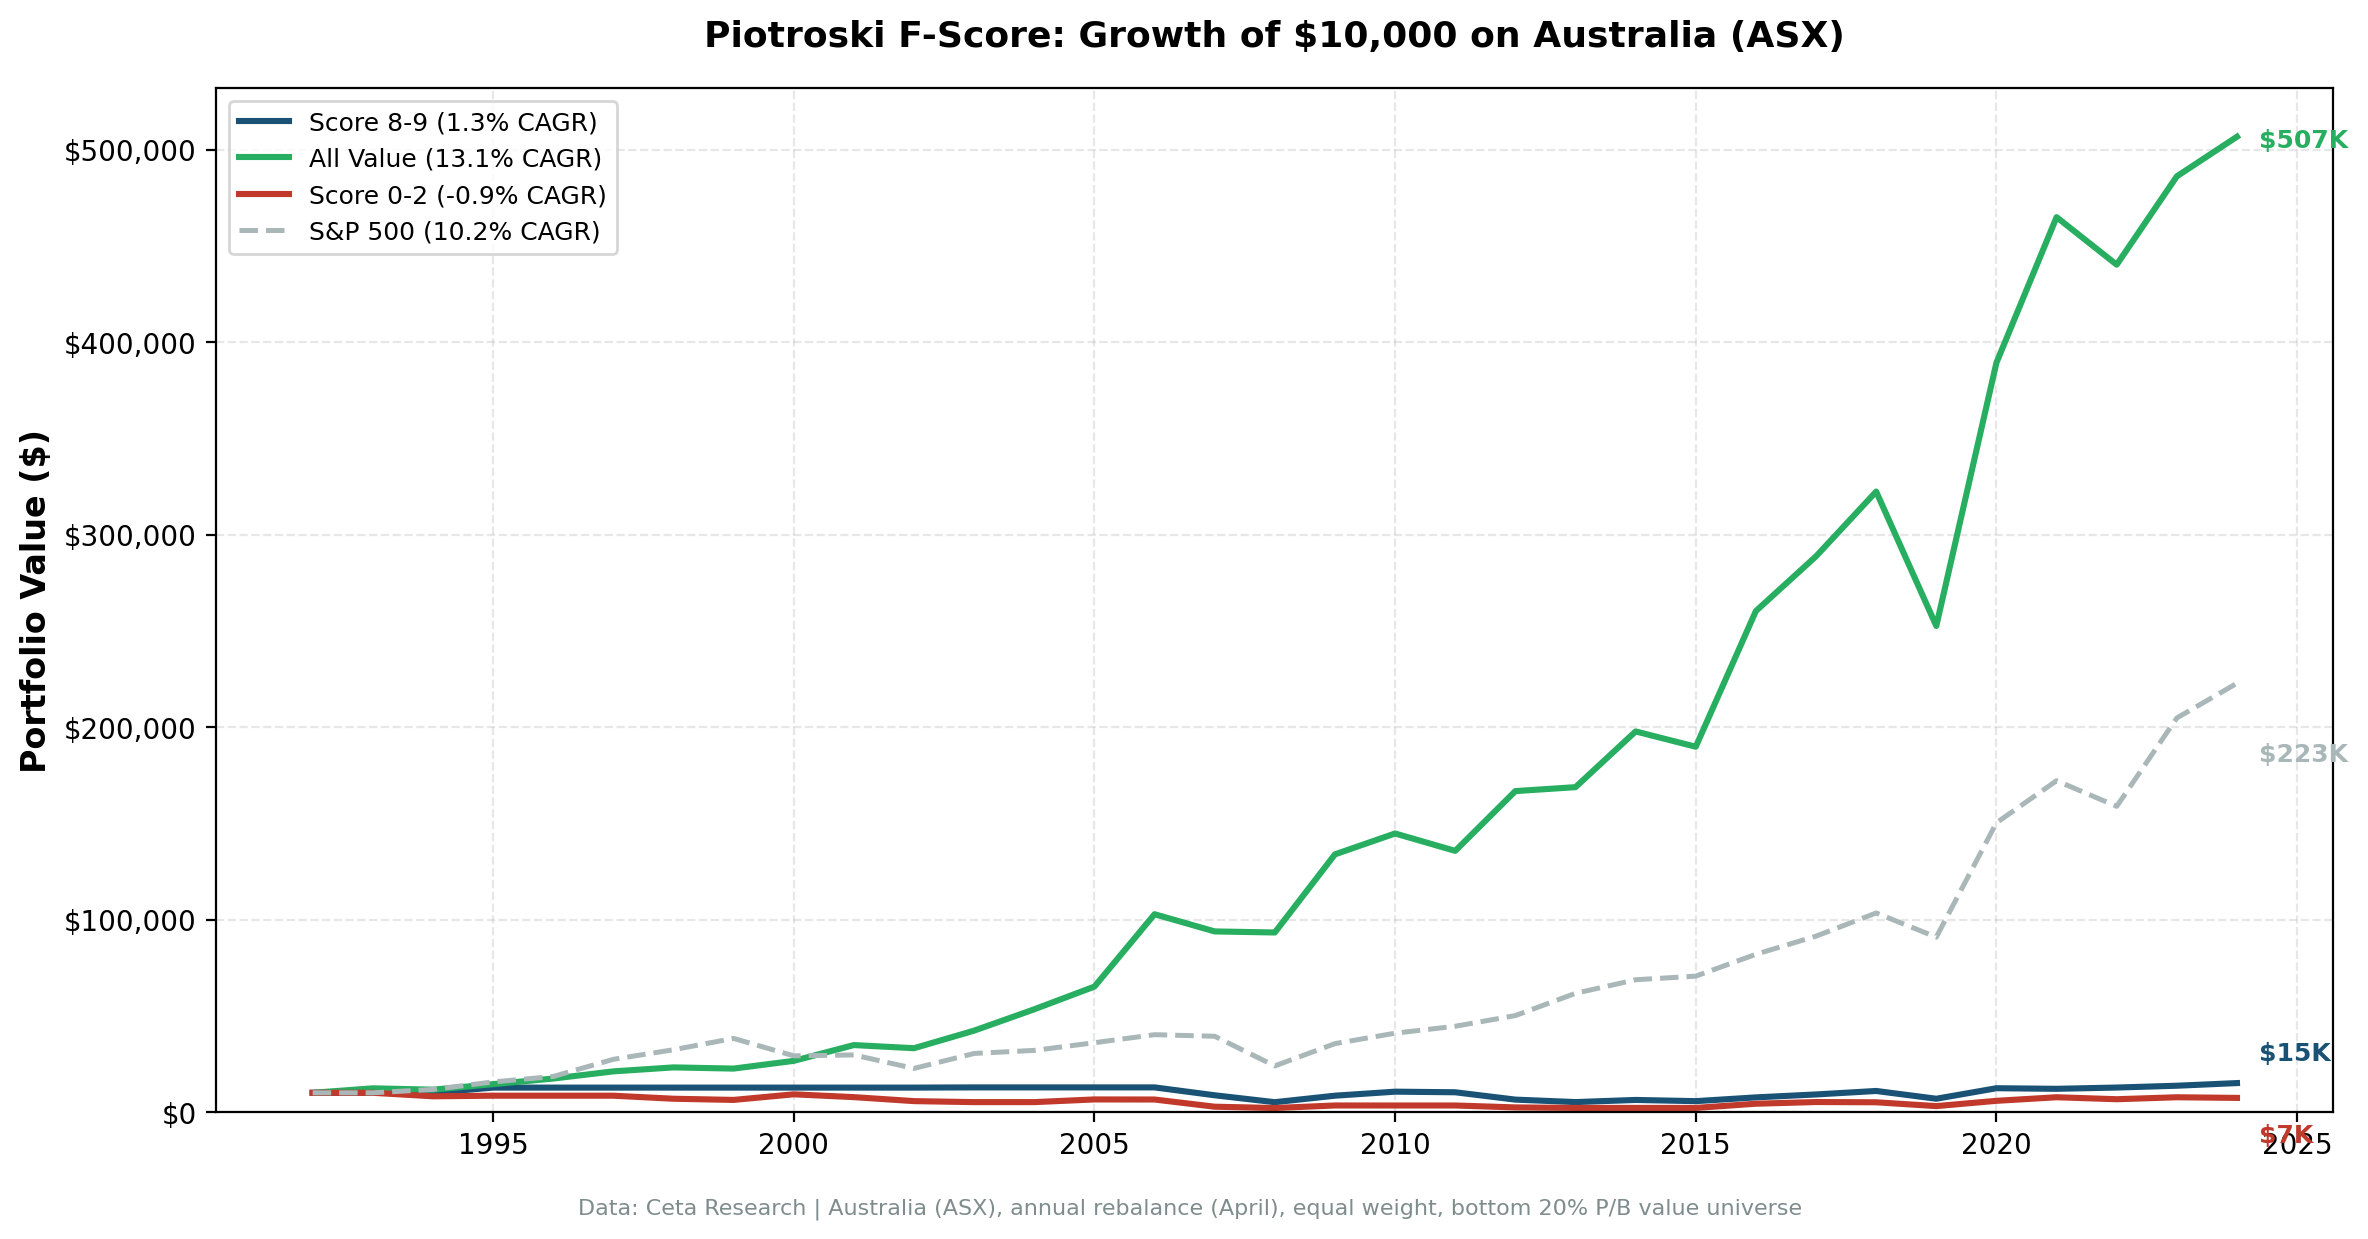
Australia is the clearest example of the Piotroski F-Score working purely as a risk filter. Over 32 years on the ASX, Score 8-9 stocks returned just 1.5% annually, trailing the ASX 200 (4.9%) by -3.5%. The unfiltered value universe returned 13.0%. That's an enormous -11.5% selection gap. The F-Score is terrible at picking Australian winners.
Contents
- Method
- What We Found
- Alpha decomposition
- What's happening on the ASX
- Using the F-Score on ASX
- Part of a Series
- Limitations
But Score 0-2 stocks returned -0.7% per year. Negative absolute returns over three decades. The avoidance alpha is +13.7%, the strongest of any market we tested. The F-Score can't tell you what to buy in Australia. It can tell you what to run from.
Method
Data source: Ceta Research (FMP financial data warehouse) Universe: ASX-listed stocks, value universe (bottom quintile by price-to-book), market cap above local threshold Time period: 32 years (1993-2025) Rebalancing: Annual (April, after annual reports) Execution: Next-day close (MOC) Benchmarks: All value stocks (same universe, unfiltered), ASX 200 Avg holdings post-2010: 74 stocks per year
Same methodology as our US study.
What We Found
| Portfolio | CAGR | Volatility | Sharpe Ratio | Max Drawdown |
|---|---|---|---|---|
| Score 8-9 | 1.5% | 25.9% | -0.079 | -56.8% |
| Score 0-2 | -0.7% | n/a | n/a | n/a |
| All value stocks | 13.0% | n/a | n/a | n/a |
| ASX 200 | 4.9% | n/a | n/a | n/a |
The headline number is the All Value CAGR of 13.0%. Australian value stocks as a group crushed the ASX 200 over 32 years. The problem is that the F-Score selects the wrong ones. Score 8-9 managed just 1.5% with a negative Sharpe ratio (-0.079) and a -56.8% max drawdown.
Alpha decomposition
- Selection alpha: -11.5% per year (Score 8-9 vs All value)
- Avoidance alpha: +13.7% per year (All value vs Score 0-2)
That +13.7% avoidance figure is extreme. It means Score 0-2 Australian value stocks destroyed capital at a rate of -0.7% annually while the broad value universe returned 13.0%. These aren't just underperformers. They're wealth destroyers.
The spread between Score 8-9 and Score 0-2 is +2.2%, which is positive. High scores beat low scores. But both trail the unfiltered universe by a wide margin.
What's happening on the ASX
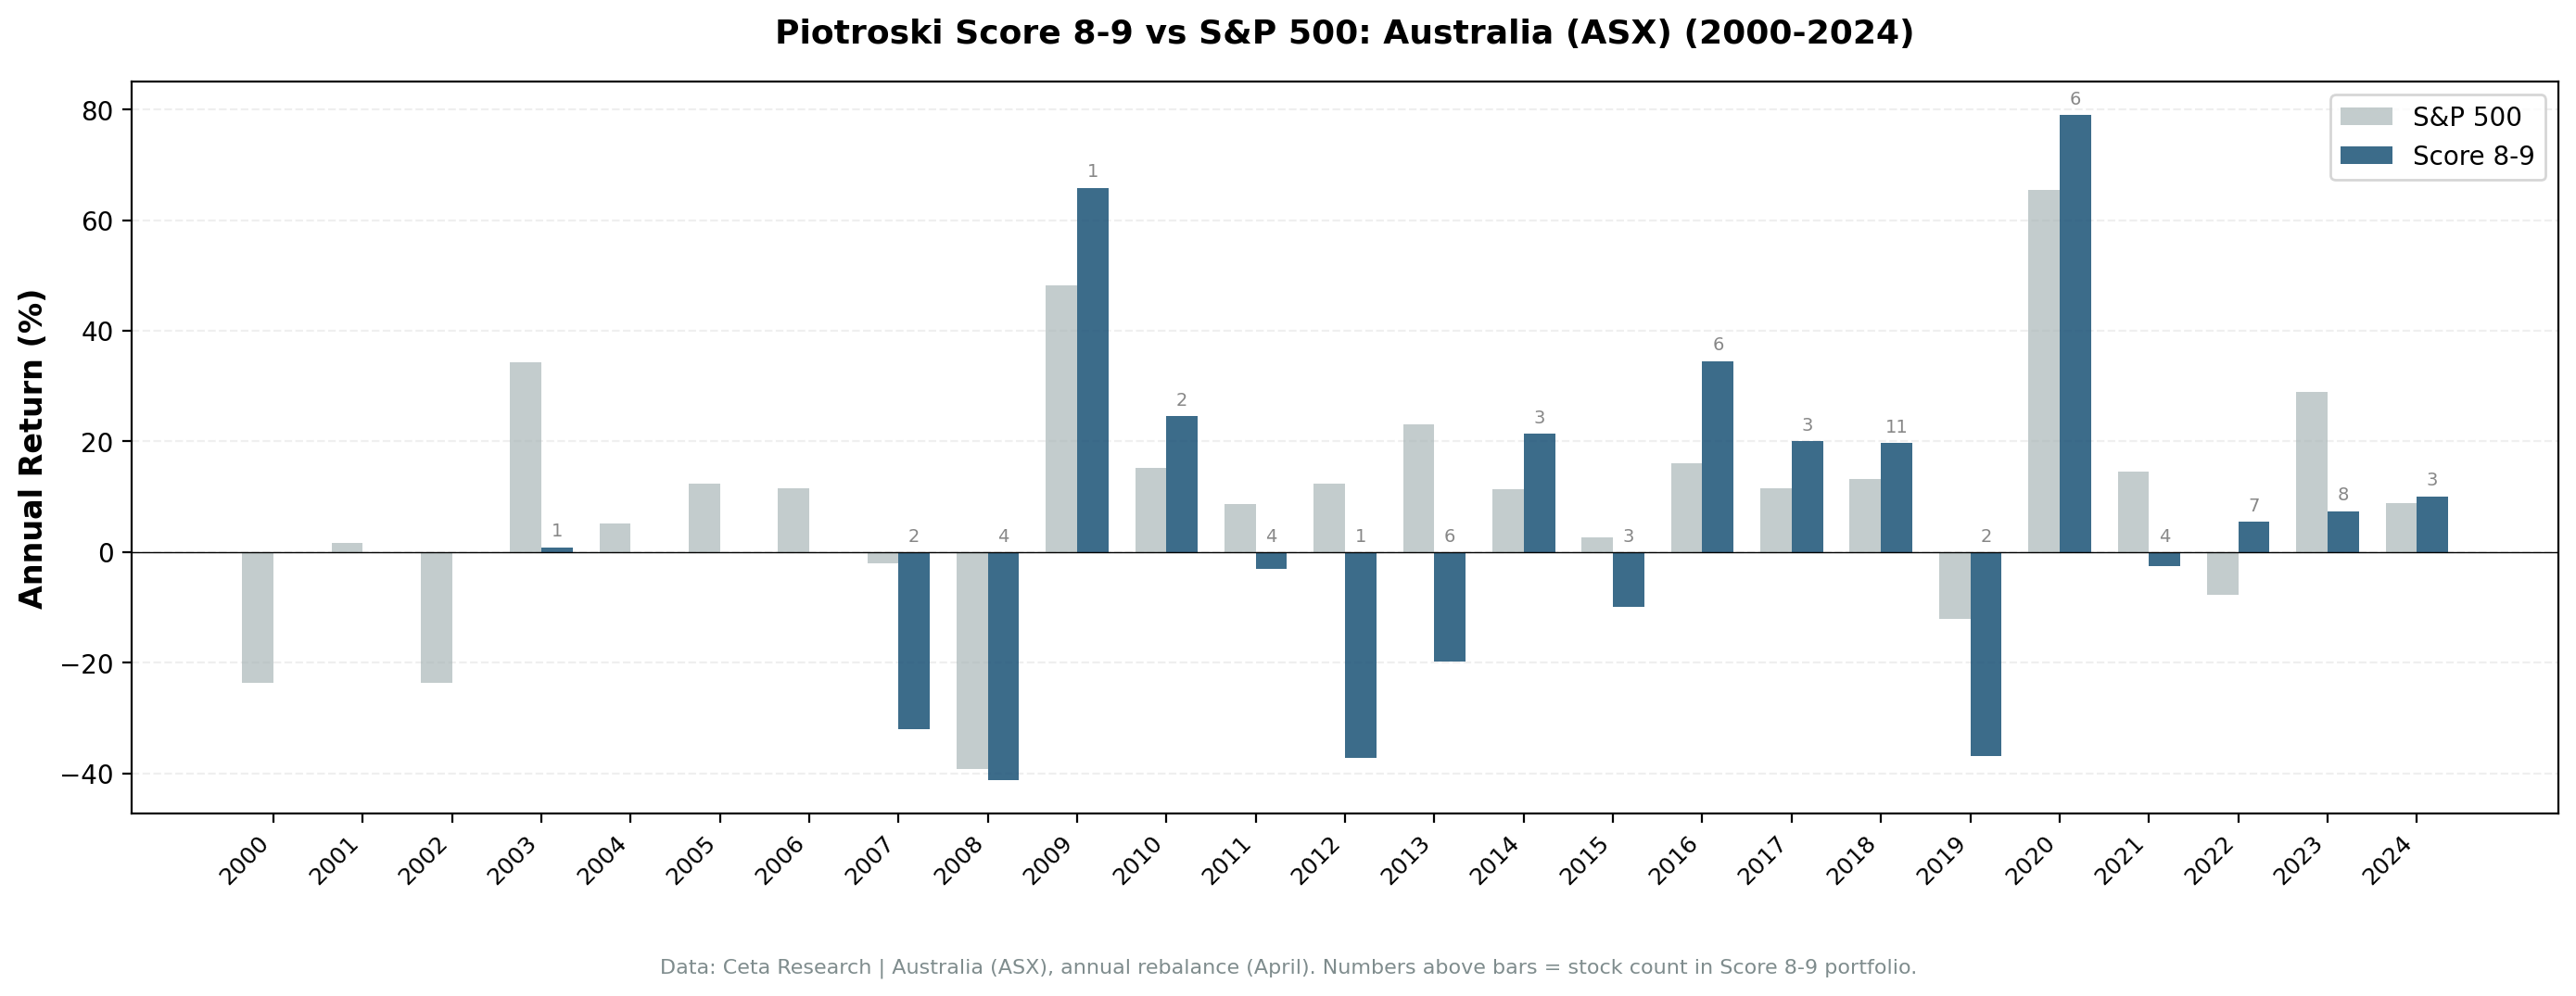
Australia has 74 qualifying stocks per year post-2010. That's the deepest pool of any market in this study. More stocks means more diversification, which explains the lower Score 8-9 volatility (25.9%). But it also means the F-Score is applying its nine binary tests across a wide range of industries and company types, many of which don't respond to the signals the way US value stocks do.
The ASX is dominated by mining, materials, and financials. Mining companies cycle through boom and bust periods where financial statement signals lag reality by 12-18 months. A miner with an F-Score of 9 may be at peak earnings, about to decline. A miner with an F-Score of 1 may be at trough earnings, about to recover.
This cyclical mismatch explains why the F-Score's selection signal is the worst of any market we tested (-11.5%). The annual rebalance with backward-looking financial data systematically buys at the wrong point in the commodity cycle.
Using the F-Score on ASX
Despite the terrible selection signal, there's a practical application. Score 0-2 stocks returned -0.7% annually. That's negative absolute returns sustained over 32 years. Any Australian value investor can improve outcomes by adding a simple rule: if the F-Score is 0, 1, or 2, don't buy it.
You don't need to restrict to Score 8-9. A minimum threshold of 3 or 4 would filter out the worst performers without concentrating the portfolio into the F-Score's blind spots at the top end.
Part of a Series
This is one of several regional Piotroski F-Score studies. The US analysis shows a nuanced risk-vs-return story: Piotroski F-Score: 32 Years of Data on a 9-Point Quality Checklist.
Australia's pattern (weak selection, strong avoidance) is the most extreme version of a trend we see across multiple exchanges. See our global comparison for how all nine markets compare.
Limitations
Mining-heavy universe. ASX value stocks are heavily concentrated in materials and mining. The F-Score's backward-looking signals systematically mistime cyclical sectors.
AUD-denominated returns. All returns are in local currency. The Australian dollar has had significant swings against USD over the study period.
Deep pool, mixed quality. 74 stocks per year provides diversification but also includes many small-cap miners and resource companies where financial statement data may be less standardized.
No survivorship adjustment for delistings. ASX has significant delisting activity, especially among small-cap miners. While delisted stocks are included where data exists, coverage gaps in earlier periods may affect results.
Data: Ceta Research, FMP financial data. ASX, 32 years, annual rebalance, equal weight, value universe (bottom P/B quintile). Past performance does not guarantee future results. Educational content only, not investment advice.


