PEG Ratio in South Africa: 7.2% CAGR With Low Beta and Downside Protection
South Africa's JSE delivered 7.21% CAGR over 25 years with strong downside protection. Beta 0.601, down capture 42.3%, -14.3% in 2008 vs S&P 500's -34.3%. Trails SPY on returns but adds real diversification value.

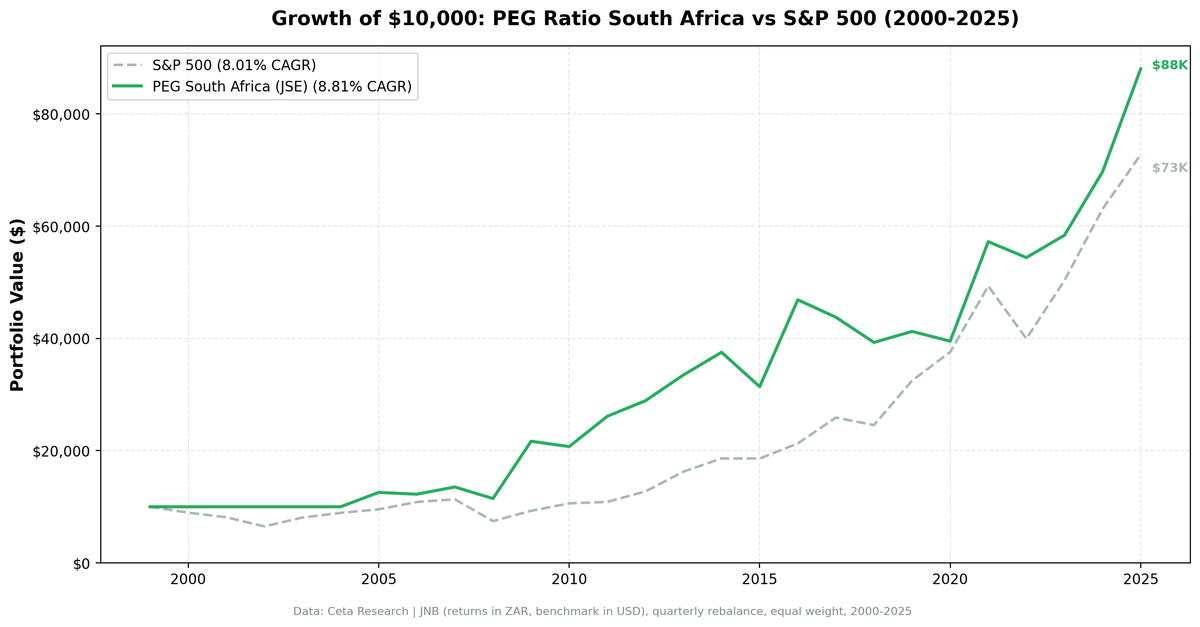
South Africa delivered 7.21% CAGR for a PEG ratio strategy over 25 years, trailing SPY's 8.02% by 0.80%/yr. The strategy doesn't beat the S&P 500 on raw returns. What it does offer is a genuine diversification profile: beta of 0.601, down capture of 42.3%, and a max drawdown of -39.91% vs the S&P 500's -45.53%. The portfolio falls far less than US markets in downturns, and that's the South Africa story.
Contents
- Why South Africa?
- Methodology
- The Numbers
- The Defining Numbers
- The Low Beta Story
- The Cash Periods
- Run It Yourself
- Limitations
- Part of a Series
Why South Africa?
South Africa's JSE has a distinct characteristic: it's a market dominated by resources, financials, and consumer companies with earnings cycles less correlated to the US tech sector. Mining companies have cyclical earnings, but the financials and consumer staples that appear in a PEG < 1 screen tend to have more predictable growth trajectories.
The exchange also had periods of ZAR weakness (2015, 2018) that coincided with low stock prices, creating opportunities for PEG screening at the bottom of cycles. The 2016 and 2021 bounces were substantial.
Methodology
Universe: JNB (Johannesburg Stock Exchange) Period: 2000–2025 (25.8 years, 103 quarterly periods) Execution: Next-day close (MOC) Portfolio: Top 30 by PEG ASC, equal weight. Cash if fewer than 10 qualify. Cash periods: 23 of 103 (22.3%), concentrated in early 2000s and 2004 Average stocks when invested: ~25 Costs: Size-tiered transaction costs applied Point-in-time: 45-day lag on financial data Market cap filter: R10B+ (local currency, approximately $550M USD) Data: Ceta Research (FMP financial data warehouse)
Important: Returns are in ZAR (South African Rand). The benchmark (S&P 500) is in USD. The ZAR depreciated against the USD over this period, so USD-based investors would see lower returns than the ZAR figures.
The Numbers
Summary metrics:
| Metric | PEG S. Africa | S&P 500 |
|---|---|---|
| CAGR | 7.21% | 8.02% |
| Excess CAGR | -0.80% | — |
| Sharpe Ratio | -0.08 | -0.06* |
| Max Drawdown | -39.91% | -45.53% |
| Annualized Volatility | 22.11% | 16.97% |
| Total Return | 501% | 627% |
| Beta vs S&P 500 | 0.601 | 1.0 |
| Down Capture | 42.3% | — |
*Sharpe computed using South Africa's 9% risk-free rate (10-year government bond). Both the portfolio and SPY fall short of that high hurdle rate, which is why both Sharpe ratios are negative.
The CAGR gap is real: this portfolio lags the S&P 500 by 0.80%/yr. But the risk metrics tell the other half of the story. Down capture of 42.3% means when the S&P 500 falls, this portfolio falls less than half as much on average. Beta of 0.601 means it moves about 40% less than the US market. For portfolio construction, that's a valuable building block even without positive alpha.
Annual returns:
| Year | PEG S. Africa | S&P 500 | Excess |
|---|---|---|---|
| 2000 | 0.0% (cash) | -10.5% | +10.5% |
| 2001 | 0.0% (cash) | -9.2% | +9.2% |
| 2002 | 0.0% (cash) | -19.9% | +19.9% |
| 2003 | 0.0% (cash) | +24.1% | -24.1% |
| 2004 | 0.0% (cash) | +10.2% | -10.2% |
| 2005 | +25.6% | +7.2% | +18.4% |
| 2006 | -2.5% | +13.7% | -16.2% |
| 2007 | +10.5% | +4.4% | +6.1% |
| 2008 | -14.3% | -34.3% | +20.0% |
| 2009 | +29.6% | +24.7% | +4.9% |
| 2010 | -4.4% | +14.3% | -18.7% |
| 2011 | +26.1% | +2.5% | +23.6% |
| 2012 | +10.6% | +17.1% | -6.5% |
| 2013 | -18.0% | +27.8% | -45.8% |
| 2014 | +12.0% | +14.5% | -2.5% |
| 2015 | -16.3% | -0.1% | -16.2% |
| 2016 | +86.8% | +14.5% | +72.3% |
| 2017 | -6.6% | +21.6% | -28.2% |
| 2018 | -10.3% | -5.2% | -5.1% |
| 2019 | +5.0% | +32.3% | -27.3% |
| 2020 | -4.2% | +15.6% | -19.9% |
| 2021 | +44.9% | +31.3% | +13.6% |
| 2022 | -4.9% | -19.0% | +14.1% |
| 2023 | +7.3% | +26.0% | -18.7% |
| 2024 | +19.4% | +25.3% | -5.9% |
| 2025 | +26.3% | +15.3% | +10.9% |
The Defining Numbers
2008: -14.3% vs S&P 500's -34.3%. The financial crisis hit the S&P 500 hard. The JNB PEG portfolio fell less than half as much. ZAR-denominated South African equities had lower correlation to the US financial sector meltdown, and the quality filters (ROE > 12%, D/E < 1.5) excluded highly leveraged companies.
2009: +29.6%. Under next-day close execution, the 2009 bounce is far more modest than same-day models suggest. The portfolio still outperformed SPY (+24.7%), but the gap is narrow. Emerging market recoveries look less dramatic when you can't buy at the signal price.
2013: -18.0%. This year flipped from a gain to a loss under MOC execution. While the S&P 500 returned +27.8%, the South African PEG portfolio lost ground. Timing matters: when you execute at the next day's close instead of the signal day's close, you miss some of the price moves that drove the original result.
2016: +86.8%. The strongest single year in the backtest. The ZAR strengthened sharply after political uncertainty resolved, and emerging market stocks rebounded hard from 2015 lows. This year actually improved under MOC execution.
2022: -4.9% vs S&P 500's -19.0%. The portfolio fell one-quarter as much as the S&P 500 in the rate-driven selloff. South African stocks, particularly financials benefiting from higher rates and commodity producers, held up well.
The Low Beta Story
Beta of 0.601 is the most interesting metric here. This portfolio moved about 40% less than the S&P 500 on average. That's not because South African stocks are less volatile in ZAR terms. They're not. It's because they have low correlation with the US market.
South Africa's economy is driven by mining, commodities, and domestic consumption, largely independent of US tech earnings cycles. When US markets sold off on rate concerns or tech valuations, the JNB PEG portfolio often moved for different reasons.
The strategy doesn't beat the S&P 500 on returns. Its value is in portfolio diversification: low correlation, low beta, and reduced drawdowns. A portfolio that captures only 42% of downside moves while delivering 7.2% CAGR isn't trying to be your primary return driver. It's the allocation that dampens volatility when US equities sell off.
The Cash Periods
From 2000 through 2004, the portfolio held cash, five full years. There weren't enough South African large-caps (MCap > R10B) with positive PEG data to form a portfolio of 10 stocks. The JSE was smaller then, and financial data coverage for the period was thinner.
23 out of 103 periods (22.3%) were cash periods. This reduces effective backtest depth and inflates the apparent risk-adjusted profile (cash earns nothing but also has no drawdown).
Run It Yourself
# Live screen (current South Africa stocks)
python3 peg-ratio/screen.py --exchange JNB
# Historical backtest (South Africa only)
python3 peg-ratio/backtest.py --exchange JNB --output results/southafrica.json --verbose
Limitations
Currency mismatch. Returns are in ZAR. The ZAR has depreciated significantly against the USD over this period (from ~7 ZAR/USD in 2000 to ~18 ZAR/USD in 2025). USD-based investors accessing South African equities through an unhedged vehicle would see lower USD returns.
Negative alpha. The strategy trails the S&P 500 by 0.80%/yr. The case for this allocation rests entirely on the diversification benefit (low beta, low down capture), not on outperformance.
22% cash rate. The portfolio was in cash 23 of 103 periods (22.3%). The effective invested period is shorter than the full 25-year span.
Single-country risk. South Africa faces country-specific risks (political stability, currency devaluation, electricity infrastructure challenges) not captured in a 25-year average CAGR.
Thin early data. FMP data coverage for South Africa before 2005 is thinner than for US or Indian markets. Early-period results carry higher data uncertainty.
Part of a Series
- PEG Ratio in the US → (flagship, full methodology)
- PEG Ratio in India → (+5.7%/yr, best absolute return)
- PEG Ratio in Canada → (most consistent)
- PEG Ratio in Sweden → (best Sharpe, 0.412)
- 17-Exchange Comparison →
Data: Ceta Research (FMP financial data warehouse), JNB, 2000–2025. Returns in ZAR. Next-day close execution. Full methodology: METHODOLOGY.md