PEG Ratio in India: 13.7% CAGR Over 25 Years (+2.6%/yr vs Sensex)
India is the strongest PEG ratio market we tested. 13.68% CAGR over 25 years, +2.6%/yr vs the Sensex. The ride was violent, -65% in 2008, +102% in 2009. Here's the full data.

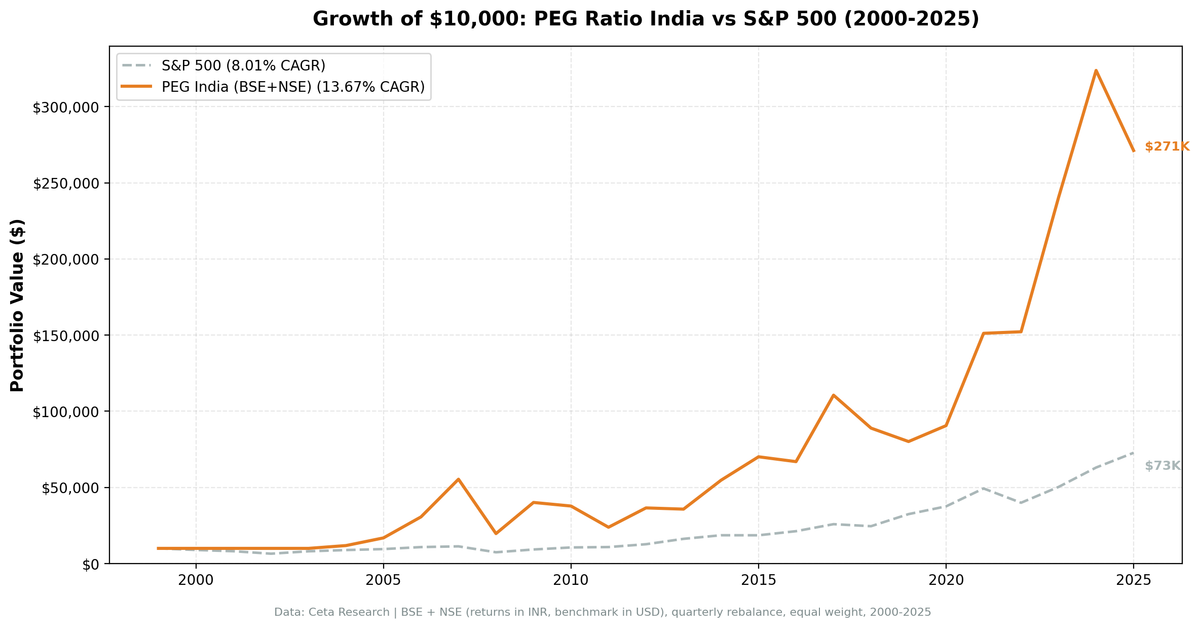
India is the best PEG ratio market we tested. Over 25 years, a quarterly-rebalanced portfolio of India's lowest-PEG stocks returned 13.68% CAGR. The Sensex returned 11.12% over the same period. That's a 2.56% annual advantage, measured against the correct local benchmark.
Contents
- Why India?
- Methodology
- The Numbers
- What Drove the Returns
- The Cash Periods Problem
- Run It Yourself
- Limitations
- Part of a Series
The catch: the ride was violent. India's market dropped 65% in 2008 and 37% in 2011. If you held, the recoveries were equally dramatic. +101.8% in 2009, +65.4% in 2021.
Why India?
The PEG ratio screens for profitable companies growing faster than their price implies. India's mid-cap landscape has provided this at scale: an expanding middle class, infrastructure build-out, financial sector growth, and IT services dominance gave Indian companies real structural growth. PEG < 1 within that context wasn't picking cheap cyclicals (the US problem). It was picking genuinely undervalued growers.
The Indian equity market also had less analyst coverage in the early 2000s, which created more pricing inefficiency. Large institutions were slower to arrive. The PEG screen captured that window.
Methodology
Universe: BSE + NSE (Bombay Stock Exchange + National Stock Exchange of India) Period: 2000–2025 (25.8 years, 103 quarterly periods) Portfolio: Top 30 by PEG ASC, equal weight. Cash if fewer than 10 qualify. Execution: Next-day close (market-on-close) Costs: Size-tiered transaction costs applied Point-in-time: 45-day lag on financial data Market cap filter: ₹20B+ (local currency, ≈ $240M USD) Benchmark: Sensex (^BSESN) Data: Ceta Research (FMP financial data warehouse)
Both portfolio and benchmark are INR-denominated. No currency mismatch.
Signal SQL:
SELECT f.symbol, p.companyName, p.exchange,
    ROUND(f.priceToEarningsGrowthRatioTTM, 3) AS peg_ratio,
    ROUND(f.priceToEarningsRatioTTM, 2) AS pe_ratio,
    ROUND(k.returnOnEquityTTM * 100, 1) AS roe_pct,
    ROUND(f.debtToEquityRatioTTM, 2) AS debt_to_equity,
    ROUND(k.marketCap / 1e9, 2) AS mktcap_b
FROM financial_ratios_ttm f
JOIN key_metrics_ttm k ON f.symbol = k.symbol
JOIN profile p ON f.symbol = p.symbol
WHERE f.priceToEarningsGrowthRatioTTM > 0
  AND f.priceToEarningsGrowthRatioTTM < 1.0
  AND f.priceToEarningsRatioTTM BETWEEN 8 AND 30
  AND k.returnOnEquityTTM > 0.12
  AND f.debtToEquityRatioTTM BETWEEN 0 AND 1.5
  AND k.marketCap > 20000000000
  AND p.exchange IN ('BSE', 'NSE')
QUALIFY ROW_NUMBER() OVER (PARTITION BY f.symbol
    ORDER BY f.priceToEarningsGrowthRatioTTM ASC) = 1
ORDER BY peg_ratio ASC
LIMIT 30
The Numbers
Summary metrics:
| Metric | PEG India | Sensex |
|---|---|---|
| CAGR | 13.68% | 11.12% |
| Excess CAGR | +2.56% | — |
| Sharpe Ratio | 0.224 | — |
| Sortino Ratio | 0.392 | — |
| Max Drawdown | -66.11% | — |
| Annualized Volatility | 32.01% | — |
| Total Return | 2,614% | — |
| Beta vs Sensex | 1.036 | 1.0 |
| Down Capture | 101.7% | — |
Annual returns:
| Year | PEG India | Sensex | Excess |
|---|---|---|---|
| 2000 | 0.0% (cash) | -25.2% | +25.2% |
| 2001 | 0.0% (cash) | -18.7% | +18.7% |
| 2002 | 0.0% (cash) | +2.9% | -2.9% |
| 2003 | 0.0% (cash) | +79.1% | -79.1% |
| 2004 | +17.0% | +10.8% | +6.2% |
| 2005 | +42.1% | +40.6% | +1.5% |
| 2006 | +80.7% | +48.5% | +32.2% |
| 2007 | +82.7% | +46.8% | +35.9% |
| 2008 | -64.6% | -51.3% | -13.3% |
| 2009 | +101.8% | +76.3% | +25.5% |
| 2010 | -4.1% | +17.1% | -21.2% |
| 2011 | -36.8% | -24.5% | -12.3% |
| 2012 | +53.0% | +27.0% | +26.0% |
| 2013 | -5.5% | +6.0% | -11.5% |
| 2014 | +58.7% | +33.5% | +25.2% |
| 2015 | +24.9% | -8.1% | +33.0% |
| 2016 | -1.7% | +3.8% | -5.5% |
| 2017 | +62.3% | +27.1% | +35.2% |
| 2018 | -20.6% | +6.1% | -26.7% |
| 2019 | -6.8% | +16.0% | -22.8% |
| 2020 | +12.1% | +15.7% | -3.6% |
| 2021 | +65.4% | +22.8% | +42.6% |
| 2022 | +0.1% | +3.4% | -3.3% |
| 2023 | +58.6% | +17.5% | +41.1% |
| 2024 | +38.8% | +11.2% | +27.6% |
| 2025 | -17.5% | +1.6% | -19.1% |
What Drove the Returns
The India growth story (2004–2007): India's economy expanded 8-9% annually. IT outsourcing boomed. Consumer spending accelerated. Infrastructure investment began. The Sensex went from 3,000 in early 2003 to 20,000 by early 2008. Our PEG portfolio captured that with +17.0%, +42.1%, +80.7%, and +82.7% in successive years, beating the Sensex each year.
The crash and recovery (2008–2009): The PEG portfolio fell harder than the Sensex in 2008 (-64.6% vs -51.3%). Small and mid-cap quality names got hit disproportionately as capital fled emerging markets. But the recovery was strong: +101.8% in 2009 vs Sensex +76.3%. The companies in our portfolio (mid-to-large cap, quality, profitable) survived and rebounded faster than the index.
Modi election (2014): India elected Narendra Modi in May 2014 on a pro-growth, anti-corruption platform. The market responded. Our portfolio returned +58.7% vs the Sensex's +33.5%. Infrastructure stocks, banks, and consumer companies all moved.
COVID recovery (2020–2021): India's markets collapsed then recovered. 2020: +12.1% (slightly below Sensex's +15.7%). 2021: +65.4% vs Sensex +22.8%. The 2021 surge was driven by liquidity, digital economy acceleration, and IPO market reopening.
The 2018-2019 drag: Two consecutive losing years (-20.6%, -6.8%) while the Sensex returned +6.1% and +16.0%. This coincided with slow Indian corporate earnings growth, the NBFC credit crisis, and a rotation away from mid-cap value names.
The Cash Periods Problem
From 2000 through 2003, the portfolio held cash. There weren't enough Indian large-caps (MCap > ₹20B) with positive PEG data on BSE+NSE to form a portfolio of 10 stocks. The Indian market was smaller then. Fewer companies met the size threshold. This is real data, not a model artifact.
17 out of 103 periods (16.5%) were cash periods, concentrated in the early years plus scattered quarters when market conditions thinned the qualifying universe.
Run It Yourself
# Live screen (current India stocks)
python3 peg-ratio/screen.py --preset india

# Historical backtest (India only)
python3 peg-ratio/backtest.py --preset india --output results/india.json --verbose
Limitations
Volatility is high. 32.01% annualized volatility. The max drawdown of -66.11% is extreme. This strategy required holding through two periods of 35%+ annual losses (2008, 2011). The down capture of 101.7% vs Sensex means the portfolio falls roughly in line with (or slightly worse than) the index during downturns. The alpha comes from the recoveries.
Beta near 1. With a beta of 1.036 vs the Sensex, this portfolio moves with the Indian market. The +2.56% excess CAGR is real alpha, but it doesn't come with downside protection.
Early cash periods. The 2000-2003 cash position means the backtest only started capturing India returns from 2004. This happens to miss the initial Sensex runup from 3,000, which affects the total return calculation.
Point-in-time data limitations. FMP data for India before 2005 is thinner than post-2010. The early annual returns carry higher data uncertainty.
Part of a Series
- PEG Ratio in the US → (flagship, full methodology)
- PEG Ratio in South Africa → (low beta, downside protection)
- PEG Ratio in Canada →
- PEG Ratio in Sweden →
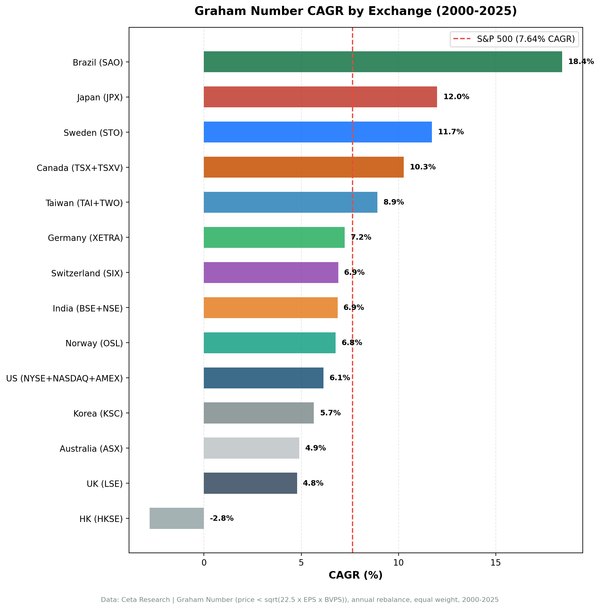
- 17-Exchange Comparison →
Data: Ceta Research (FMP financial data warehouse), BSE+NSE, 2000-2025. Returns in INR. Benchmark: Sensex. Execution: next-day close. Full methodology: METHODOLOGY.md