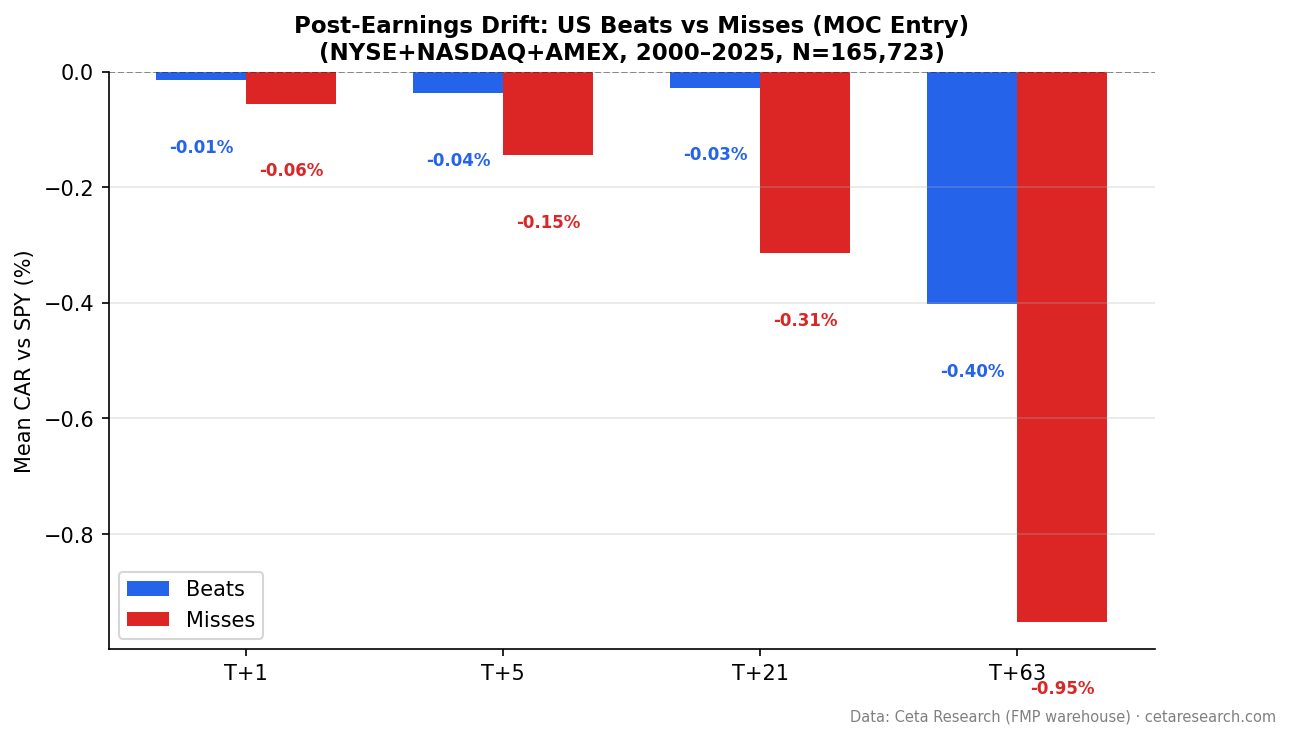
Post-Earnings Announcement Drift: 25 Years of US Data
We analyzed 165,723 earnings events from 2000-2025 on NYSE/NASDAQ/AMEX with next-day close entry. Beats drift -0.40% vs SPY at T+63. Misses decline -0.95%. Q5-Q1 spread: +1.18pp. The announcement-day reaction is the bulk of PEAD. Post-entry, the US signal is a miss-avoidance tool.

Stocks that beat earnings estimates drift higher for weeks. Stocks that miss keep falling. This has been known since 1968 and it still shows up in the data today.
Contents
- The Strategy
- What We Found
- The Academic Evidence
- Why the Market Under-Reacts
- Beat Rate Trend
- Limitations
- Takeaway
- References
We ran the full event study on 165,723 earnings events from NYSE, NASDAQ, and AMEX between 2000 and 2025. With next-day close entry (the earliest you can actually trade after seeing the announcement), beats drifted -0.40% vs SPY over 63 trading days. Misses declined -0.95%. The Q5-Q1 quintile spread is +1.18 percentage points, confirming the relative signal. But the announcement-day reaction captures most of the "drift." Post-entry, the tradeable edge in US large-caps is thin.
The Strategy
Post-Earnings Announcement Drift (PEAD) is an event study, not a portfolio backtest. We don't hold positions. We measure what happens to stock prices in the days and weeks following an earnings surprise.
The signal: Surprise = (epsActual - epsEstimated) / |epsEstimated|
A positive number means the company beat estimates. A negative number means it missed.
Parameters:
- Universe: NYSE + NASDAQ + AMEX, market cap > $1B (historical FY)
- Period: 2000-2025 (165,723 events)
- Benchmark: SPY (cumulative abnormal return vs SPY)
- Execution: Next-day close (MOC). Entry price is the close on the first trading day after the announcement.
- Surprise cap: |surprise| <= 200% (controls for near-zero estimate noise)
- Winsorized means: 1st/99th percentile (median uses raw values)
- Event windows: T+1, T+5, T+21, T+63 trading days from entry
Data: Ceta Research (FMP financial data warehouse), earnings_surprises table.
Screen for current earnings surprises:
SELECT symbol,
    CAST(date AS DATE) AS event_date,
    epsActual AS actual_eps,
    epsEstimated AS est_eps,
    ROUND((epsActual - epsEstimated)
        / ABS(NULLIF(epsEstimated, 0)) * 100, 1) AS surprise_pct
FROM earnings_surprises
WHERE CAST(date AS DATE) >= CURRENT_DATE - INTERVAL '30' DAY
  AND epsEstimated IS NOT NULL
  AND ABS(epsEstimated) > 0.01
  AND epsActual > epsEstimated
ORDER BY surprise_pct DESC
LIMIT 30
What We Found
The relative signal is real, but the tradeable drift is smaller than the announcement-day reaction suggests.
With next-day close entry, neither beats nor misses produce large positive abnormal returns:
| Category | T+1 | T+5 | T+21 | T+63 |
|---|---|---|---|---|
| Beats (102,865 events) | -0.02% | -0.04% | -0.03% | -0.40% |
| Misses (62,858 events) | -0.06% | -0.15% | -0.32% | -0.95% |
Misses still drift worse than beats. At T+63, misses decline -0.95% vs -0.40% for beats. Both underperform SPY, but misses underperform more. The miss signal is statistically significant (t=-12.59). Beats T+63 is also significant (t=-7.86), but negative.
The critical finding: what earlier studies measured as "drift" was largely the announcement-day price reaction. When you enter at the next-day close (the first realistic entry point), the post-entry abnormal return is much smaller.
The quintile relationship is monotonic.
We sorted all events into five groups by surprise magnitude:
| Quintile | Surprise Range | CAR at T+63 |
|---|---|---|
| Q1 (worst misses) | -200% to -8.0% | -1.35% |
| Q2 | -8.0% to 1.3% | -0.56% |
| Q3 | 1.3% to 7.5% | -0.52% |
| Q4 | 7.5% to 20.8% | -0.39% |
| Q5 (biggest beats) | 20.8% to 200% | -0.17% |
From Q1 to Q5, the pattern holds. Bigger beats produce less negative drift. Bigger misses produce more decline. The Q5-Q1 spread is +1.18 percentage points. All quintiles are negative (underperforming SPY), but the gradient is monotonic. The relative signal survives even when the absolute drift doesn't.
The relative signal is flat across windows.
The Q5-Q1 spread by window:
| Window | Q5 CAR | Q1 CAR | Spread |
|---|---|---|---|
| T+1 | -0.00% | -0.07% | +0.07pp |
| T+5 | -0.03% | -0.17% | +0.14pp |
| T+21 | +0.06% | -0.53% | +0.59pp |
| T+63 | -0.17% | -1.35% | +1.18pp |
The spread widens over time, driven by Q1 (worst misses) continuing to underperform. Q5 stays near zero. The edge in the US, if any, is avoiding the worst miss quintile rather than chasing the best beat quintile.
The Academic Evidence
Ball and Brown (1968) first documented PEAD. They showed stock prices didn't fully adjust to earnings information at announcement. The adjustment continued for months.
Bernard and Thomas (1989, 1990) confirmed it across two decades of data. They reported Q5 drift of roughly 2-4% over 60 days, with stronger effects for small-cap and low-coverage stocks.
Our Q5 drift (-0.17% at T+63, with next-day close entry) is substantially smaller than their figures. Two factors explain the gap: we enter at the next-day close (removing the announcement-day reaction they captured), and the signal has compressed over 35 years of quantitative capital targeting it. The relative quintile gradient persists, but the absolute drift for top-quintile beats has effectively disappeared in US large-caps.
Why the Market Under-Reacts
Three mechanisms:
Anchoring. When earnings beat estimates, investors update their expectations upward but not fully. They treat part of the beat as temporary. Price adjustment happens in steps over weeks.
Slow information processing. Not everyone acts on earnings news at the same time. Institutional investors with systematic processes react fast. Retail investors, smaller funds, and less-covered stocks take longer. Information diffuses gradually.
Institutional frictions. Many funds can't trade on earnings day due to internal approvals and mandate restrictions. They act later, creating demand that sustains the drift.
Beat Rate Trend
Beat rates have risen steadily over the study period:
| Era | Avg Beat Rate |
|---|---|
| 2000-2009 | ~57% |
| 2010-2019 | ~60% |
| 2020-2025 | ~65% |
By 2021, 69.9% of events were positive surprises. Companies have gotten better at managing analyst expectations downward before reporting. The quintile gradient survives this trend, though the absolute beat drift has vanished with MOC execution.
Limitations
MOC execution removes announcement-day reaction. Entering at next-day close means the price already reflects the initial market reaction to the earnings surprise. This is realistic (you can't trade on information you don't have yet) but removes the largest component of traditional PEAD measurement.
Benchmark simplification. SPY as sole benchmark. A Fama-French multi-factor model would more precisely isolate the earnings-specific abnormal return. Size and value exposures may inflate or deflate our estimates.
Transaction costs. We measure gross abnormal returns. Bid-ask spreads and market impact reduce actual capture, especially for smaller-cap stocks in the earlier years.
Estimate quality. The earnings_surprises table provides consensus estimates. In practice, estimate revisions in the days before announcement can reduce the "surprise" the market actually experienced.
Surprise cap. We cap at 200% to reduce noise from near-zero estimates. Approximately 4-6% of events are excluded by this filter.
Crowding. PEAD is well-known. Quantitative funds and systematic traders target earnings events. The signal has compressed substantially since Bernard and Thomas documented 2-4% drift.
Takeaway
PEAD in US large-caps is statistically detectable but practically thin with realistic execution. With next-day close entry, beats don't produce positive abnormal returns. Misses still underperform, and the Q5-Q1 quintile spread of +1.18 percentage points confirms the relative signal survives.
The announcement-day reaction accounts for most of what traditional PEAD studies measure. Once that's removed, the remaining drift is primarily a miss-avoidance signal. Q1 (worst misses) keeps declining over 63 days. Q5 (biggest beats) stays flat.
The practical implication: PEAD in the US is a sorting signal, not an alpha generator. It tells you which stocks to avoid, not which to buy. For tradeable beat-side PEAD, emerging markets with less systematic capital offer meaningfully larger post-entry drift.
Data: Ceta Research (FMP financial data warehouse). 165,723 events, NYSE+NASDAQ+AMEX, 2000-2025. Market cap > $1B. MOC execution (next-day close entry). Abnormal returns computed vs SPY. 1st/99th percentile winsorization. Surprise cap 200%. Past performance does not guarantee future results. Educational content only, not investment advice.
References
- Ball, R. & Brown, P. (1968). "An Empirical Evaluation of Accounting Income Numbers." Journal of Accounting Research, 6(2), 159-178.
- Bernard, V. & Thomas, J. (1989). "Post-Earnings-Announcement Drift: Delayed Price Response or Risk Premium?" Journal of Accounting Research, 27(Supplement), 1-36.
- Bernard, V. & Thomas, J. (1990). "Evidence that Stock Prices Do Not Fully Reflect the Implications of Current Earnings for Future Earnings." Journal of Accounting and Economics, 13(4), 305-340.