Post-Earnings Drift in India: The Strongest PEAD Signal in the World
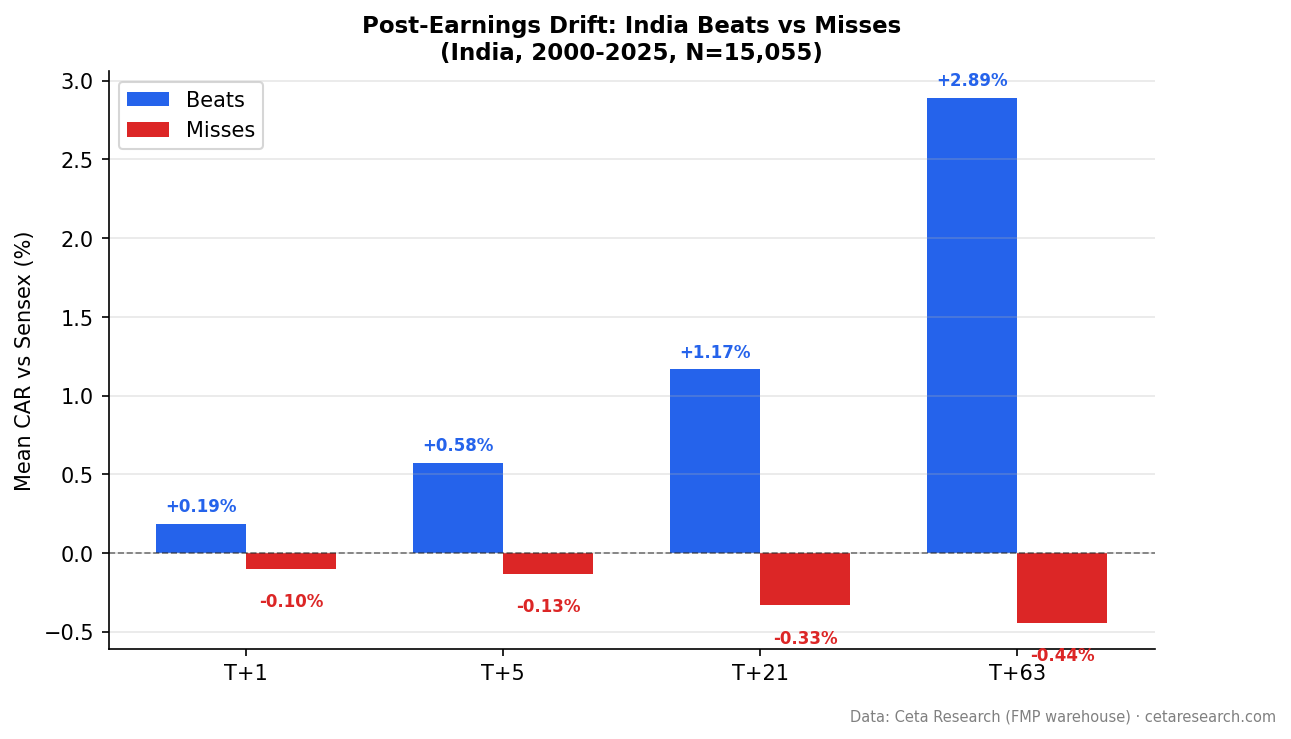
Indian stocks drift +2.89% vs the Sensex after positive earnings surprises over 63 trading days (next-day close entry). Q5-Q1 spread: +5.17pp. In a world where US beats show no post-entry drift, India's signal is the strongest globally.

India has the strongest Post-Earnings Announcement Drift of any market we tested.
Contents
- The Strategy
- What We Found
- Why India Shows Stronger PEAD
- The Academic Context
- Limitations
- Takeaway
- References
Stocks on BSE and NSE that beat earnings estimates drifted +2.89% vs the Sensex over 63 trading days, using next-day close entry. The Q5-Q1 quintile spread is +5.17 percentage points. In a world where US beats don't even produce positive post-entry drift (-0.40%), India's signal is an order of magnitude stronger.
This is a structural feature of how information gets priced into Indian stocks: slower, less systematically, with more room for the signal to persist after entry.
The Strategy
Same methodology as the global study. We measure Cumulative Abnormal Return (CAR) for each earnings event at T+1, T+5, T+21, and T+63 trading days.
Signal: Surprise = (epsActual - epsEstimated) / |epsEstimated|
Parameters:
- Universe: BSE + NSE, market cap > ₹20B (historical FY key_metrics)
- Period: 2000-2025 (15,055 events: 7,033 beats, 8,022 misses)
- Benchmark: Sensex (^BSESN, local currency)
- Execution: Next-day close (MOC)
- Surprise cap: |surprise| <= 200%
- Winsorized means: 1st/99th percentile
Screen for current India earnings surprises:
SELECT symbol,
    CAST(date AS DATE) AS event_date,
    epsActual AS actual_eps,
    epsEstimated AS est_eps,
    ROUND((epsActual - epsEstimated)
        / ABS(NULLIF(epsEstimated, 0)) * 100, 1) AS surprise_pct
FROM earnings_surprises
WHERE CAST(date AS DATE) >= CURRENT_DATE - INTERVAL '30' DAY
  AND epsEstimated IS NOT NULL
  AND ABS(epsEstimated) > 0.01
  AND epsActual > epsEstimated
ORDER BY surprise_pct DESC
LIMIT 30
Run this screen on Ceta Research →
What We Found
The drift keeps building. In the US, post-entry drift for beats is essentially zero. In India, the signal keeps accelerating:
| Window | India Beats CAR | US Beats CAR |
|---|---|---|
| T+1 | +0.19% | -0.02% |
| T+5 | +0.58% | -0.04% |
| T+21 | +1.17% | -0.03% |
| T+63 | +2.89% | -0.40% |
By T+63, India beats have drifted +2.89% vs the Sensex while US beats are negative vs SPY. The divergence is fundamental: information diffuses slowly in India and quickly in the US.
T+63 t-statistic for India beats: 15.35. The hit rate for Indian beats at T+63 is 53.6%, meaning more than half of all positive surprise events outperformed the Sensex over 63 days.
The quintile spread is wider.
| Quintile | Surprise Range | CAR at T+63 |
|---|---|---|
| Q1 (worst misses) | -199.8% to -22.7% | -0.94% |
| Q2 | -22.7% to -5.2% | -0.36% |
| Q3 | -5.2% to 2.7% | +0.12% |
| Q4 | 2.7% to 17.6% | +2.49% |
| Q5 (biggest beats) | 17.6% to 200% | +4.24% |
Q5-Q1 spread: +5.17 percentage points. Q5 alone is +4.24% at T+63.
Misses now show modest negative drift. With the Sensex as benchmark (rather than the INDA ETF), India misses at T+63 show -0.44% mean CAR (t=-2.58, significant). The miss signal is real but small compared to the beat signal. The story in India is primarily about the positive side: beats produce strong, persistent drift that builds over 63 days.
Why India Shows Stronger PEAD
Lower analyst coverage. The median Indian mid-cap has 2-4 analysts covering it. US large-caps have 20-30. Fewer analysts means slower model updates, slower price discovery, and more drift after surprises.
Retail-dominated trading. India's equity markets have a higher proportion of retail traders versus systematic institutional capital. Retail investors process earnings news more slowly. They act over days and weeks, not hours.
Less arbitrage capital targeting the signal. PEAD is one of the most exploited anomalies in US markets. Quantitative hedge funds have been targeting earnings drift for decades, compressing the available edge. India has substantially less systematic capital actively targeting the same signal.
Earnings reporting dynamics. Indian companies report quarterly with different analyst expectation management practices. The "beat the estimate" game that inflates US beat rates to 65% hasn't fully transferred to Indian markets, where the surprises tend to be more genuine.
The Academic Context
Bernard and Thomas (1989, 1990) documented PEAD effects of 2-4% in the US in the late 1980s. They specifically noted that smaller, less-covered stocks showed stronger effects. India's finding (+2.89% for beats vs the Sensex, with next-day close entry) fits what the theory predicts: in markets with less coverage and slower information diffusion, the drift should be larger. That it persists even after removing the announcement-day reaction makes it more striking than the original US findings.
Limitations
Coverage evolution. The BSE/NSE dataset has sparse events in early years, growing to 2,000+ annually by 2022. The main signal is driven by 2018-2025 where coverage is denser.
Sensex as benchmark. The Sensex tracks India's 30 largest companies. Using it as benchmark for mid-cap BSE stocks introduces a size mismatch. Some of the abnormal returns may reflect size premium rather than pure earnings drift. The Sensex is a more appropriate benchmark than the INDA ETF (used in earlier versions of this study) because it avoids USD/INR currency distortion.
Currency effects. Returns are computed in local currency. INR/USD fluctuations affect US investors' actual returns.
Regime risk. India's equity market has grown substantially since 2000. As more quantitative capital enters Indian markets targeting PEAD, the edge will likely compress toward developed-market levels.
Takeaway
India has the strongest Post-Earnings Announcement Drift we measured across 16 global markets. The T+63 beat drift of +2.89% vs the Sensex (t=15.35) is statistically and economically significant, even with next-day close entry. The Q5-Q1 spread of +5.17pp provides a clear trading structure.
The explanation is structural: lower analyst coverage, slower information diffusion, and less systematic arbitrage capital targeting the signal. These conditions won't disappear overnight.
For investors with access to Indian equity markets, PEAD on BSE/NSE shows a meaningfully larger signal than in developed markets, where beat drift has effectively vanished post-entry. The question is whether transaction costs and execution friction erode the edge.
Data: Ceta Research (FMP financial data warehouse). 15,055 events, BSE+NSE, 2000-2025. Market cap > ₹20B. MOC execution (next-day close entry). Abnormal returns computed vs Sensex. 1st/99th percentile winsorization. Surprise cap 200%. Past performance does not guarantee future results. Educational content only, not investment advice.
References
- Ball, R. & Brown, P. (1968). "An Empirical Evaluation of Accounting Income Numbers." Journal of Accounting Research, 6(2), 159-178.
- Bernard, V. & Thomas, J. (1989). "Post-Earnings-Announcement Drift: Delayed Price Response or Risk Premium?" Journal of Accounting Research, 27(Supplement), 1-36.
- Bernard, V. & Thomas, J. (1990). "Evidence that Stock Prices Do Not Fully Reflect the Implications of Current Earnings for Future Earnings." Journal of Accounting and Economics, 13(4), 305-340.